To Choose Line Charts or Area Charts
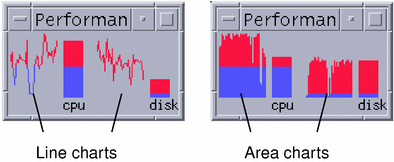
The optional chart displayed for each parameter can be one of the following types:
-
A line chart (the default), which represents activity using a continuous line
-
An area chart, which is the same as a line chart but with the area between the line and the horizontal axis filled

-
Choose Setup from the Options menu.
Performance Meter displays the Setup dialog box.
-
Select the Solid choice button for area charts or the Line choice button for line charts.
-
(Optional) Select the Show Limit Line checkbox if you want your charts to indicate the threshold value using a line.
-
Click Apply when you are satisfied with the changes you have made.
Performance Meter displays the information using the specified charts.
- © 2010, Oracle Corporation and/or its affiliates
