 To Inspect the Dead Message Queue
A number of troubleshooting procedures involve an inspection of the dead message queue (mq.sys.dmq). The following procedure explains how to carry out such an inspection by using the QBrowser demo application.
-
Locate the QBrowser demo application.
See Appendix A, Platform-Specific Locations of Message Queue Data and look in the tables for “Example Applications and Locations.”
-
Run the QBrowser application.
Here is an example invocation on the Windows platform:
cd \MessageQueue3\demo\applications\qbrowser java QBrowser
The QBrowser main window appears.
-
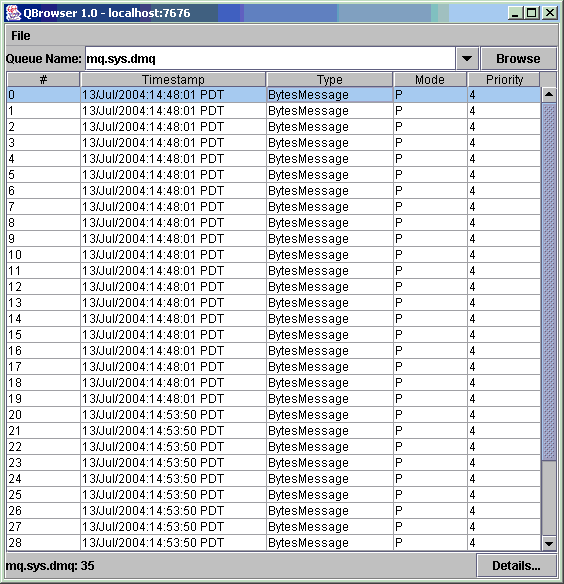
Select the queue name mq.sys.dmq and click Browse.
A list like the following appears:

-
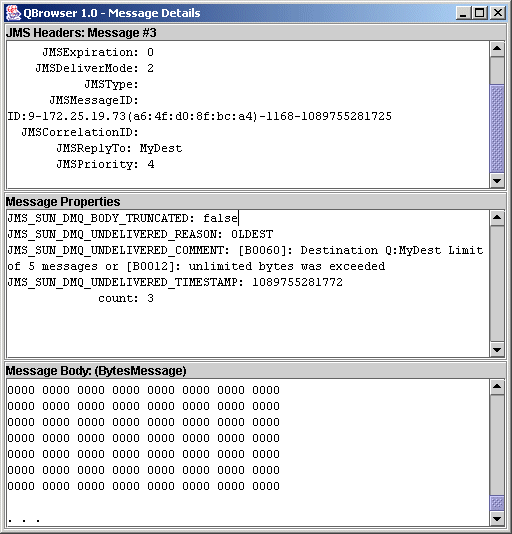
Double-click any message to display details about that message:
The display should resemble the following:

You can inspect the Message Properties pane to determine the reason why the message was placed in the dead message queue.
- © 2010, Oracle Corporation and/or its affiliates
