Chapter 3 Installing and Using Monitoring Console
Monitoring Console is the web-based application that displays all of the monitoring data collected by the instrumentation. It relies on a master agent to aggregate all the values and alarm notifications from each of the node agents.
Once Monitoring Console is installed, you can access it securely from a simple browser window on any host, even over the Internet if your firewall is configured to allow it. Using the graphical interface, you can then see monitored values in real-time, view and acknowledge alarms, and create rules for triggering custom alarms.
Note –
Before you perform any installation or configuration, you should consult the Sun Java Enterprise System 5 Release Notes for UNIX.
This chapter contains the following sections:
Installing the Monitoring Console
Due to limitations of the master agent in this release, you cannot have a master agent on the same host as a node agent. As a consequence, the Monitoring Console cannot be installed on the same host as any of the other monitored components of Java ES. It must be installed on its own host, unless you have configured Solaris zones. For more information, see below To Install the Monitoring Console in a Solaris Zone
The installation of Monitoring Console also installs Monitoring Framework as a shared component dependency. The console requires the framework and the Common Agent Container to load the master agent, but unlike the node agent, the master agent is not user-configurable. Specifically, you should not use the mfwkadm command on the host or in the zone where you install Monitoring Console.
 To Install the Monitoring Console with the Java ES Installer
Because of a limitation in this beta release, you must install Monitoring Console on a host or Solaris zone where no other Java ES component is installed. As a result, the Monitoring Console is the only component you will install in this procedure.
This procedure uses the installer's graphical interface. For information on how to run the installer in other modes, see Chapter 4, Installing With the Text-Based Interface, in Sun Java Enterprise System 5 Installation Guide for UNIX and Chapter 5, Installing in Silent Mode, in Sun Java Enterprise System 5 Installation Guide for UNIX.
-
Launch the installer application from the directory the corresponds to your platform in the Java ES release. For further details, see To Begin Installation in Sun Java Enterprise System 5 Installation Guide for UNIX.
-
After continuing past the welcome screen and accepting the license, choose to Upgrade or Install, select Install New Software, and then click next.
-
On the component selection screen, select only the Sun Java System Monitoring Console to be installed. Click Next.
-
The installer checks for needed upgrades to the shared components. When it is done, click Next.
-
The installer now checks system requirements. If your operating system needs patches, Cancel the installation, add the required patches to your system and restart this procedure. Otherwise click Next.
-
On the configuration type selection screen, chose Configure Now and on the next custom configuration screen, click Next.
-
The installer is ready to install the Monitoring Console, click Next to begin. During the installation, you may open the product registration window if you have not yet registered your deployment of Java ES.
-
When the installation is done, you may review the installation summary and logs and then click Installation Complete to exit the installer.
Next Steps
You should now proceed To Configure the Monitoring Console.
 To Install the Monitoring Console in a Solaris Zone
By using Solaris zones, you can install the Monitoring Console on the same physical host as other components of Java ES. Those components will be in the global zone, and you will create a sparse root local zone to be a logical host for the Monitoring Console. Proceed in the following order.
-
Install and configure all of you Java ES components except the Monitoring Console in the global zone. Complete all post-installation configuration of your selected components in the global zone so that all server instances are running.
-
As part of the installation in the global zone, the Monitoring Framework will be installed as a shared component in the global zone. Perform all procedures in Chapter 2, Enabling and Configuring the Monitoring Framework that are applicable to your installed components.
-
On the same host, create a sparse root local zone as the logical host for the Monitoring Console. Because it is a sparse root zone, the Monitoring Framework installed in mfwk-base should be visible (see Default Paths and File Names).
-
Install the Monitoring Console in the sparse root local zone following the procedure To Install the Monitoring Console with the Java ES Installer.
-
Configure the Monitoring Framework in the sparse root zone with the following commands:
cd mfwk-base/bin
./mfwksetup -i
Using the files from the global zone, this command will create the necessary Monitoring Framework configuration files in the local zone.
Next Steps
You should now proceed To Configure the Monitoring Console.
 To Configure the Monitoring Console
This procedure describes how to configure Monitoring Console on a separate physical host. If you installed Monitoring Console on a logical host created by a Solaris zone, the commands are the same but they must be run within that zone's file system.
-
Use the Monitoring Framework to initialize the master agent with the following commands:
cd mfwk-base/bin
./masetup -i
-
Restart the Common Agent Container (cacao) with the following command:
cacaoadm restart
 To Unconfigure the Monitoring Console
If you install and configure Monitoring Console on a host where you wish to install other components, you will not be able to monitor those components because of a conflict in the Monitoring Framework. To monitor the new components with a node agent, you must unconfigure the master agent of the Monitoring Console.
As root, run the following commands to unconfigure the Monitoring Console:
cacaoadm stop cacaoadm unregister-module com.sun.mfwk.masteragent.xml cacaoadm register-module /etc/mfwk-base/xml/com.sun.mfwk.xml cacaoadm restart |
Installed Directory Layout
For the name of the package installed on your operating system, see Chapter 5, List of Installable Packages, in Sun Java Enterprise System 5 Installation Reference for UNIX. The following table describes the directories in the Monitoring Console package. The default installation directory MConsole-base has the following meaning, as described in Default Paths and File Names:
-
Solaris systems: /opt/SUNWjesmc
-
Linux systems: /opt/sun/jesmc
|
Path |
Description of contents |
|---|---|
|
MConsole-base/WEB-INF/classes |
Web application servlet classes |
|
MConsole-base/WEB-INF/lib |
Web application JAR dependencies |
|
MConsole-base/WEB-INF/*.xml |
Web application descriptors |
|
MConsole-base/css |
Stylesheet files |
|
MConsole-base/html |
HTML files |
|
MConsole-base/images |
GIF image files used in the user interface |
|
MConsole-base/js |
JavaSriptTM files |
|
MConsole-base/*.jsp |
JavaServer PagesTM files |
|
WebConsole-base/prereg/jesmc/*.reg |
Web Console files for the Monitoring Console |
Starting the Monitoring Console
The Monitoring Console is a web application available through any browser that can connect to the host where you installed it. You will access the Monitoring Console through the Web Console that is automatically installed on the same host. The following procedure explain how to access the Monitoring Console and view the monitored components.
 To Launch the Monitoring Console
-
You must first restart the web server for the Web Console. Run this command on the host or in the zone where you have installed Monitoring Console:
/usr/sbin/smcwebserver restart
-
Wait for the Web Console to be started. Use the following command to see if it is ready:
/usr/sbin/smcwebserver status
You might need to run this command several times until you see the following message:
Sun Java(TM) Web Console is running.
-
Open the Web Console using the following URL from any browser that can connect to the Monitoring Console host. If you installed in a Solaris zone, MC-host is the logical hostname you gave to that zone:
https://MC-host.domain:6789
-
Depending on how your browser is configured, you may see a message about an untrusted certificate. You will need to trust the certificate to access the Web Console.
-
When prompted, login to the Web Console as root using the root password on the Monitoring Console host.
When you are logged in, the Web Console lists all the services that it provides.
-
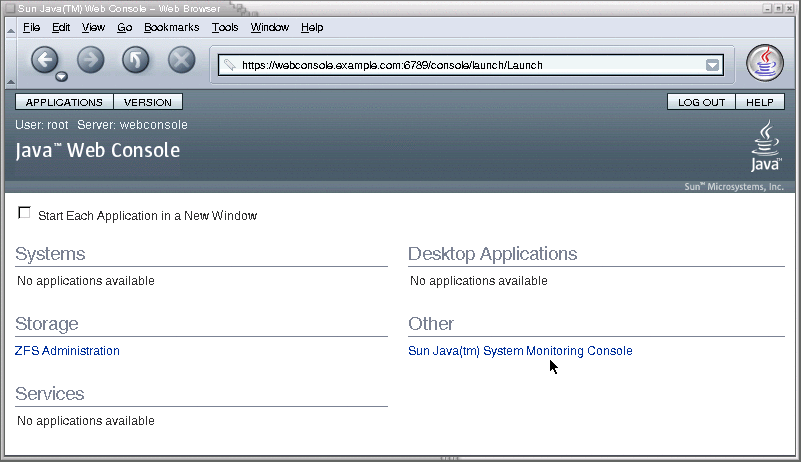
To open the main window of the Monitoring Console, click on Sun Java System Monitoring Console under the heading titled “Other,” as shown in the following screen capture.
 To Connect to Your Node Agents
When the Monitoring Console is started for the first time, you must indicate where your monitored components are hosted. You specify the location of each node agent in your Java ES deployment, and the console will automatically display all of the components in each node agent. You will also need to repeat this procedure if you later add Java ES components to your deployment by installing them on new hosts.
Once you add a node agent, the Monitoring Console will reconnect to it every time you access the console until you remove it explicitly. If a node agent you previously added is not responding, follow the procedure To Restart a Node Agent.
-
Synchronize the date and time between the logical host where the Monitoring Console is installed and the host containing the node agent and Java ES components you wish to monitor. Regardless of whether you synchronize automatically or manually, the time on each host must be within approximately 10 minutes of each other.
-
If necessary, navigate to the Deployment level display by clicking the “Deployment” link at the root of the hierarchy in the left-hand side of the Monitoring Console. Now select the Hosts tab in the right-hand pane and click Add.
-
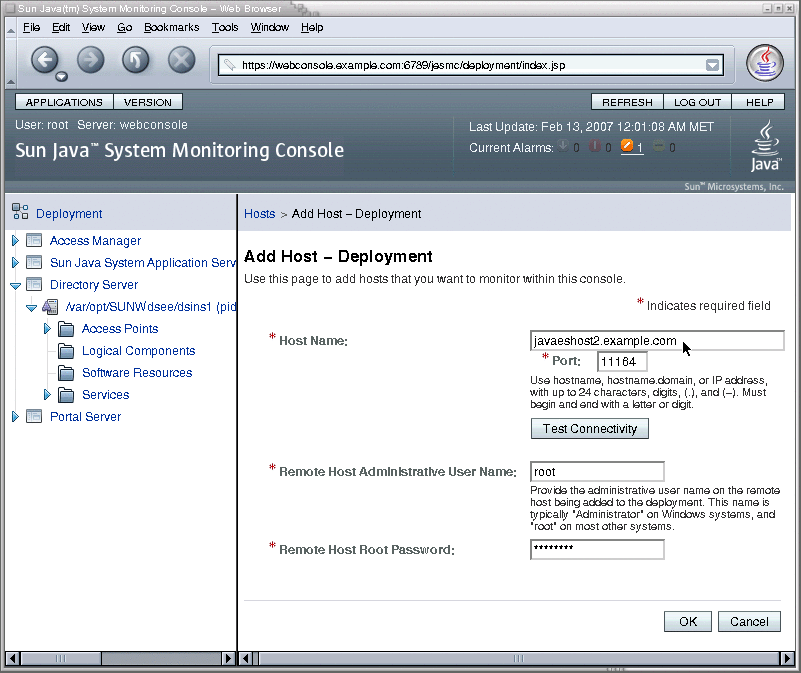
In the Add Host dialog that appears, enter the required information as shown in the following screen capture:
-
Host Name: enter the fully qualified host name of a node agent where you have configured monitored components.
-
Port: 11164, unless you have otherwise configured the Monitoring Framework on the host where the node agent resides.
-
Remote Host Root Password: enter the root password for the system where the node agent resides.
-
-
Click Test Connectivity.
If the connection information is correct and your host agent is configured and running, the dialog will indicate that it is now connected.
-
Click OK to finish the Add Host dialog, and the new name appears in the list of Hosts. All of the monitored components in that host's node agent now appear in the left column as well.
-
Repeat this procedure for every host in your Java ES deployment where monitored components are installed.
Next Steps
You can now browse the components listed in the left-hand column to view their operational status, the monitored attributes they expose, and any alarms they have triggered.
Using the Monitoring Console
The procedures in this section describe how to interact with the Monitoring Console.
 To Selectively Disable and Re-Enable Monitoring
The Java ES monitoring mechanisms are designed to be lightweight in order to not impact the performance of production systems. However, in certain cases it is desirable to stop collecting monitoring values so that the instrumentation has nearly zero impact on performance. The Monitoring Console provides a way to do this on a host-by-host basis, as described in the following procedure.
-
If necessary, navigate to the Deployment level display by clicking the “Deployment” link at the root of the hierarchy in the left-hand side of the Monitoring Console. Then click on the Hosts tab in the right-hand pane.
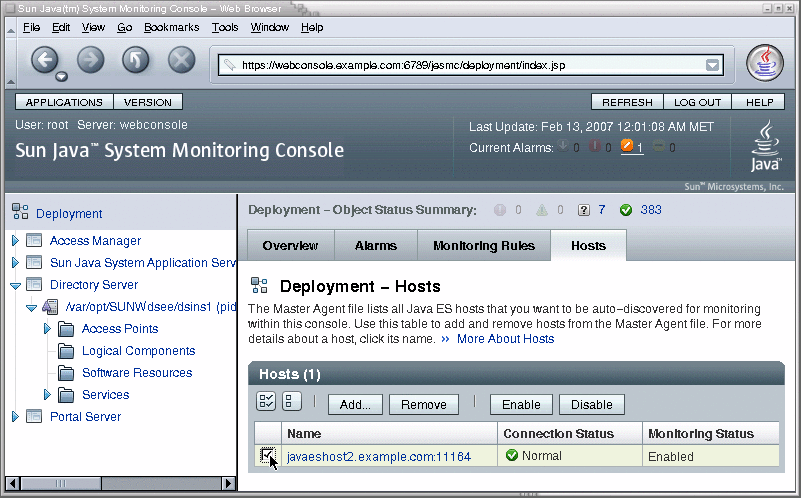
The table on the Hosts tab lists all of the hosts containing Java ES component that are monitored by the Monitoring Console.
-
Use the checkboxes in the left-hand column of the table to select all hosts that you wish stop monitoring. Click Disable at the top of the table of Hosts.
Consequences
When monitoring on a host is disabled, all monitoring object in the hierarchy under that host are disabled. In the disabled state, monitored objects are no longer updated, although they may still contain the last value. Monitoring rules that depend on a disabled object are suspended. To enable a host that was disabled, follow this procedure using the Enable button at the top of the table of Hosts.
 To Create a New Monitoring Rule
A monitoring rule, also called a monitoring job, is a set of conditions of monitored values that the user defines to trigger an alarm. The monitoring rule wizard in the Monitoring Console helps you define the conditions you would like to monitor.
-
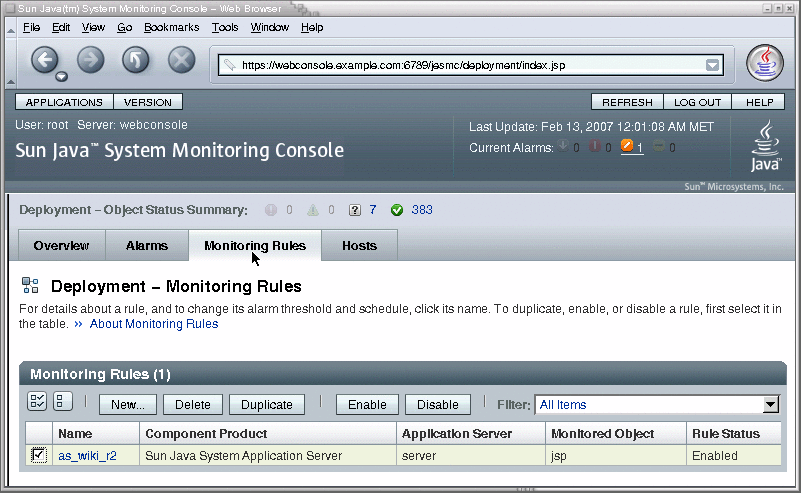
If necessary, navigate to the Deployment level display by clicking the “Deployment” link at the root of the hierarchy in the left-hand side of the Monitoring Console. Now select the Rules tab in the right-hand pane as shown in the following screen capture, and click New in the table of monitoring rules:
-
Give a name to your new monitoring rule and choose the type of server you wish to monitor.
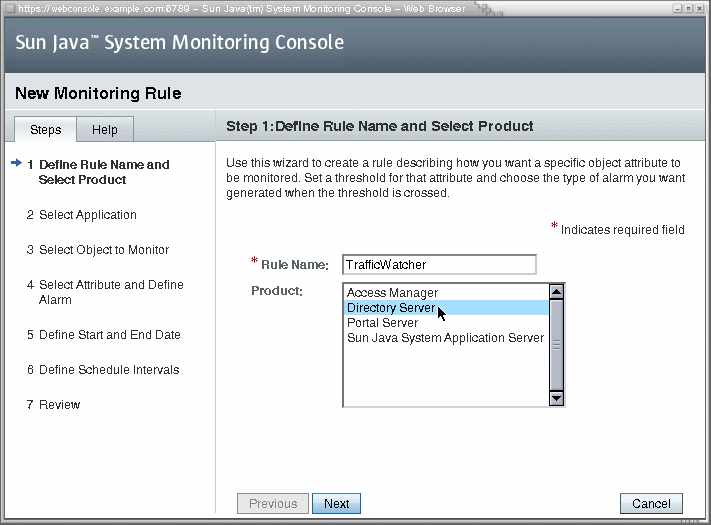
-
Choose the instance of the component product you wish to monitor. In the case when there are two instances of the same product installed on separate hosts, some instances may have identical names in this table. In this case, the instances may be in the same order as they appear in the hierarchy in the left-hand pane, but there is no sure way to know. You may need to create identical monitoring rules on both instances to ensure you rule is defined.
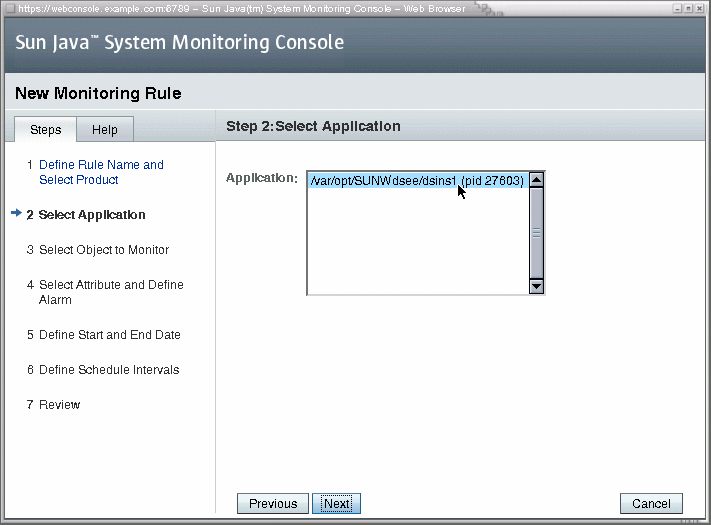
-
Select the object that contains the attribute you wish to monitor:
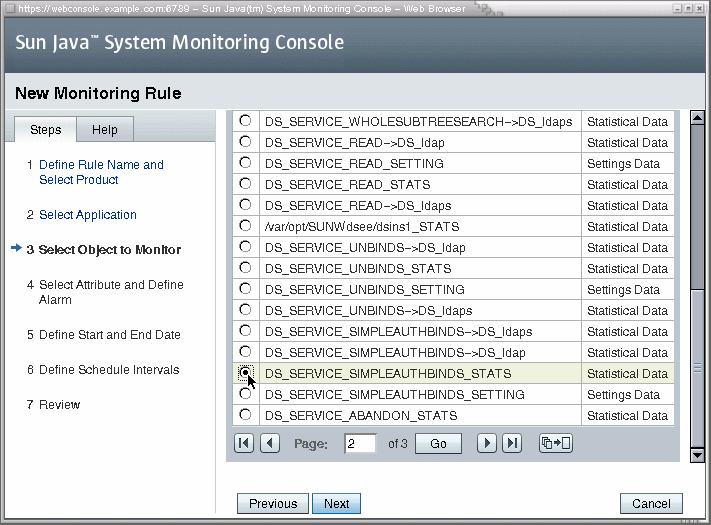
-
Now, you can finally specify the attribute that will be monitored along with the values that will generate an alarm.
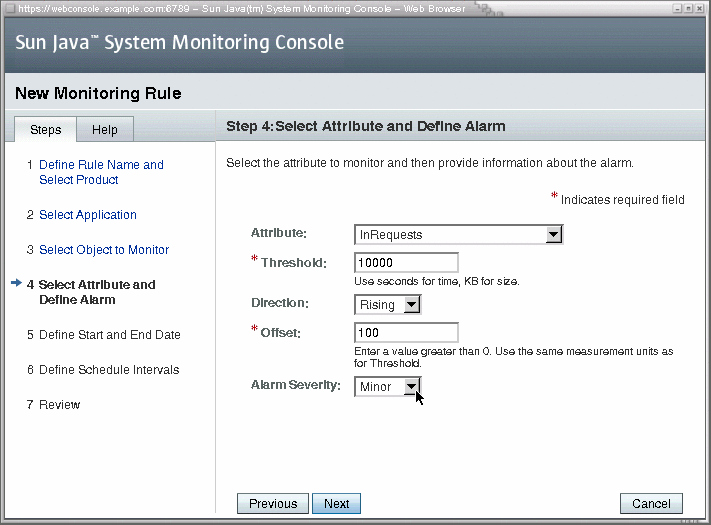
-
Enter start and end dates for the rule. Unlike the schedule which determines the activity or inactivity of a rule, the start and end dates determine when a rule is defined to exist. When a start time is in the past, as always happens with the default value, the monitoring associated with this rule will begin immediately
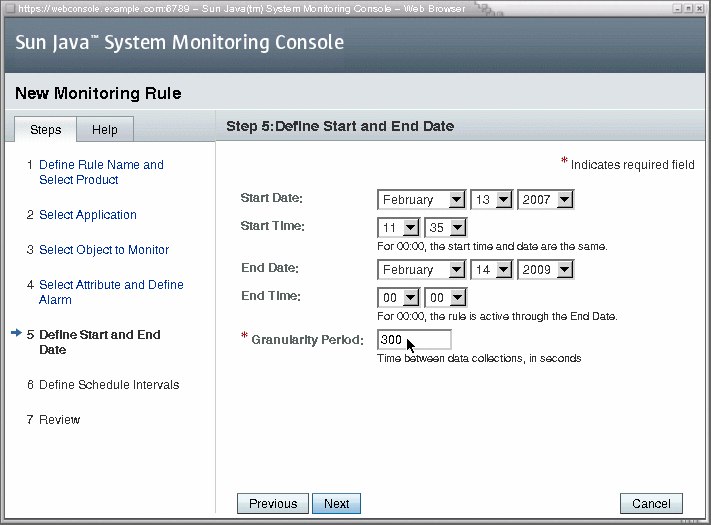
-
Optionally, use the controls to create one or more time ranges during which the rule will be actively monitoring You can also select the days of the week to create a weekly schedule.
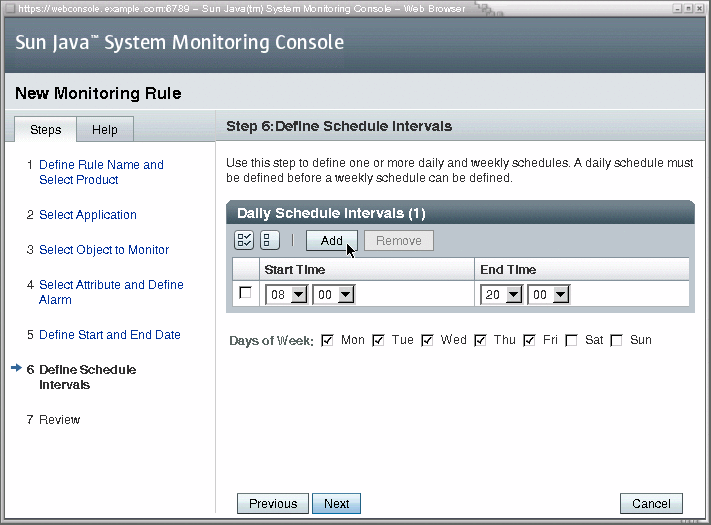
-
In this final step of the Rule Wizard, review your input and click Finish to create your new rule.
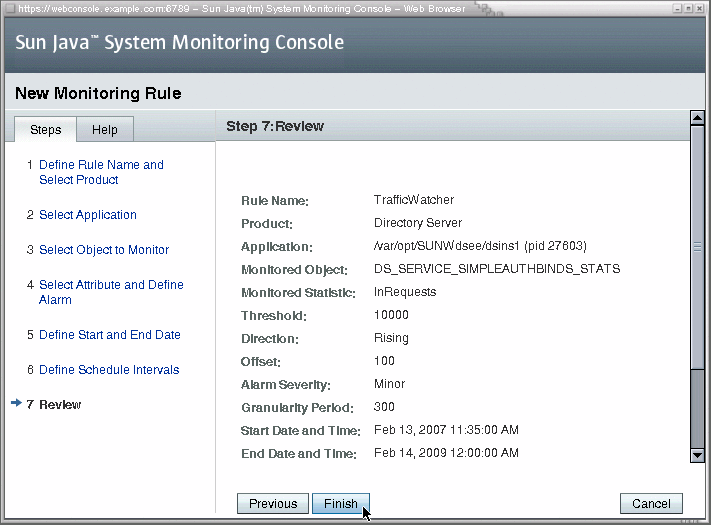
When the Rule Wizard is finished, you should see the Monitoring Rules tab again, with your new rule in the table of rules.
Troubleshooting the Monitoring Console
See also the known issues listed in the Sun Java Enterprise System 5 Release Notes for UNIX.
If the master agent is conflicting with a node agent, check the following conditions:
-
If you use Solaris zones, make sure you installed Monitoring Console in a sparse root local zone.
-
Make sure no previous installation of the monitored component remains on your host or in your zone.
-
In either case, you will need to uninstall Monitoring Console and any components, correct the problem, and redo the Monitoring Console installation.
If you uninstall the Monitoring Console and reinstall it on the same host, it will fail to initialize and will not appear in the Web Console. In this case, run the masetup –i command on the Monitoring Console host to initialize the master agent. Then follow the procedure to To Launch the Monitoring Console.
Monitoring rules have a limitation that only allows them to be disabled when they are active. If you wish to disable a rule whose schedule makes it inactive at the current time, you must either change its schedule to make it active briefly, or remove the rule entirely.
Due to limitations the Windows platform, the handleCount and threadCount values in the host statistics are always 0 (zero).
- © 2010, Oracle Corporation and/or its affiliates
