Using the Monitoring Console
The procedures in this section describe how to interact with the Monitoring Console.
 To Selectively Disable and Re-Enable Monitoring
The Java ES monitoring mechanisms are designed to be lightweight in order to not impact the performance of production systems. However, in certain cases it is desirable to stop collecting monitoring values so that the instrumentation has nearly zero impact on performance. The Monitoring Console provides a way to do this on a host-by-host basis, as described in the following procedure.
-
If necessary, navigate to the Deployment level display by clicking the “Deployment” link at the root of the hierarchy in the left-hand side of the Monitoring Console. Then click on the Hosts tab in the right-hand pane.
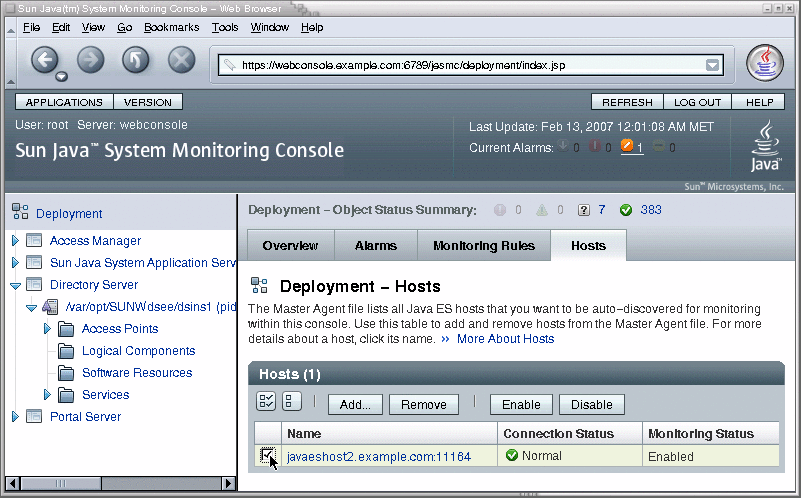
The table on the Hosts tab lists all of the hosts containing Java ES component that are monitored by the Monitoring Console.
-
Use the checkboxes in the left-hand column of the table to select all hosts that you wish stop monitoring. Click Disable at the top of the table of Hosts.
Consequences
When monitoring on a host is disabled, all monitoring object in the hierarchy under that host are disabled. In the disabled state, monitored objects are no longer updated, although they may still contain the last value. Monitoring rules that depend on a disabled object are suspended. To enable a host that was disabled, follow this procedure using the Enable button at the top of the table of Hosts.
 To Create a New Monitoring Rule
A monitoring rule, also called a monitoring job, is a set of conditions of monitored values that the user defines to trigger an alarm. The monitoring rule wizard in the Monitoring Console helps you define the conditions you would like to monitor.
-
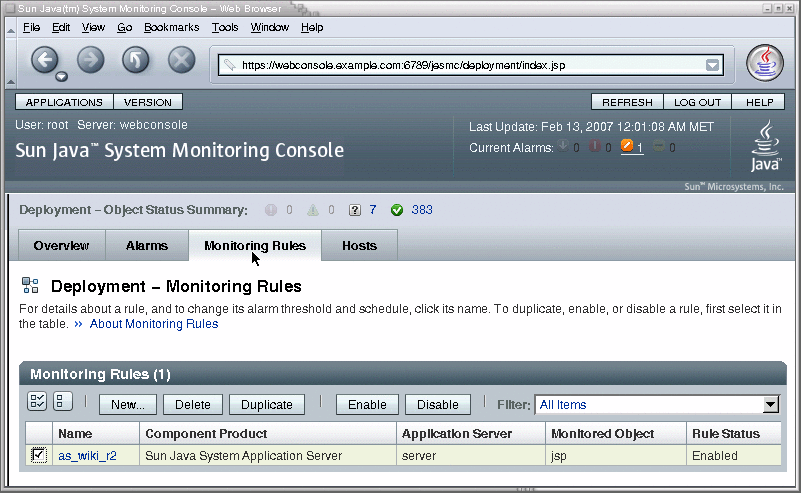
If necessary, navigate to the Deployment level display by clicking the “Deployment” link at the root of the hierarchy in the left-hand side of the Monitoring Console. Now select the Rules tab in the right-hand pane as shown in the following screen capture, and click New in the table of monitoring rules:
-
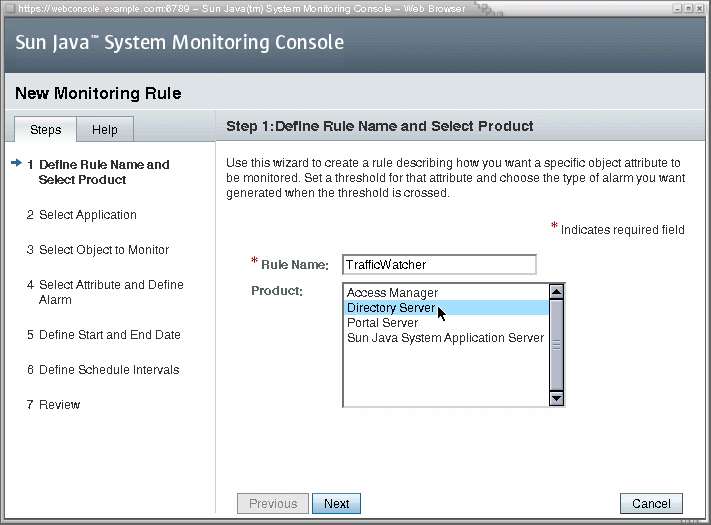
Give a name to your new monitoring rule and choose the type of server you wish to monitor.
-
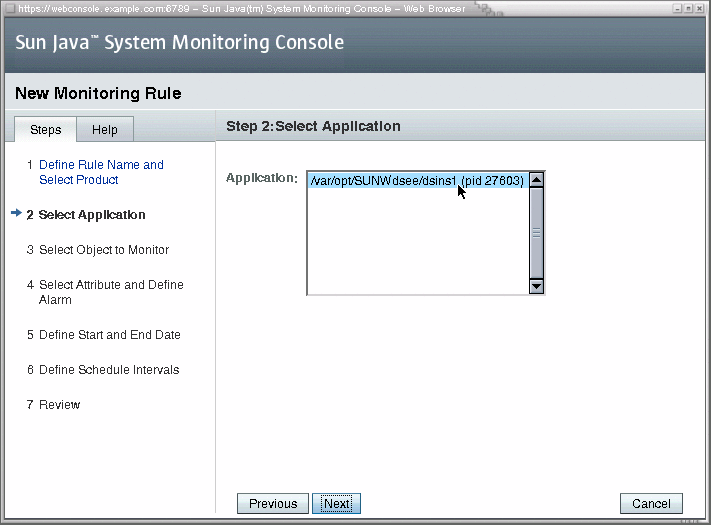
Choose the instance of the component product you wish to monitor. In the case when there are two instances of the same product installed on separate hosts, some instances may have identical names in this table. In this case, the instances may be in the same order as they appear in the hierarchy in the left-hand pane, but there is no sure way to know. You may need to create identical monitoring rules on both instances to ensure you rule is defined.
-
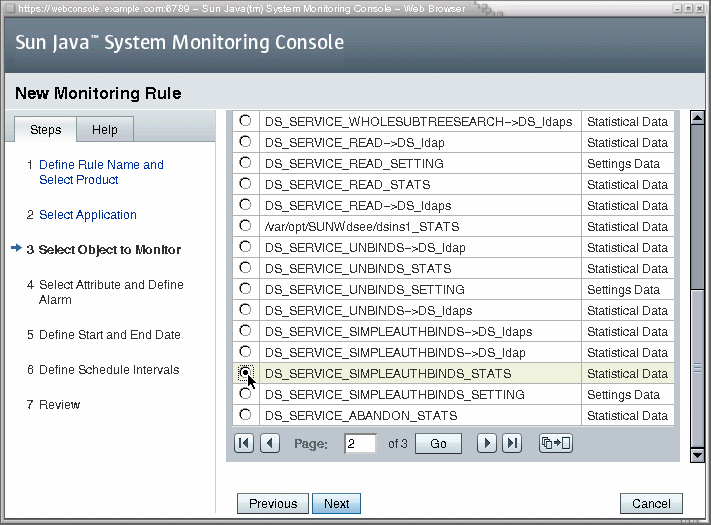
Select the object that contains the attribute you wish to monitor:
-
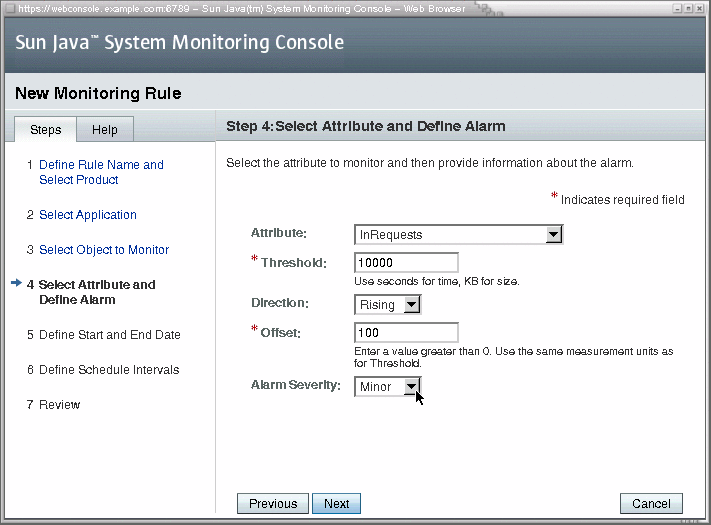
Now, you can finally specify the attribute that will be monitored along with the values that will generate an alarm.
-
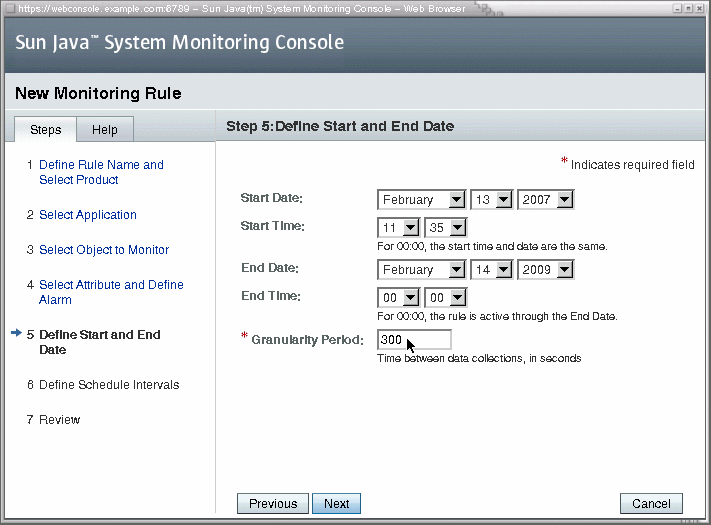
Enter start and end dates for the rule. Unlike the schedule which determines the activity or inactivity of a rule, the start and end dates determine when a rule is defined to exist. When a start time is in the past, as always happens with the default value, the monitoring associated with this rule will begin immediately
-
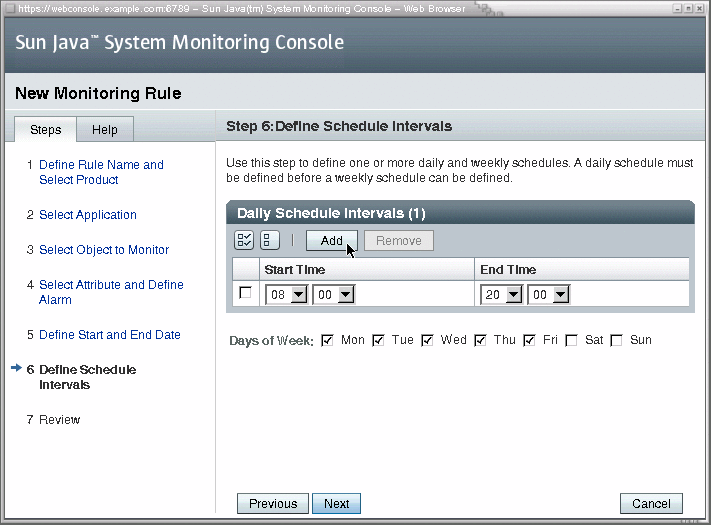
Optionally, use the controls to create one or more time ranges during which the rule will be actively monitoring You can also select the days of the week to create a weekly schedule.
-
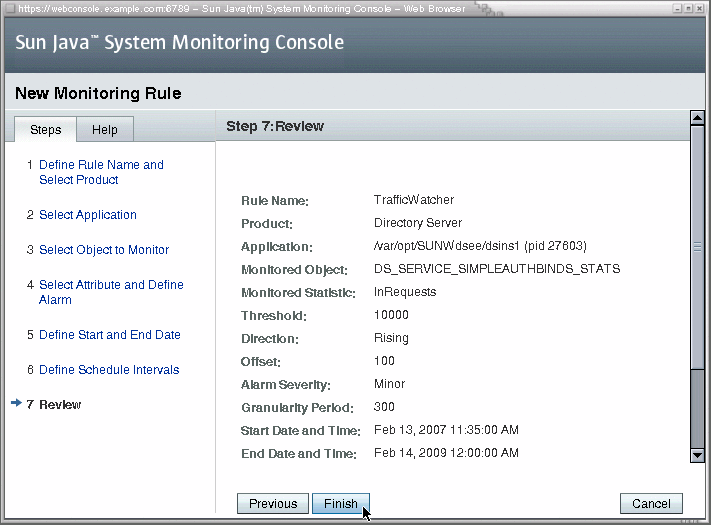
In this final step of the Rule Wizard, review your input and click Finish to create your new rule.
When the Rule Wizard is finished, you should see the Monitoring Rules tab again, with your new rule in the table of rules.
- © 2010, Oracle Corporation and/or its affiliates
