Monitoring and Logging
The admin user need to access Control Panel -> Server -> Server Administration for monitoring and logging in Sun GlassFish Web Space Server.
Monitoring in Sun GlassFish Web Space Server
Sign in to Web Space Server as admin user, and navigate to Control Panel -> Server -> Server Administration from the Welcome menu.
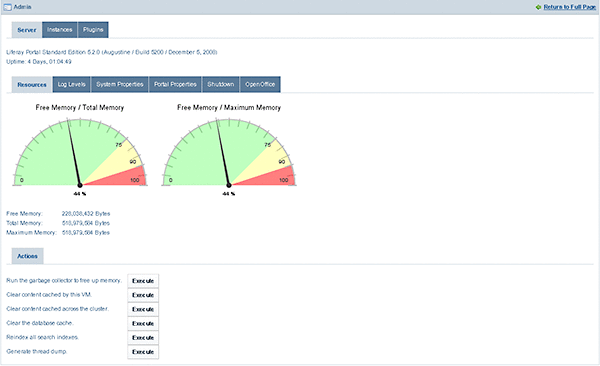
Figure 10–2 Monitoring of Resources

You can execute a resource maintenance action by selecting the Execute button next to any option in the following list of actions. You can execute the following actions:
- Run the garbage collector to free up memory
-
Garbage collection frees memory occupied by unused objects. Click the Execute buttonnext to the Run the garbage collector to free up memory option. It increases the 'Free Memory' considerably.
- Clear content cached by this VM
-
The Virtual Machine identifies the web page responses that are the same for each request and to remember (cache) the content. In some cases it can be useful to clear this cache to free the memory.
- Clear content cached across the cluster
-
Executing this action clears the cluster cache.
- Clear the database cache
-
Executing this action clears the database cache.
- Reindex all search indexes
-
Executing this action removes all old search entries.
- Generate thread dump
-
When the application server freezes or hangs or becomes sluggish for no apparent reason, it is recommended to generate a thread dump. Executing this action generates a thread dump.
Logging in Sun GlassFish Web Space Server
Web Space Server uses Log4j extensively to implement logging for nearly every class in the portal. If you need to debug something specific while a system is running, you can use the Admin portlet to set logging levels by class dynamically.
Sign in to Web Space Server as admin user, and navigate to Control Panel -> Server -> Server Administration from the Welcome menu. Sign in as admin user to access the Admin portlet. To view the log levels, select the Log Levels tab.
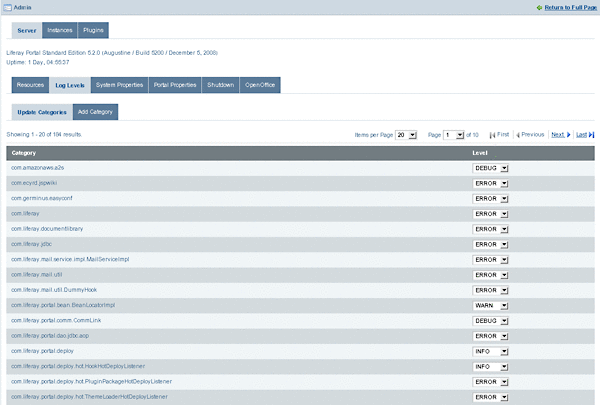
You will then see a paginated list of logging categories. You can select a logging level for a category from the list. If the logging level is set to ERROR, an error message is displayed if an error occurs in the class. Similarly, if the logging level is set to WARN, an error message is displayed if a warning occurs in the class. OFF, FATAL, ERROR, WARN, INFO, DEBUG, and ALL are the different logging levels.
Each category is filtered by its place in the class hierarchy. For example, if you wanted to see logging for a specific class that is registered in the Admin portlet, you would browse to that specific class and change its log level to something that is more descriptive, such as DEBUG. Once you click the Save button at the bottom of the list, you will start seeing DEBUG messages from that class in your application server's log file.
If you are not sure which class you want to see log messages for, you can find a place higher up in the hierarchy and select the package name instead of an individual class name. If you do this, messages for every class lower in the hierarchy will be displayed in your application server's log file.
Be careful when you do this. If you set the log level to DEBUG somewhere near the top of the hierarchy (such as com.liferay, for example), you may wind up with a lot of messages in your log file. This could make it difficult to find the one you were looking for, and causes the server to do more work writing messages to its log file.
Figure 10–3 Changing the Logging Level

If you are working in the extension environment or have created a plugin and want to set the log level for one of your own classes, you can register that class (so long as it uses Log4J to do its logging) with the Admin portlet so that you can control the log levels more easily.
You will first need to implement Log4J logging in your class, with a statement such as the following (taken from Liferay's JCRHook class):
private static Log _log = LogFactory.getLog(JCRHook.class);
You would then use this _log variable to create log messages in your code for the various logging levels:
_log.error("Reindexing " + node.getName(), e1);
To enable your logging messages to appear in your server's log file via the Admin portlet, click the Add Category tab on the same Log Levels page.
Figure 10–4 Adding a Logging Category

You will see that you can add a logging category to the Admin portlet. Simply put in the fully qualified name of your class or of the package that contains the classes whose log messages you want to view, choose a log level, and then click the Save button. You will now start to see log messages from your own class or classes in the server's log file.
- © 2010, Oracle Corporation and/or its affiliates
