Logic Diagram and Directory Structure
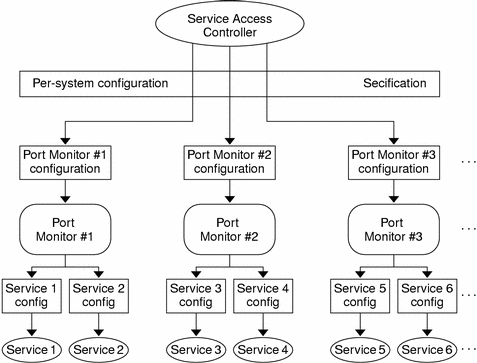
Figure F-1 is a logical diagram of the SAF. It illustrates how a single service access controller can spawn a number of port monitors on a per-system basis. This technique means that several monitors can run concurrently, providing for the simultaneous operation of several different protocols.
Figure F–1 SAF Logical Framework

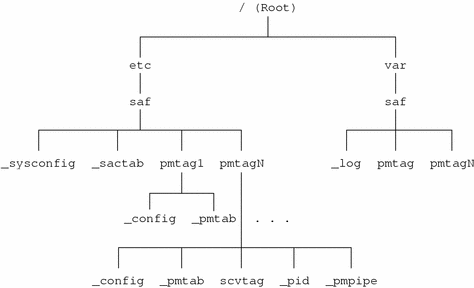
The following figure shows is the corresponding directory structure diagram. Following the diagram is a description of the files and directories.
Figure F–2 SAF Directory Structure

The scripts and files in the SAF directory structure are:
-
/etc/saf/_sysconfig The per-system configuration script.
-
/etc/saf/_sactab The SAC's administrative file. Contains information about the port monitors for which the SAC is responsible.
-
/etc/saf/pmtag The home directory for port monitor pmtag.
-
/etc/saf/pmtag/_config The per-port monitor configuration script for port monitor pmtag.
-
/etc/saf/pmtag/_pmtab Port monitor pmtag's administrative file. Contains information about the services for which pmtag is responsible.
-
/etc/saf/pmtag/svctag The file in which the per-service configuration script for service svctag, available through port monitor pmtag, is placed.
-
/etc/saf/pmtag/_pid The file in which a port monitor writes its process ID in the current directory and places an advisory lock on the file.
-
/etc/saf/pmtag/_pmpipe The file in which the port monitor receives messages from the SAC and ../_sacpipe and sends return messages to the SAC.
-
/var/saf/_log The SAC's log file.
-
/var/saf/pmtag The directory for files created by port monitor pmtag, for example its log file.
- © 2010, Oracle Corporation and/or its affiliates
