Performance Results
For most cases, scalability plots are shown. Performance is shown as a function of the number of CPUs enabled. The following metrics were used to characterize performance:
-
Operations per second (ops/sec) = successful transactions per second
-
Response time for single transaction (round-trip time) in milliseconds
While operations per second (ops/sec) data is shown for most cases, the response time and throughput are shown only where available.
Results are provided for the following tests, which are discussed in the remainder of this chapter:
Static Content Test
This test was performed with static download of a randomly selected file from a pool of 400 directories, each containing 100 files ranging in size from 5 KB to 250 KB. Tests were done with the file cache configured to include all files in the directories. The goal of static content tests was to identify the maximum number of conforming connections the server could handle. A conforming connection is one that operates faster than 320 Kbps (kilobits per second).
Simultaneous connections: 1500
Figure 7–1 Static Content Test
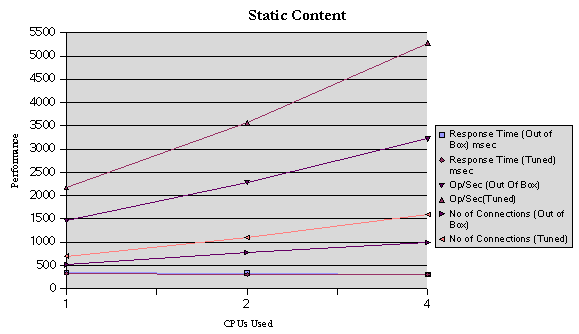 Table 7–3 Static Content Test
|
CPUs |
Response Time(Out of Box) msec |
Response Time(Tuned) msec |
Op/Sec(Out of Box) |
Op/Sec (Tuned) |
Number ofConnections (Out of Box) |
Number ofConnections (Tuned) |
|---|---|---|---|---|---|---|
|
1 |
346.69 |
320.5 |
1456.9 |
2169.3 |
510 |
700 |
|
2 |
337.01 |
305.3 |
2280.1 |
3565.1 |
775 |
1100 |
|
4 |
307.19 |
299.6 |
3220.8 |
5279.1 |
1000 |
1600 |
Dynamic Content Test: WASP Servlet
This test was conducted using the WASP servlet. It prints out the servlet's initialization arguments, environments, request headers, connection/client info, URL information, and remote user information. The goal was to saturate the CPUs on the server.
Number of clients: 3600
Figure 7–2 Dynamic Content Test: WASP Servlet
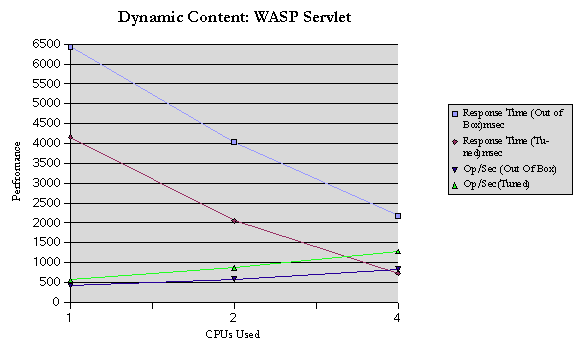 Table 7–4 Dynamic Content Test: WASP Servlet
|
CPUs |
Response Time(Out of Box) msec |
Response Time(Tuned) msec |
Op/Sec(Out of Box) |
Op/Sec (Tuned) |
|---|---|---|---|---|
|
1 |
6436.46 |
4159.93 |
414.6 |
571.87 |
|
2 |
4031.66 |
2052.63 |
518.8 |
870.25 |
|
4 |
2177.81 |
732.42 |
832.1 |
1280.43 |
Dynamic Content Test: C CGI
This test was performed by accessing a C executable called printenv.This executable outputs approximately 0.5 KB of data per request. The goal was to saturate the CPUs on the server.
Number of clients: 2400
Figure 7–3 Dynamic Content Test: C CGI
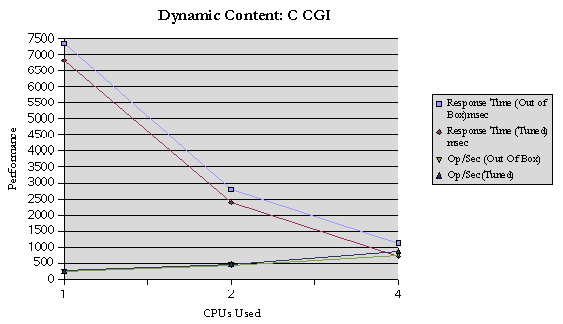 Table 7–5 Dynamic Content Test: C CGI
|
CPUs |
Response Time(Out of Box) msec |
Response Time(Tuned) msec |
Op/Sec(Out of Box) |
Op/Sec (Tuned) |
|---|---|---|---|---|
|
1 |
7350.41 |
6819.63 |
244.8 |
265.17 |
|
2 |
2801.64 |
2391.25 |
436.8 |
473.46 |
|
4 |
1127.31 |
719.36 |
750.59 |
873.6 |
Dynamic Content Test: Perl CGI
This test ran against a Perl script called printenv.pl that prints the CGI environment. This script outputs approximately 0.5 KB of data per request. The goal was to saturate the CPUs on the server.
Number of clients: 450
Figure 7–4 Dynamic Content Test: Perl CGI
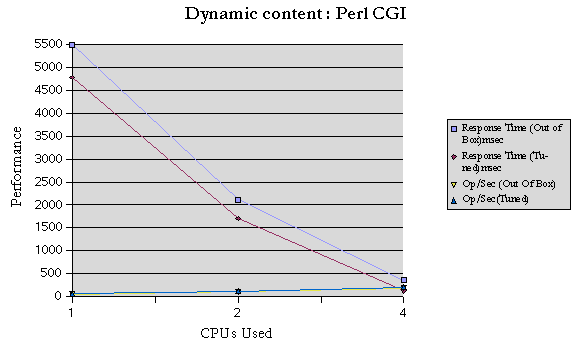 Table 7–6 Dynamic Content Test: Perl CGI
|
CPUs |
Response Time(Out of Box) msec |
Response Time(Tuned) msec |
Op/Sec(Out of Box) |
Op/Sec (Tuned) |
|---|---|---|---|---|
|
1 |
5484.17 |
4777.72 |
57.6 |
62.05 |
|
2 |
2111.22 |
1704.28 |
107.8 |
119.32 |
|
4 |
363.81 |
132.85 |
189.6 |
209.76 |
Dynamic Content Test: NSAPI
The NSAPI module used in this test was printenv2.so. It prints the NSAPI environment variables along with some text to make the entire response 2 KB. The goal was to saturate the CPUs on the server.
Number of clients: 6300
Figure 7–5 Dynamic Content Test: NSAPI
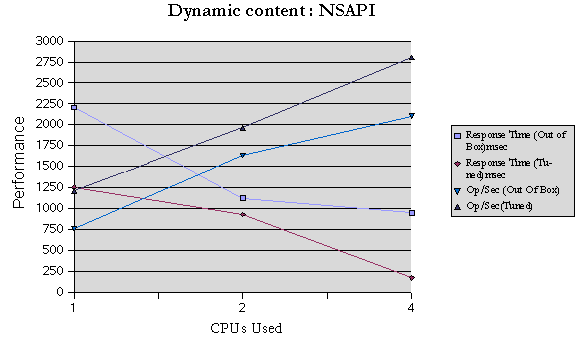 Table 7–7 Dynamic Content Test: NSAPI
|
CPUs |
Response Time(Out of Box) msec |
Response Time(Tuned) msec |
Op/Sec(Out of Box) |
Op/Sec (Tuned) |
|---|---|---|---|---|
|
1 |
2208.06 |
1259.16 |
758.9 |
1212.07 |
|
2 |
1123.85 |
931.13 |
1636.3 |
1965.68 |
|
4 |
952.67 |
177.9 |
2106.1 |
2804.05 |
SSL Performance Test: Static Content
A 1 KB static SSL file was used for this test. The goal was to saturate the CPUs on the server.
Simultaneous connections: 550
Figure 7–6 SSL Test: Static Content
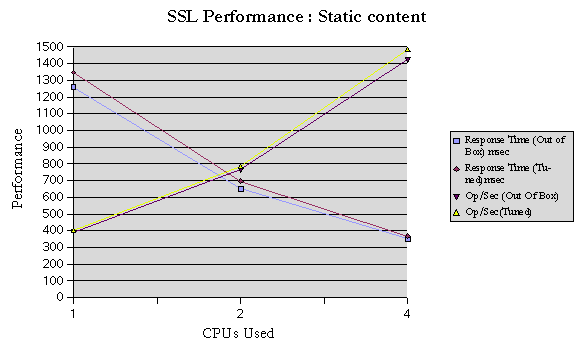 Table 7–8 SSL Test: Static Content
|
CPUs |
Response Time(Out of Box) msec |
Response Time(Tuned) msec |
Op/Sec(Out of Box) |
Op/Sec (Tuned) |
|---|---|---|---|---|
|
1 |
1259.11 |
1357.81 |
392.5 |
404.7 |
|
2 |
650.61 |
697.31 |
764.3 |
784.3 |
|
4 |
351.31 |
368.01 |
1422.6 |
1484.5 |
SSL Performance Test: Perl CGI
This test was performed by accessing the printenv C executable in SSL mode. The goal was to saturate the CPUs on the server. The test was performed in SSL mode with the SSL session cache both enabled and disabled.
Figure 7–7 SSL Performance Test: Perl CGI
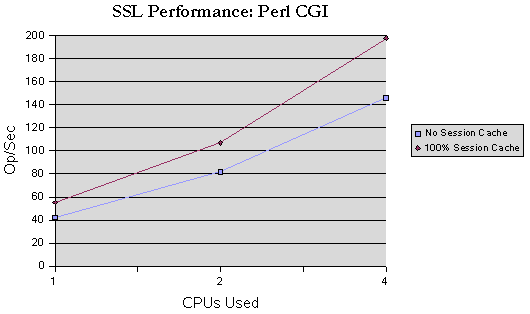 Table 7–9 SSL/Perl CGI: No Session Cache Reuse
|
# of CPUs |
Op/Sec (Out of Box) |
Op/Sec (Tuned) |
|---|---|---|
|
1 |
41.9 |
42.19 |
|
2 |
81.0 |
81.86 |
|
4 |
145.1 |
146.05 |
Table 7–10 SSL/Perl CGI: 100% Session Cache Reuse
|
# of CPUs |
Op/Sec (Out of Box) |
Op/Sec (Tuned) |
|---|---|---|
|
1 |
55.29 |
55.42 |
|
2 |
105.01 |
107.05 |
|
4 |
194.35 |
197.91 |
Table 7–11 SSL/Perl CGI: Session Cache Comparison
|
# of CPUs |
No Session Cache(Tuned) |
100% Session Cache(Tuned) |
|---|---|---|
|
1 |
42.19 |
55.42 |
|
2 |
81.86 |
107.05 |
|
4 |
146.05 |
197.91 |
SSL Performance Test: C CGI
This test was performed by accessing the printenv C executable in SSL mode. The goal was to saturate the CPUs on the server. The test was performed in SSL mode with the SSL session cache both enabled and disabled.
Figure 7–8 SSL Performance Test: C CGI
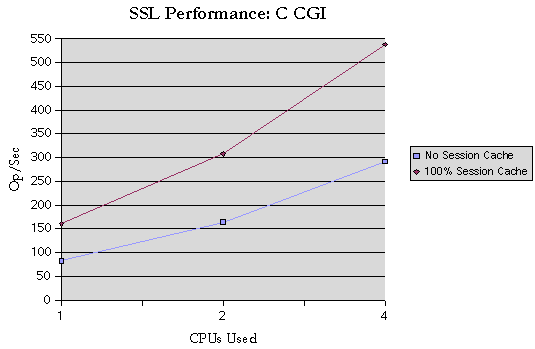 Table 7–12 SSL/C CGI: No Session Cache Reuse
|
CPUs |
Op/Sec (Out of Box) |
Op/Sec (Tuned) |
|---|---|---|
|
1 |
84.8 |
82.73 |
|
2 |
165.0 |
164.38 |
|
4 |
290.6 |
291.63 |
Table 7–13 SSL/C CGI: 100% Session Cache Reuse
|
CPUs |
Op/Sec (Out of Box) |
Op/Sec (Tuned) |
|---|---|---|
|
1 |
160.65 |
165.69 |
|
2 |
308.11 |
310.51 |
|
4 |
538.54 |
550.19 |
Table 7–14 SSL/C CGI: Session Cache Comparison
|
CPUs |
No Session Cache(Tuned) |
100% Session Cache(Tuned) |
|---|---|---|
|
1 |
82.73 |
160.65 |
|
2 |
164.38 |
308.11 |
|
4 |
291.63 |
538.54 |
SSL Performance Test: NSAPI
This test was performed by accessing the printenv C executable in SSL mode. The goal was to saturate the CPUs on the server. The test was performed in SSL mode with the SSL session cache both enabled and disabled.
Figure 7–9 SSL Performance Test: NSAPI
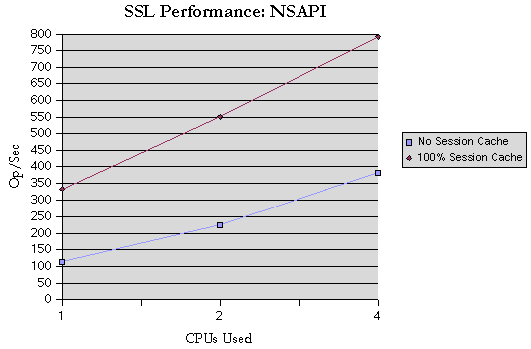 Table 7–15 SSL/NSAPI: No Session Cache Reuse
|
CPUs |
Op/Sec (Out of Box) |
Op/Sec (Tuned) |
|---|---|---|
|
1 |
114.08 |
114.44 |
|
2 |
223.58 |
225.04 |
|
4 |
380.88 |
382.78 |
Table 7–16 SSL/NSAPI: 100% Session Cache Reuse
|
CPUs |
Op/Sec (Out of Box) |
Op/Sec (Tuned) |
|---|---|---|
|
1 |
321.24 |
333.21 |
|
2 |
554.87 |
551.45 |
|
4 |
762.04 |
791.62 |
Table 7–17 SSL/NSAPI: Session Cache Comparison
|
CPUs |
No Session Cache(Tuned) |
100% Session Cache(Tuned) |
|---|---|---|
|
1 |
114.44 |
333.21 |
|
2 |
225.04 |
551.45 |
|
4 |
382.78 |
791.62 |
JDBC Connection Pooling with OCI Driver
This test tested the scalability and performance of the JDBC connection pooling module. In this test a simple servlet requests a row from a large database and prints its content. An Oracle database and the Oracle OCI driver were used for the test. JDBC connection pool resource configuration is shown below (server.xml).
<RESOURCES>
       <JDBCRESOURCE jndiname="jdbc/tpcwDB" poolname="TpcwPool"
enabled="true">
       <JDBCCONNECTIONPOOL name="TpcwPool"
datasourceclassname="oracle.jdbc.pool.OracleDataSource"
steadypoolsize="1000" maxpoolsize="1000" poolresizequantity="2"
idletimeout="0" maxwaittime="0"
connectionvalidationrequired="false"
connectionvalidationmethod="auto-commit"
validationtablename="string" failallconnections="false" >
    <PROPERTY name="URL"
value="jdbc:oracle:oci8:@(description=(address=(host=mach-3)
(protocol=tcp)(port=1521))(connect_data=(sid=10K)))">
 <PROPERTY name="user" value="tpcw">
 <PROPERTY name="password" value="tpcw">
              </JDBCCONNECTIONPOOL>
 </RESOURCES>
Number of clients: 3600
Figure 7–10 JDBC Connection Pool
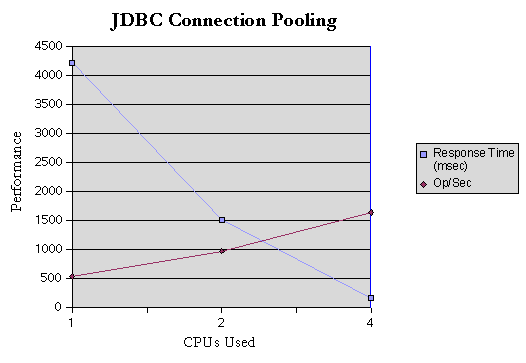 Table 7–18 JDBC Connection Pooling Test
|
CPUs |
Response Time (msec) |
Op/Sec |
|---|---|---|
|
1 |
4223.66 |
529.14 |
|
2 |
1508.53 |
966.74 |
|
4 |
153.19 |
1634.94 |
PHP Scalability Tests
PHP is a widely used scripting language uniquely suited to creating dynamic Web based content. It is the most rapidly expanding scripting language in use on the Internet due to its simplicity, accessibility, wide number of available modules, and large number of easily available applications.
The scalability of Sun Java System Web Server combined with the versatility of the PHP engine provides a highly performant and versatile web deployment platform for dynamic content.
The PHP (version 4.3.2) tests were performed in two modes:
-
Out-of-process "fastcgi-php" application invoked using the FastCGI plugin available for Sun Java System Web Server 6.1 (the download will be available from http://www.zend.com/sun/).
-
In-process PHP NSAPI plugin (available with PHP).
The test executes the phpinfo() query. Mostly out-of-the-box settings were used, plus PHP-related settings in the obj.conf and magnus.conf files, as shown after the test graphs and data.
FastCGI
Figure 7–11 PHP Scalability Tests: FastCGI
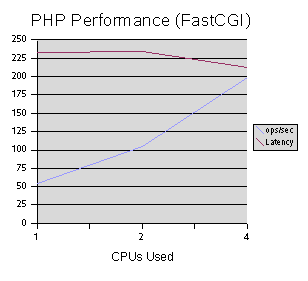 Table 7–19 PHP Scalability Test: FastCGI
|
CPUs |
Op/Sec |
Latency (msec) |
|---|---|---|
|
1 |
54 |
214 |
|
2 |
105 |
225 |
|
4 |
199 |
230 |
NSAPI
Figure 7–12 PHP Scalability Tests: NSAPI
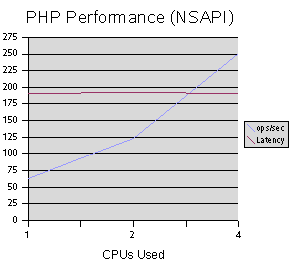 Table 7–20 PHP Scalability Test: NSAPI
|
CPUs |
Op/Sec |
Latency |
|---|---|---|
|
1 |
63 |
190 |
|
2 |
125 |
193 |
|
4 |
251 |
190 |
magnus.conf Settings
Init fn="load-modules"
shlib="/export0/ES61/install/bin/https/lib/libphp4.so"\
funcs="php4_init,php4_close,php4_execute,php4_auth_trans"
Init fn="php4_init"/
      errorString="PHP Totally Blowed Up!"

Init fn="load-modules"
shlib="/export0/ES61/install/bin/https/lib/libnsapi_fcgi.
so" funcs="FCGIRequestHandler,FCGIInit" shlib_flags="(global|now)"

Init fn="FCGIInit" errorString "Unable to start the FCGI NSAPI module"
obj.conf Settings
NameTrans fn="pfx2dir"
 from="/php-nsapi"dir="/export0/ES61/install/docs/php-nsapi" name="php-nsapi"
NameTrans fn="pfx2dir"
from="/php-fcgi"dir="/export0/ES61/install/docs/php-fcgi" name="fastcgi"

Service type="magnus-internal/fastcgi-php" fn="FCGIRequestHandler"
BindPath="localhost:8082" AppPath="/export0/php-fastcgi/bin/php"
StartServers="5" PHP_FCGI_CHILDREN="10" PHP_FCGI_MAX_REQUEST="2000"

<Object name="fastcgi">
ObjectType fn="force-type" type="magnus-internal/fastcgi-php"
Service type="magnus-internal/fastcgi-php"
         fn=FCGIRequestHandler
         BindPath="localhost:8082"
         AppPath="/export0/php-fastcgi/bin/php"
         StartServers="5"
         PHP_FCGI_CHILDREN="10"
         PHP_FCGI_MAX_REQUEST="2000"
</Object>

<Object name="php-nsapi">
# Set the MIME type
ObjectType fn="force-type" type="magnus-internal/x-httpd-php"
# Run the function
Service fn=php4_execute
</Object>
- © 2010, Oracle Corporation and/or its affiliates
