iPlanet Web Server 4.1 Performance
Tuning, Sizing, and Scaling

This guide is intended for advanced administrators only. Be cautious when you tune your server. Do not change any values except in exceptional circumstances. Read this guide and other relevant server documentation before making any changes. Always backup your configuration files first.

This guide includes the following sections:


About Server Performance
Web servers have become increasingly important for both internal and external business communications. As web servers become more and more business-critical, server performance takes on added significance. The iPlanet Web Server, Enterprise Edition continues to lead in this area, by setting a new standard for performance.

iPlanet Web Server was designed to meet the needs of the most demanding, high traffic sites in the world. It flexibly runs on both Unix and Windows NT and can serve both static and dynamically generated content. iPlanet Web Server can also run in SSL mode, enabling the secure transfer of information.

Because iPlanet Web Server is such a flexible tool for publishing, customer needs vary significantly. This document guides you through the process of defining your server workload and sizing a system to meet your performance needs. This document addresses miscellaneous configuration and Unix platform-specific issues. It also describes the perfdump performance utility and tuning parameters that are built into the server. The document concludes with sizing and scaling information and studies.

Performance Issues
The first step toward sizing your server is to determine your requirements. Performance means different things to users and to webmasters. Users want fast response times (typically less than 100 ms), high availability (no "connection refused" messages), and as much interface control as possible. Webmasters and system administrators, on the other hand, want to see high connection rates, high data throughput, and uptime approaching 100%. You need to define what performance means for your particular situation.

Here are some areas to consider:

Monitoring Performance
To help you monitor the performance of your server, use the following tools:

These tools are explained in more detail in the following sections of this document.


The perfdump Utility
The perfdump utility is a service function built into iPlanet Web Server. It collects various pieces of performance data from the web server internal statistics and displays them in ASCII text.

To install perfdump, you need to make the following modifications in obj.conf in the netscape/server4/https-server_name/config directory:

  1. Add the following object to your obj.conf file (after the default object):
  2. Edit the ppath= line if your document root is different than the example above. Make sure to put .perf after the path to the document root, as shown above.
  3. Restart your server software, and access perfdump by accessing this URL:
You can request the perfdump statistics and inform the browser to automatically refresh the statistics every n seconds by using this URL, which sets the refresh to every 5 seconds:

Sample Output
ns-httpd pid: 133

ListenSocket #0:

------------------

Address https:\\INADDR_ANY:80

ActiveThreads 48

WaitingThreads 47

BusyThreads 1

Thread limits 48/512

Total Sessions 48/712

KeepAliveInfo:

------------------

KeepAliveCount 0/200

KeepAliveHits 0

KeepAliveFlushes 0

KeepAliveTimeout 30 seconds

CacheInfo:

------------------

enabled yes

CacheEntries 2/8192

CacheSize(bytes) 0/0

Hit Ratio 474254/474264 (100.00)

pollInterval 7200

Native Thread Pool Data:

------------------------

Idle/Peak/Limit 1/1/100

Work queue length/Limit 0/2147483647

Peak work queue length 1

Work queue rejections 0

Server DNS cache disabled


Using perfdump Statistics to Tune Your Server
This section describes the information available through the perfdump utility and discusses how to tune some parameters to improve your server's performance. The default tuning parameters are appropriate for all sites except those with very high volume. The only parameter that large sites may regularly need to change is the RqThrottle parameter, which is tunable from the Server Manager.

The perfdump utility monitors these statistics:

ListenSocket Information
The ListenSocket is the listen-queue size which is a socket-level parameter that specifies the number of incoming connections the system will accept for that socket. The default setting is 128 (for Unix) or 100 (for Windows NT) incoming connections.

Make sure your system's listen-queue size is large enough to accommodate the ListenSocket size set in iPlanet Web Server. The ListenSocket size set from iPlanet Web Server changes the listen-queue size requested by your system. If iPlanet Web Server requests a ListenSocket size larger than your system's maximum listen-queue size, the size defaults to the system's maximum.

Warning. Setting ListenSocket too high can degrade server performance. ListenSocket was designed to prevent the server from becoming overloaded with connections it cannot handle. If your server is overloaded and you increase ListenSocket, the server will only fall further behind.

The first set of perfdump statistics is the ListenSocket information. For each hardware virtual server you have enabled in your server, there is one ListenSocket structure. For most sites, only one is listed.

ListenSocket #0:

------------------

Address https:\\INADDR_ANY:80

ActiveThreads 48

WaitingThreads 47

BusyThreads 1

Thread limits 48/512

Note. The "thread" fields specify the current thread use counts and limits for this listen socket. Keep in mind that the idea of a "thread" does not necessarily reflect the use of a thread known to the operating system. "Thread" in these fields really means an HTTP session. If you check the operating system to see how many threads are running in the process, it is not going to be the same as the numbers reported in these fields.

Tuning

There are two ways to create virtual servers: Using the virtual.conf file and using the obj.conf file. If you use the virtual.conf method, the 512 default maximum threads are available to all virtual servers on an as-needed basis. If you use the obj.conf method, the 512 threads are allocated equally to each of the defined virtual servers. For example, if you had two servers, each would have 256 threads available. This is less efficient. To maximize performance in this area, use the virtual.conf method. You can also configure the listen-queue size in the Performance Tuning page of the Server Manager.

Address
This field contains the base address that this listen socket is listening to. For most sites that are not using hardware virtual servers, the URL is:

http://INADDR_ANY:80"

The constant value "INADDR_ANY" is known internally to the server that specifies that this listen socket is listening on all IP addresses for this machine.

Tuning

This setting is not tunable except as described above.

ActiveThreads
The total number of "threads" (HTTP sessions) that are in any state for this listen socket. This is equal to WaitingThreads + BusyThreads. This setting is not tunable.

WaitingThreads
The number of "threads" (HTTP sessions) waiting for a new TCP connection for this listen socket.

Tuning

This is not directly tunable, but it is loosely equivalent to the RqThrottleMinPerSocket. See Thread limits <min/max>.

BusyThreads
The number of "threads" (HTTP sessions) actively processing requests which arrived on this listen socket.

This setting is not tunable.

Thread limits <min/max>
The minimum thread limit is a goal for how many threads the server attempts to keep in the WaitingThreads state. This number is just a goal. The number of actual threads in this state may go slightly above or below this value.

The maximum threads represents a hard limit for the maximum number of active threads that can run simultaneously, which can become a bottleneck for performance. iPlanet Web Server, Enterprise Edition 4.1 has default limits of 48/512. For more information, see About RqThrottle.

Tuning

See About RqThrottle.

KeepAlive Information
This section reports statistics about the server's HTTP-level KeepAlive system.

KeepAliveInfo:
------------------
KeepAliveCount 0/200
KeepAliveHits 0
KeepAliveFlushes 0
KeepAliveTimeout 30 seconds

Note. The name "KeepAlive" should not be confused with TCP "KeepAlives." Also, note that the name "KeepAlive" was changed to "Persistent Connections" in HTTP/1.1, but for clarity this document continues to refer to them as "KeepAlive" connections.

Both HTTP/1.0 and HTTP/1.1 support the ability to send multiple requests across a single HTTP session. A web server can receive hundreds of new HTTP requests per second. If every request was allowed to keep the connection open indefinitely, the server could become overloaded with connections. On Unix systems, this could lead to a file table overflow very easily.

To deal with this problem, the server maintains a "Maximum number of `waiting' keepalive connections" counter. A `waiting' keepalive connection is a connection that has fully completed processing of the previous request over the connection and is now waiting for a new request to arrive on the same connection. If the server has more than the maximum waiting connections open when a new connection starts to wait for a keepalive request, the server closes the oldest connection. This algorithm keeps an upper bound on the number of open, waiting keepalive connections that the server can maintain.

iPlanet Web Server does not always honor a KeepAlive request from a client. The following conditions cause the server to close a connection even if the client has requested a KeepAlive connection:

KeepAliveCount <KeepAliveCount/KeepAliveMaxCount>
The number of sessions currently waiting for a keepalive connection and the maximum number of sessions that the server allows to wait at one time.

Tuning

Edit the MaxKeepAliveConnections parameter in the magnus.conf file.

KeepAliveHits
The number of times a request was successfully received from a connection that had been kept alive.

This setting is not tunable.

KeepAliveFlushes
The number of times the server had to close a connection because the KeepAliveCount exceeded the KeepAliveMaxCount.

This setting is not tunable.

KeepAliveTimeout
Specifies the number of seconds the server will allow a client connection to remain open with no activity. A web client may keep a connection to the server open so that multiple requests to one server can be serviced by one network connection. Since a given server can handle a finite number of open connections (limited by active threads), a high number of open connections will prevent new clients from connecting. Setting the timeout to a lower value, however, may prevent the transfer of large files as timeout does not refer to the time that the connection has been idle. For example, if you are using a 2400 baud modem, and the request timeout is set to 180 seconds, then the maximum file size that can be transferred before the connection is closed is 432000 bits (2400 multiplied by 180).

When SSL is enabled, KeepAliveTimeout defaults to 0, which effectively disables persistent connections. If you want to use persistent connections with SSL, set KeepAliveTimeout to a non-zero value.

Tuning

You can change KeepAliveTimeout in the Performance Tuning page in the Server Manager.

Cache Information
This information applies to the accelerator cache, not the file cache. For an explanation of the caches, see File and Accelerator Caches.

CacheInfo:
------------------
enabled yes
CacheEntries 2/8192
CacheSize(bytes) 0/0
Hit Ratio 474254/474264 (100.00)
pollInterval 7200

This section describes the server's cache information. The contents of a file are cached to a specific static file on disk, with the keys being the file's URI. If multiple virtual servers are set up, the key also includes the virtual server's host ID and the port number.

enabled
If the cache is disabled, the rest of this section is not displayed.

Tuning

To disable the server accelerator cache, add the following line to the obj.conf file:

Init fn=cache-init disable=true

CacheEntries <CurrentCacheEntries / MaxCacheEntries>
The number of current cache entries and the maximum number of cache entries. A single cache entry represents a single URI.

Tuning

To set the maximum number of cached files in the cache, add the following line to the obj.conf file:

Init fn=cache-init MaxNumberOfCachedFiles=xxxxx

CacheSize <CurrentCacheSize / MaxCacheSize>
The CacheSize has been deprecated for this release, since the files are cached in the file cache, not the accelerator cache. For more information, see File and Accelerator Caches.

Hit Ratio <CacheHits / CacheLookups (Ratio)>
The hit ratio value tells you how efficient your site is. The hit ratio should be above 90%. If the number is 0, you need to optimize your site. See the troubleshooting section for more information on how to improve your site.

This setting is not tunable.

pollInterval
Since pollInterval is deprecated for this release, this field displays MaxAge from nsfc.conf. If you have not tuned MaxAge, it defaults to 30 seconds.

For tuning information on this setting, see MaxAge.

DNS Cache Information
Server DNS cache disabled

The DNS cache caches IP addresses and DNS names.

enabled
If the cache is disabled, the rest of this section is not displayed.

Tuning

By default, the DNS cache is off. Add the following line to obj.conf to enable the cache:

Init fn=dns-cache-init

CacheEntries <CurrentCacheEntries / MaxCacheEntries>
The number of current cache entries and the maximum number of cache entries. A single cache entry represents a single IP address or DNS name lookup.

Tuning

To set the maximum size of the DNS cache, add the following line to the obj.conf file:

Init fn=dns-cache-init cache-size=xxxxx

HitRatio <CacheHits / CacheLookups (Ratio)>
The hit ratio is displays the number of cache hits and the number of cache lookups. A good hit ratio for the DNS cache is ~60-70%.

This setting is not tunable.

Native Threads Pool
Native Thread Pool Data:
------------------------
Idle/Peak/Limit 1/1/100
Work queue length/Limit 0/2147483647
Peak work queue length 1
Work queue rejections 0

The native thread pool is used internally by the server to execute NSAPI functions that require a native thread for execution.

iPlanet Web Server uses NSPR, which is an underlying portability layer that provides access to the host OS services. This layer provides abstractions for threads that are not always the same as those for the OS-provided threads. These non-native threads have lower scheduling overhead so their use improves performance. However, these threads are sensitive to blocking calls to the OS, such as I/O calls. To make it easier to write NSAPI extensions that can make use of blocking calls, the server keeps a pool of threads that safely support blocking calls (usually this means it is a native OS thread). During request processing, any NSAPI function that is not marked as being safe for execution on a non-native thread is scheduled for execution on one of the threads in the native thread pool.

If you have written your own NSAPI plug-ins such as NameTrans, Service, or PathCheck functions, these execute by default on a thread from the native thread pool. If your plug-in makes use of the NSAPI functions for I/O exclusively or does not use the NSAPI I/O functions at all, then it can execute on a non-native thread. For this to happen, the function must be loaded with a "NativeThread=no" option indicating that it does not require a native thread. To do this, add this to the "load-modules" Init line in the obj.conf file:

Init funcs="pcheck_uri_clean_fixed_init" shlib="C:/Netscape/p186244/ P186244.dll" fn="load-modules" NativeThread="no"

The NativeThread flag affects all functions in the funcs list, so if you have more than one function in a library but only some of them use native threads, use separate Init lines.

Idle/Peak/Limit
Idle indicates the number of threads that are currently idle. Peak indicates the peak number in the pool. Limit indicates the maximum number of native threads allowed in the thread pool, and is determined by the setting of NativePoolMaxThreads. For more information, see Native Thread Pool Size.

Tuning

Modify the NativePoolMaxThreads directive in magnus.conf.

Work queue length/Limit
These numbers refer to a queue of server requests that are waiting for the use of a native thread from the pool. The Work Queue Length is the current number of requests waiting for a native thread. Limit is the maximum number of requests that can be queued at one time to wait for a native thread., and is determined by the setting of the NativePoolQueueSize directive in magnus.conf. For more information, see Native Thread Pool Size.

Tuning

Modify the NativePoolQueueSize directive in magnus.conf

Peak work queue length
This is the highest number of requests that were ever queued up simultaneously for the use of a native thread since the server was started. This value can be viewed as the maximum concurrency for requests requiring a native thread.

This setting is not tunable.

Work queue rejections
This is the cumulative number of requests that have needed the use of a native thread, but that have been rejected due to the work queue being full. By default, these requests are rejected with a "503 - Service Unavailable" response.

This setting is not tunable.

PostThreadsEarly
This advanced tuning parameter changes the thread allocation algorithm by causing the server to check for threads available for accept before executing a request. The default is set to Off. Recommended only in those situations when the load on the server is primarily comprised of lengthy transactions such as LiveWire and the Netscape Application Server or custom applications that access databases and other complex back-end systems. Turning this on allows the server to grow its thread pool more rapidly.

Tuning

Turn this parameter on by adding this directive to magnus.conf:

PostThreadsEarly 1

Native Thread Pool Size
In previous versions of the server, you controlled the native thread pool by setting system environment variables. In iPlanet Web Server, Enterprise Edition 4.1, you can use the directives in magnus.conf to control the size of the native kernel thread pool. We recommend using the magnus.conf directives; however, if you have set the system environment variables previously, they override the magnus.conf directives.

For more information on the magnus.conf directives, see NativePoolStackSize/NativePoolQueueSize/NativePoolMaxThreads/NativePoolMinThreads. For more information on the system environment variables, see Thread Pool Environmental Variables.

NativePoolStackSize/NativePoolQueueSize/NativePoolMaxThreads/NativePoolMinThreads

Use these directives to control the native thread pool.

NativePoolStackSize determines the stack size of each thread in the native (kernel) thread pool.

NativePoolQueueSize determines the number of threads that can wait in the queue for the thread pool. If all threads in the pool are busy, then the next request-handling thread that needs to use a thread in the native pool must wait in the queue. If the queue is full, the next request-handling thread that tries to get in the queue is rejected, with the result that it returns a busy response to the client. It is then free to handle another incoming request instead of being tied up waiting in the queue.

NativePoolMaxThreads determines the maximum number of threads in the native (kernel) thread pool.

NativePoolMinThreads determines the minimum number of threads in the native (kernel) thread pool.

Thread Pool Environmental Variables

NSCP_POOL_WORKQUEUEMAX. This value defaults to 0x7FFFFFFF (a very large number). Setting this below the RqThrottle value causes the server to execute a busy function instead of the intended NSAPI function whenever the number of requests waiting for service by pool threads exceeds this value. The default returns a "503 Service Unavailable" response and logs a message if LogVerbose is enabled. Setting this above RqThrottle causes the server to reject connections before a busy function can execute.

This value represents the maximum number of concurrent requests for service which require a native thread. If your system is unable to fulfill requests due to load, letting more requests queue up increases the latency for requests and could result in all available request threads waiting for a native thread. In general, set this value to be high enough to avoid rejecting requests under "normal" conditions, which would be the anticipated maximum number of concurrent users who would execute requests requiring a native thread.

The difference between this value and RqThrottle is the number of requests reserved for non-native thread requests (such as static HTML, gif, and jpeg files). Keeping a reserve (and rejecting requests) ensures that your server continues to fill requests for static files, which prevents it from becoming unresponsive during periods of very heavy dynamic content load. If your server consistently rejects connections, this value is set too low or your server hardware is overloaded.

NSCP_POOL_THREADMAX. This value represents the maximum number of threads in the pool. Set this value as low as possible to sustain the optimal volume of requests. A higher value allows more requests to execute concurrently, but has more overhead due to context switching, so "bigger is not always better." If you are not saturating your CPU but you are seeing requests queue up, then increase this number. Typically, you will not need to increase this number.

Busy Functions
The default busy function returns a "503 Service Unavailable" response and logs a message if LogVerbose is enabled. You may wish to modify this behavior for your application. You can specify your own busy functions for any NSAPI function in the obj.conf file by including a service function in the configuration file in this format:

For example, you could use this sample service function:

This allows different responses if the server become too busy in the course of processing a request that includes a number of types (such as Service, AddLog, and PathCheck). Note that your busy function will apply to all functions that require a native thread to execute when the default thread type is non-native.

To use your own busy function instead of the default busy function for the entire server, you can write an NSAPI init function that includes a func_insert call as shown below:

Busy functions are never executed on a pool thread, so you must be careful to avoid using function calls that could cause the thread to block.

Asynchronous DNS Lookup (Unix)
You can configure the server to use Domain Name System (DNS) lookups during normal operation. By default, DNS is not enabled; if you enable DNS, the server looks up the host name for a system's IP address. Although DNS lookups can be useful for server administrators when looking at logs, they can impact performance. When the server receives a request from a client, the client's IP address is included in the request. If DNS is enabled, the server must look up the hostname for the IP address for every client making a request.

DNS causes multiple threads to be serialized when you use DNS services. If you do not want serialization, enable asynchronous DNS. You can enable it only if you have also enabled DNS. Enabling asynchronous DNS can improve your system's performance if you are using DNS.

Note. If you turn off DNS lookups on your server, host name restrictions will not work, and hostnames will not appear in your log files. Instead, you'll see IP addresses.

You can also specify whether to cache the DNS entries. If you enable the DNS cache, the server can store hostname information after receiving it. If the server needs information about the client in the future, the information is cached and available without further querying. You can specify the size of the DNS cache and an expiration time for DNS cache entries. The DNS cache can contain 32 to 32768 entries; the default value is 1024 entries. Values for the time it takes for a cache entry to expire can range from 1 second to 1 year (specified in seconds); the default value is 1200 seconds (20 minutes).

It is recommended that you do not use DNS lookups in server processes because they are so resource intensive. If you must include DNS lookups, be sure to make them asynchronous. For more information on asynchronous DNS, see the Performance Tuning page in the online help.

enabled
If asynchronous DNS is disabled, the rest of this section will not be displayed.

Tuning

Add "AsyncDNS on" to magnus.conf.

NameLookups
The number of name lookups (DNS name to IP address) that have been done since the server was started.

This setting is not tunable.

AddrLookups
The number of address loops (IP address to DNS name) that have been done since the server was started.

This setting is not tunable.

LookupsInProgress
The current number of lookups in progress.

This setting is not tunable.


Performance Buckets
Performance buckets allow you to define buckets, and link them to various server functions. Every time one of these functions is invoked, the server collects statistical data and adds it to the bucket. For example, send-cgi and NSServletService are functions used to serve the CGI and Java servlet requests respectively. You can either define two buckets to maintain separate counters for CGI and servlet requests, or create one bucket that counts requests for both types of dynamic content. The cost of collecting this information is little and impact on the server performance is negligible. This information can later be accessed using The perfdump Utility. The following information is stored in a bucket:

The following buckets are pre-defined by the server:

Configuration
Specify all the configuration information for performance buckets in the obj.conf file. By default the feature is disabled. To enable performance measurement add the following line in obj.conf:

The following examples show how to define new buckets.

Init fn="define-perf-bucket" name="acl-bucket" description="ACL bucket"
Init fn="define-perf-bucket" name="file-bucket" description="Non-cached responses"
Init fn="define-perf-bucket" name="cgi-bucket" description="CGI Stats"

The prior example creates three buckets: acl-bucket, file-bucket, and cgi-bucket. To associate these buckets with functions, add bucket=bucket-name in front of the obj.conf function for which you wish to measure performance.

PathCheck fn="check-acl" acl="default" bucket="acl-bucket"
Service method="(GET|HEAD|POST)" type="*~magnus-internal/*" fn="send- file" bucket="file-bucket"
<Object name="cgi">
ObjectType fn="force-type" type="magnus-internal/cgi"
Service fn="send-cgi" bucket="cgi-bucket"
</Object>

Performance Report
The server statistics in buckets can be accessed using The perfdump Utility. The performance buckets information is located in the last section of the report that perfdump returns. To enable reports on performance buckets, complete the following steps:

  1. Define an extension for the performance bucket report. Add the following line to the mime.types file:
  2. Associate the type you declared in mime.types with the service-dump function in the obj.conf file:
  3. Use the URL http://server_name:port_number/.perf to view the performance report.
Note. You must include a period (.) before the extension you defined in the mime.types file (in this case, .perf).

The report contains the following information:

The following is an example of the performance bucket information available through perfdump:

Performance Counters:

------------------------------------------------

Server start time: Mon Oct 11 15:37:26 1999

Average Total Percent

Total number of requests: 474851

Request processing time: 0.0010 485.3198

Cache Bucket (cache-bucket)

Number of Requests: 474254 ( 99.87%)

Number of Invocations: 474254 ( 98.03%)

Latency: 0.0001 48.7520 ( 10.05%)

Function Processing Time: 0.0003 142.7596 ( 29.42%)

Total Response Time: 0.0004 191.5116 ( 39.46%)

Default Bucket (default-bucket)

Number of Requests: 597 ( 0.13%)

Number of Invocations: 9554 ( 1.97%)

Latency: 0.0000 0.1526 ( 0.03%)

Function Processing Time: 0.0256 245.0459 ( 50.49%)

Total Response Time: 0.0257 245.1985 ( 50.52%)


File and Accelerator Caches
In iPlanet Web Server, Enterprise Edition 4.1 there are two caches: a front-end accelerator cache that caches response headers and contains pointers to the static file cache, and a static file cache which holds static file information as well as content. The cache-init directive initializes the accelerator cache. The file cache is turned on by default. If you want to change the default cache setup, you need to create a file called nfsc.conf. For more information, see Configuring the File Cache.

The file cache is implemented using a new file cache module, NSFC, which caches static HTML, image and sound files. In previous versions of the server, the file cache was integrated with the accelerator cache for static pages. Therefore, an HTTP request was serviced by the accelerator, or passed to the NSAPI engine for full processing, and requests that could not be accelerated did not have the benefit of file caching. This prevented many sites with NSAPI plug-ins, customized logs, or used server-parsed HTML from taking advantage of the accelerator.

The NSFC module implements an independent file cache used in the NSAPI engine to cache static files that could not be accelerated. It is also used by the accelerator cache, replacing its previously integrated file cache. NSFC caches information that is used to speed up processing of server-parsed HTML.

Configuring the Accelerator Cache
The cache-init function controls the accelerator caching. To optimize server speed, you should have enough RAM for the server and cache because swapping can be slow. Do not allocate a cache that is greater in size than the amount of memory on the system.


Table 1.1 The cache-init parameters
disable
(optional) Specifies whether the file cache is disabled or not. If set to anything but "false" the cache is disabled. By default, the cache is enabled.
MaxNumberOfCachedFiles
(optional) Maximum number of entries in the accelerator cache. The default is 4096, minimum is 32, maximum is 32768.
MaxNumberOfOpenCachedFiles
(optional) Maximum number of accel_file_cache entries with file_cache entries.
Default is 512, minimum is 32, maximum is 32768.
CacheHashSize
(optional) size of hash table for the accelerator cache. Default is 8192, minimum is 32, maximum is 32768.
NoOverflow
(optional) IRIX only.
IsGlobal
(optional) IRIX only.

Example
Init fn="cache-init" MaxNumberOfCachedFiles=15000 MaxNumberOfOpenCachedFiles=15000 CacheHashSize=15101

Configuring the File Cache
By default, the file cache is turned on and uses the default values for all parameters described below. If you would like to change parameter values, you need to create a text file called nsfc.conf in the server_root/https-server-id/config directory. To change a parameter value for improved performance, type the parameter and its new value in the nsfc.conf file.

CopyFiles
When CopyFiles is set to "true," the file is copied to a temporary file which the server displays when users access the file. Defaults to "false" on Unix and "true" on Windows NT. The temporary file is stored in the directory specified in TempDir.

CopyFiles=true

FileCacheEnable
Specifies whether the file cache is enabled or not.

By default, this is set to true.

FileCacheEnable=true

HashInitSize
The size of the file cache hash table. The default size is 2 * MaxFiles +1. For example, if your MaxFiles is set to 1024, the default HashInitSize is 2049.

HashInitSize=9131

HitOrder
If the MaxFiles limit has been reached when the server creates a new file cache entry, the server marks an existing entry for deletion. If HitOrder is set to "true" the file entry marked for deletion is the one that has received the fewest hits. If HitOrder is set to "false" the file entry marked for deletion is the one that has gone the longest without a hit.

HitOrder=true

MaxAge
The maximum age (in seconds) of a valid cache entry. This setting controls how long cached information will continue to be used once a file has been cached. An entry older than MaxAge is replaced by a new entry for the same file if the same file is referenced through the cache.

Set MaxAge based on whether the content is updated (existing files are modified) on a regular schedule or not. For example, if content is updated four times a day at regular intervals, MaxAge could be set to 21600 seconds (6 hours). Otherwise, consider setting MaxAge to the longest time you are willing to serve the previous version of a content file, after the file has been modified.

By default, this is set to 30.

MaxAge=30

MaxFiles
The maximum number of files that may be in the cache at once.

By default, this is set to 1024.

MaxFiles=1024

MediumFileSizeLimit (Unix)
The size (in bytes) of the largest file that is considered to be "medium" in size. The contents of medium files are cached by mapping the file into virtual memory (currently only on Unix platforms). The contents of "large" files (larger than "medium") are not cached, although information about large files is cached.

By default, this is set to 525000 (525 KB).

MediumFileSizeLimit=525000

MediumFileSpace
The size (in bytes) of the virtual memory used to map all medium sized files.

By default, this is set to 10000000 (10MB).

MediumFileSpace=10000000

SmallFileSizeLimit (Unix)
The size (in bytes) of the largest file considered to be "small" in size. The contents of small files are cached by allocating heap space and reading the file into it.

The idea of distinguishing between small files and medium files is to avoid wasting part of many pages of virtual memory when there are lots of small files. So the SmallFileSizeLimit would typically be a slightly lower value than the VM page size.

By default, this is set to 2048.

SmallFileSizeLimit=2048

SmallFileSpace
The size of heap space (in bytes) used for the cache, including heap space used to cache small files.

By default, this is set to 1MB for Unix, 0 for Windows NT.

SmallFileSpace=1000000

TempDir
TempDir sets the directory name where the temporary files are copied if CopyFiles is set to "true." Defaults to system_temp_dir/netscape/server_instance.

If you assign a temporary directory, the server creates a structure within that directory for the temporary files. For example, on Windows NT if you set the temporary directory to C:/mytemp, the temporary files are created in the file C:/mytemp/c/server_doc_root. The c directory comes from the drive letter.

TempDir=C:/temp

TransmitFile
When TransmitFile is set to "true," open file descriptors are cached for files in the file cache, rather than the file contents, and PR_TransmitFile is used to send the file contents to a client. When set to "true," the distinction normally made by the file cache between small, medium, and large files no longer applies, since only the open file descriptor is being cached. By default, TransmitFile is "false" on Unix and "true" on Windows NT.

This directive is intended to be used on Unix platforms that have native OS support for PR_TransmitFile, which currently includes HPUX and AIX. It is not recommended for other Unix platforms.

TransmitFile=true

File Cache Dynamic Control and Monitoring
An object can be added to obj.conf to enable the NSFC file cache to be dynamically monitored and controlled while the server is running. Typically this would be done by first adding a NameTrans directive to the "default" object:

Then add a new object definition:

This enables the file cache control and monitoring function (nsfc-dump) to be accessed via the URI, "/nsfc." By changing the "from" parameter in the NameTrans directive, a different URI can be used.

The following is an example of the information you receive when you access the URI:

Netscape Enterprise Server File Cache Status (pid 7960)

The file cache is enabled.

Cache resource utilization

Number of cached file entries = 1039 (112 bytes each, 116368 total bytes)

Heap space used for cache = 237641/1204228 bytes

Mapped memory used for medium file contents = 5742797/10485760 bytes

Number of cache lookup hits = 435877/720427 ( 60.50 %)

Number of hits/misses on cached file info = 212125/128556

Number of hits/misses on cached file content = 19426/502284

Number of outdated cache entries deleted = 0

Number of cache entry replacements = 127405

Total number of cache entries deleted = 127407

Number of busy deleted cache entries = 17

Parameter settings

HitOrder: false

CacheFileInfo: true

CacheFileContent: true

TransmitFile: false

MaxAge: 30 seconds

MaxFiles: 1024 files

SmallFileSizeLimit: 2048 bytes

MediumFileSizeLimit: 537600 bytes

CopyFiles: false

Directory for temporary files: /tmp/netscape/https-axilla.mcom.com

Hash table size: 2049 buckets

You can include a query string = when you access the "/nsfc" URI. The following values are recognized:

If you choose the ?list option, the file listing includes the file name, a set of flags, the current number of references to the cache entry, the size of the file, and an internal file ID value. The flags are as follows:

For sites with scheduled updates to content, consider shutting down the cache while the content is being updated, and starting it again after the update is complete. Although performance will slow down, the server operates normally when the cache is off.


Unix Platform-Specific Issues
The various Unix platforms all have limits on the number of files that can be open in a single process at one time. For busy sites, increase that number to 1024.

These Unix platforms have proprietary sites for additional information about tuning their systems for web servers:

Tuning Solaris for Performance Benchmarking
The following table shows the operating system tuning for Solaris used when benchmarking. These values are an example of how you might tune your system to achieve the desired result.

Table 1.2 Tuning Solaris for performance benchmarking
Parameter
Scope
Default Value
Tuned Value
Comments
rlim_fd_max
/etc/system
1024
8192
Process open file descriptors limit; should account for the expected load (for the associated sockets, files, pipes if any).
rlim_fd_cur
/etc/system
64
8192

sq_max_size
/etc/system
2
0
Controls streams driver queue size; setting to 0 makes it infinity so the performance runs wont be hit by lack of buffer space. Set on clients too.
tcp_close_wait_interval
ndd/dev/tcp
240000
60000
Set on clients too.
tcp_time_wait_interval
ndd/dev/tcp
240000
60000
For Solaris 7 only. Set on clients too.
tcp_conn_req_max_q
ndd/dev/tcp
128
1024

tcp_conn_req_max_q0
ndd/dev/tcp
1024
4096

tcp_ip_abort_interval
ndd/dev/tcp
480000
60000

tcp_keepalive_interval
ndd/dev/tcp
7200000
900000
For high traffic web sites lower this value.
tcp_rexmit_interval_initial
ndd/dev/tcp
3000
3000
If retransmission is greater than 30-40%, you should increase this value.
tcp_rexmit_interval_max
ndd/dev/tcp
240000
10000

tcp_rexmit_interval_min
ndd/dev/tcp
200
3000

tcp_smallest_anon_port
ndd/dev/tcp
32768
1024
Set on clients too.
tcp_slow_start_initial
ndd/dev/tcp
1
2
Slightly faster transmission of small amounts of data.
tcp_xmit_hiwat
ndd/dev/tcp
8129
32768
To increase the transmit buffer.
tcp_recv_hiwat
ndd/dev/tcp
8129
32768
To increase the receive buffer.
.

Tuning HP-UX for Performance Benchmarking
The following table shows the operating system tuning for HP-UX used when benchmarking. These values are an example of how you might tune your system to achieve the desired result.

Table 1.3 Tuning HP-UX for performance benchmarking
Parameter
Scope
Default Value
Tuned Value
Comments
maxfiles
/stand/system
2048
4096
Must edit file by hand to increase beyond 2048 limit allowed by sam
maxfiles_lim
/stand/system
2048
4096
Must edit file by hand to increase beyond 2048 limit allowed by sam
tcp_time_wait_interval
ndd/dev/tcp
60000
60000

tcp_conn_req_max
ndd/dev/tcp
20
1024

tcp_ip_abort_interval
ndd/dev/tcp
600000
60000

tcp_keepalive_interval
ndd/dev/tcp
72000000
900000

tcp_rexmit_interval_initial
ndd/dev/tcp
1500
1500

tcp_rexmit_interval_max
ndd/dev/tcp
60000
60000

tcp_rexmit_interval_min
ndd/dev/tcp
500
500

tcp_xmit_hiwater_def
ndd/dev/tcp
32768
32768

tcp_recv_hiwater_def
ndd/dev/tcp
32768
32768


Miscellaneous magnus.conf Directives
You can use the following magnus.conf directives to configure your server to function more effectively:

Multi-process Mode
You can configure the server to handle requests using multiple processes and multiple threads in each process. This flexibility provides optimal performance for sites using threads and also provides backward compatibility to sites running legacy applications that are not ready to run in a threaded environment. Because applications on Windows NT generally already take advantage of multi-process considerations, this feature mostly applies to Unix platforms.

The advantage of multiple processes is that legacy applications which are not thread-aware or thread safe can be run more effectively in iPlanet Web Server. However, because all the Netscape extensions are built to support a single-process, threaded environment, they cannot run in the multi-process mode. WAI, LiveWire, Java, Server-side JavaScript, LiveConnect and the Web Publishing and Search plug-ins fail on startup if the server is in multi-process mode.

There are two approaches to multi-thread design:

In the single-process design, the server receives requests from web clients to a single process. Inside the single server process, many threads are running which are waiting for new requests to arrive. When a request arrives, it is handled by the thread receiving the request. Because the server is multi-threaded, all extensions written to the server (NSAPI) must be thread-safe. This means that if the NSAPI extension uses a global resource (like a shared reference to a file or global variable) then the use of that resource must be synchronized so that only one thread accesses it at a time. All plug-ins provided by Netscape are thread-safe and thread-aware, providing good scalability and concurrency. However, your legacy applications may be single-threaded. When the server runs the application, it can only execute one at a time. This leads to severe performance problems when put under load. Unfortunately, in the single-process design, there is no real workaround.

In the multi-process design, the server spawns multiple server processes at startup. Each process contains one or more threads (depending on the configuration) which receive incoming requests. Since each process is completely independent, each one has its own copies of global variables, shared libraries, caches, and other resources. Using multiple processes requires more resources from your system. Also, if you try to install an application which requires shared state, it has to synchronize that state across multiple processes. NSAPI provides no helper functions for implementing cross-process synchronization.

If you are not running any NSAPI in your server, you should use the default settings: one process and many threads. If you are running an application which is not scalable in a threaded environment, you should use a few processes and many threads, for example, 4 or 8 processes and 256 or 512 threads per process.

MaxProcs (Unix)

Use this directive to set your Unix server in multi-process mode, which allows for higher scalability on multi-processor machines. If, for example, you are running on a four-processor CPU, setting MaxProcs to 4 improves performance: one process per processor.

If you are running iPlanet Web Server in multi-process mode, you cannot run LiveWire, Web Publisher, and WAI.

This directive results in one primordial process and four active processes:

Note. This value is not tunable from the Server Manager. You must use magnus.conf.

Accept Thread Information
MinAcceptThreadsPerSocket / MaxAcceptThreadsPerSocket

Use this directive to specify how many threads you want in accept mode on a listen socket at any time. It's a good practice to set this to equal the number of processes. You can set this to twice (2x) the number of processes, but setting it to a number that is too great (such as ten (10x) or fifty (50x)) allows too many threads to be created and slows the server down.

CGIStub Processes (Unix)
You can adjust the CGIStub parameters on Unix systems. In the iPlanet Web Server, the CGI engine creates CGIStub processes as needed to handle CGI processes. On systems that serve a large load and rely heavily on CGI-generated content, it is possible for the CGIStub processes spawned to consume all system resources. If this is happening on your server, the CGIStub processes can be tuned to restrict how many new CGIStub processes can be spawned, their timeout value, and the minimum number of CGIStub processes that will be running at any given moment.

Note. If you have an init-cgi function in the obj.conf file and you are running in multi-process mode, you must add LateInit = yes to the init-cgi line.

MinCGIStubs/MaxCGIStubs/CGIStubIdleTimeout

The three directives (and their defaults) that can be placed in the magnus.conf file to control Cgistub are:

MinCGIStubs 2
MaxCGIStubs 10
CGIStubIdleTimeout 45

MinCGIStubs controls the number of processes that are started by default. The first CGIStub process is not started until a CGI program has been accessed. The default value is 2. Note that if you have a init-cgi directive in the obj.conf file, the minimum number of CGIStub processes are spawned at startup.

MaxCGIStubs controls the maximum number of CGIStub processes the server can spawn. This is the maximum concurrent CGIStub processes in execution, not the maximum number of pending requests. The default value shown should be adequate for most systems. Setting this too high may actually reduce throughput. The default value is 10.

CGIStubIdleTimeout causes the server to kill any CGIStub processes that have been idle for the number of seconds set by this directive. Once the number of processes is at MinCGIStubs it does not kill any more processes.

Buffer Size
SndBufSize/RcvBufSize

You can specify the size of the send buffer (SndBufSize) and the receiving buffer (RcvBufSize) at the server's sockets. For more information regarding these buffers, see your Unix documentation.

About RqThrottle
The RqThrottle parameter in the magnus.conf file specifies the maximum number of simultaneous transactions the web server can handle. The default value is 512. Changes to this value can be used to throttle the server, minimizing latencies for the transactions that are performed. The RqThrottle value acts across multiple virtual servers, but does not attempt to load-balance.

To compute the number of simultaneous requests, the server counts the number of active requests, adding one to the number when a new request arrives, subtracting one when it finishes the request. When a new request arrives, the server checks to see if it is already processing the maximum number of requests. If it has reached the limit, it defers processing new requests until the number of active requests drops below the maximum amount.

In theory, you could set the maximum simultaneous requests to 1 and still have a functional server. Setting this value to 1 would mean that the server could only handle one request at a time, but since HTTP requests generally have a very short duration (response time can be as low as 5 milliseconds), processing one request at a time would still allow you to process up to 200 requests per second.

However, in actuality, Internet clients frequently connect to the server and then do not complete their requests. In these cases, the server waits 30 seconds or more for the data before timing out. (You can define this timeout period using the AcceptTimeout directive in magnus.conf. It has a default of 30 seconds.) Also, some sites do heavyweight transactions that take minutes to complete. Both of these factors add to the maximum simultaneous requests that are required. If your site is processing many requests that take many seconds, you may need to increase the number of maximum simultaneous requests.

The defaults are 48/512. If your site is experiencing slowness and the ActiveThreads count remains close to the limit, consider increasing the maximum threads limit. To find out the active thread count, use The perfdump Utility.

A suitable RqThrottle value ranges from 200-2000 depending on the load. If you want your server to use all the available resources on the system (that is, you don't run other server software on the same machine), then you can increase RqThrottle to a larger value than necessary without negative consequences.

Note. If you are using older NSAPI plug-ins that are not reentrant, they will not work with the multithreading model described in this document. To continue using them, you should revise them so that they are reentrant. If this is not possible, you can configure your server to work with them by setting RqThrottle to 1 and then using a high value for MaxProcs, such as 48 or greater, but this will adversely impact your server's performance.

Tuning

There are two ways to tune the thread limit: through editing the magnus.conf file and through the Server Manager.

If you edit the magnus.conf file, RqThrottleMinPerSocket is the minimum value and RqThrottle is the maximum value.

The minimum limit is a goal for how many threads the server attempts to keep in the WaitingThreads state. This number is just a goal. The number of actual threads in this state may go slightly above or below this value. The default value is 48. The maximum threads represents a hard limit for the maximum number of active threads that can run simultaneously, which can become a bottleneck for performance. The default value is 512.

If you use the Server Manager, follow these steps:

  1. Go to the Preferences tab.
  2. Click the Performance Tuning link.
  3. Enter the desired value in the Maximum simultaneous requests field.
For additional information, see the online help for the Performance Tuning page.


Tuning the ACL Cache
Because of the default size of the cache (200 entries), the ACL cache can be a bottleneck or can simply not serve its purpose on a heavily trafficked site. On a heavily trafficked site well more than 200 users can hit ACL-protected resources in less time than the lifetime of the cache entries. When this situation occurs, the iPlanet Web Server has to query the LDAP server more often to validate users, which impacts performance.

This bottleneck can be avoided by increasing the size of the ACL cache with the ACLUserCacheSize directive in magnus.conf. Note that increasing the cache size will use more resources; the larger you make the cache the more RAM you'll need to hold it.

There can also be a potential (but much harder to hit) bottleneck with the number of groups stored in a cache entry (by default four). If a user belongs to five groups and hits five ACLs that check for these different groups within the ACL cache lifetime, an additional cache entry is created to hold the additional group entry. When there are two cache entries, the entry with the original group information is ignored.

While it would be extremely unusual to hit this possible performance problem, the number of groups cached in a single ACL cache entry can be tuned with the ACLGroupCacheSize directive.

Using magnus.conf Directives
In order to adjust the cache values you will need to manually add these directives to your magnus.conf file.

ACLCacheLifetime
Set this directive to a number that determines the number of seconds before the cache entries expire. Each time an entry in the cache is referenced, its age is calculated and checked against ACLCacheLifetime. The entry is not used if its age is greater than or equal to the ACLCacheLifetime. The default value is 120 seconds. If this value is set to 0, the cache is turned off. If you use a large number for this value, you may need to restart the iPlanet Web Server when you make changes to the LDAP entries. For example, if this value is set to 120 seconds, the iPlanet Web Server might be out of sync with the LDAP server for as long as two minutes. If your LDAP is not likely to change often, use a large number.

ACLUserCacheSize
Set this directive to a number that determines the size of the User Cache (default is 200).

ACLGroupCacheSize
Set this directive to a number that determines how many group IDs can be cached for a single UID/cache entry (default is 4).

Setting LogVerbose
If you set LogVerbose to on, you can verify that the ACL cache settings are being used. When LogVerbose is running you should expect to see these messages in your errors log when the server starts:

User authentication cache entries expire in ### seconds.

User authentication cache holds ### users.

Up to ### groups are cached for each cached user.


Improving Servlet Performance
The use of NSAPI cache will improve servlet performance in cases where the obj.conf configuration file has many directives. To enable NSAPI cache include the following line in obj.conf:

It's advisable to have the servlet engine NameTrans (NameTrans fn="NSServletNameTrans" name="servlet") to be the first in the list.

This directive uses highly-optimized URI cache for loaded servlets and will return REQ_PROCEED if the match is found, thus eliminating the need of other NameTrans directives to be executed.

jvm.conf/jvm12.conf has a configuration parameter, called jvm.stickyAttach. Setting the value of this parameter to 1 will cause threads to remember that they are attached to the JVM, thus speeding up request processing by eliminating AttachCurrentThread and DetachCurrentThread calls. It can however have a side-effect as recycled threads which may be doing other processing can be suspended by the garbage collector arbitrarily. Thread pools can be used to eliminate this side effect for other subsystems.

Thread Pools
You can specify a number of configurable native thread pools, by adding the following directives to the obj.conf:

Pool must be declared before it's used. To use the pool add pool=name_of_the_pool parameter to load-modules directive of the appropriate subsystem. The older parameter NativeThread=yes will always engage one default native pool, called NativePool.

In addition to configuring the native pool parameters on Windows NT using the environmental variables beginning with "NSCP_POOL," the following parameters can be added to magnus.conf for convenience:

Any of the parameters can be omitted to reflect the default behavior.

Native pool on Unix is normally not engaged, as all threads are OS-level threads. Using native pools on Unix may introduce a small performance overhead as they'll require an additional context switch; however they can be used to localize jvm.stickyAttach effect or for other purposes, such as resource control/management or to emulate single-threaded behavior of plug-ins (by setting maxThreads=1).

On Windows NT, at least the default native pool is always being used and iPlanet Web Server uses fibers (user-scheduled threads) for initial request processing. Using custom/additional pools on Windows NT will introduce no additional overhead.


Common Performance Problems
This section discusses a few common performance problems to check for on your web site:

Low-Memory Situations
If you need iPlanet Web Server to run in low-memory situations, try reducing the thread limit to a bare minimum by lowering the value of RqThrottle in your magnus.conf file. Also you may want to reduce the maximum number of processes that the iPlanet Web Server will spawn by lowering the value of the MaxProcs value in the magnus.conf file.

Under-Throttled Server
The server does not allow the number of active threads to exceed the Thread Limit value. If the number of simultaneous requests reaches that limit, the server stops servicing new connections until the old connections are freed up. This can lead to increased response time.

In iPlanet Web Server, the server's default RqThrottle value is 512. If you want your server to accept more connections, you need to increase the RqThrottle value.

Checking
The symptom of an under-throttled server is a server with a long response time. Making a request from a browser establishes a connection fairly quickly to the server, but on under-throttled servers it may take a long time before the response comes back to the client.

The best way to tell if your server is being throttled is to look at the WaitingThreads count. If this number is getting close to 0 or is 0, then the server is not accepting new connections right now. Also check to see if the number of ActiveThreads and BusyThreads are close to their limits. If so, the server is probably limiting itself.

Tuning
See About RqThrottle.

Cache Not Utilized
If the cache is not utilized, your server is not performing optimally. Since most sites have lots of GIF or JPEG files (which should always be cacheable), you need to use your cache effectively.

Some sites, however, do almost everything through CGIs, SHTML, or other dynamic sources. Dynamic content is generally not cacheable and inherently yields a low cache hit rate. Don't be too alarmed if your site has a low cache hit rate. The most important thing is that your response time is low. You can have a very low cache hit rate and still have very good response time. As long as your response time is good, you may not care that the cache hit rate is low.

Checking
Begin by checking your Hit Ratio. This is the percentage of times the cache was used with all hits to your server. A good cache hit rate is anything above 50%. Some sites may even achieve 98% or higher.

In addition, if you are doing a lot of CGI or NSAPI calls, you may have a low cache hit rate.

Tuning
If you have custom NSAPI functions (nametrans, pathcheck, etc), you may have a low cache hit rate. If you are writing your own NSAPI functions, be sure to see the programmer's guide for information on making your NSAPI code cacheable as well.

KeepAlive Connections Flushed
A web site that might be able to service 75 requests per second without keepalives may be able be able to do 200-300 requests per second when keepalives are enabled. Therefore, as a client requests various items from a single page, it is important that keepalives are being used effectively. If the KeepAliveCount exceeds the KeepAliveMaxCount, subsequent KeepAlive connections will be closed (or "flushed") instead of being honored and kept alive.

Checking
Check the KeepAliveFlushes and KeepAliveHits values. On a site where KeepAlives are running well, the ratio of KeepAliveFlushes to KeepAliveHits is very low. If the ratio is high (greater than 1:1), your site is probably not utilizing the HTTP KeepAlives as well as it could.

Tuning
To reduce KeepAlive flushes, increase the MaxKeepAliveConnections value in the magnus.conf file. The default value is 200. By raising the value, you keep more waiting keepalive connections open.

Warning. On Unix systems, if you increase the MaxKeepAliveConnections value too high, the server can run out of open file descriptors. Typically 1024 is the limit for open files on Unix, so increasing this value above 500 is not recommended.

Log File Modes
Keeping the log files on verbose mode can have a significant affect of performance.

Client-Host, Full-Request, Method, Protocol, Query-String, URI, Referer, User-Agent, Authorization and Auth-User: Because the "obscure" variable cannot be provided by the internal "accelerated" path, the accelerated path will not be used at all. Therefore performance numbers will decrease significantly for requests that would typically benefit from the accelerator, for example static files and images.

iPlanet Web Server, Enterprise Edition 4.1 has a relaxed logging mode that eases the requirements of the log subsystem. Adding "relaxed.logname=anything" to the "flex-init" line in obj.conf changes the behavior of the server in the following way: Logging variables other than the "blessed few" does not prevent the accelerated path from being used. If the accelerator is used, the "non-blessed" variable (which is then not available internally) will be logged as "-". The server does not use the accelerator for dynamic content like CGIs or SHTML, so all the variables would be logged correctly for these requests.

Using Local Variables
The JavaScript virtual machine in iPlanet Web Server, Enterprise Edition 4.1 implements significant improvements in processing local variables (variables declared inside a function). Therefore, you should minimize the use of global variables (variables declared between the <server> and </server> tags), and write applications to use functions as much as possible. This can improve the application performance significantly.


Sizing Issues
This section examines subsystems of your server and makes some recommendations for optimal performance:

For more information on scalability, see the studies in Scalability Studies.

Processors
On Solaris and Windows NT, iPlanet Web Server transparently takes advantage of multiple CPUs. In general, the effectiveness of multiple CPUs varies with the operating system and the workload. Dynamic content performance improves the most as more processors are added to the system. Because static content involves mostly IO and more primary memory means more caching of the content (assuming the server is tuned to take advantage of the memory) more time is spent in IO rather than any busy CPU activity. Our study of dynamic content performance on a four-CPU machine indicate a 40-60% increase for NSAPI and about 50-80% increase for servlets.

See the Scalability Studies for more information.

Memory
As a baseline, iPlanet Web Server requires 64MB RAM. If you have multiple CPUs, get at least 64MB per CPU. For example, if you have four CPUs, you should install at least 256MB RAM for optimal performance. At high numbers of peak concurrent users, also allow extra RAM for the additional threads. After the first 50 concurrent users, add an extra 512KB per peak concurrent user.

Drive Space
You need to have enough drive space for your OS, document tree, and log files. In most cases 2GB total is sufficient.

Put the OS, swap/paging file, iPlanet Web Server logs, and document tree each on separate hard drives. Thus, if your log files fill up the log drive, your OS will not suffer. Also, you'll be able to tell whether, for example, the OS paging file is causing drive activity.

Your OS vendor may have specific recommendations for how much swap or paging space you should allocate. Based on our testing, iPlanet Web Server performs best with swap space equal to RAM, plus enough to map the document tree.

Networking
For an Internet site, decide how many peak concurrent users you need the server to handle, and multiply that number of users by the average request size on your site. Your average request may include multiple documents. If you're not sure, try using your home page and all its associated subframes and graphics.

Next decide how long the average user will be willing to wait for a document, at peak utilization. Divide by that number of seconds. That's the WAN bandwidth your server needs.

For example, to support a peak of 50 users with an average document size of 24kB, and transferring each document in an average of 5 seconds, we need 240 KBytes/s - or 1920 kbit/s. So our site needs two T1 lines (each 1544 kbit/s). This allows some overhead for growth, too.

Your server's network interface card should support more than the WAN it's connected to. For example, if you have up to 3 T1 lines, you can get by with a 10BaseT interface. Up to a T3 line (45 Mbit/s) you can use 100BaseT. But if you have more than 50 Mbit/s of WAN bandwidth, consider configuring multiple 100BaseT interfaces, or look at Gigabit Ethernet technology.

For an intranet site, your network is unlikely to be a bottleneck. However, you can use the same calculations as above to decide.


Scalability Studies
This scalability section contains the results of three studies covering the following topics:

You can refer to these studies for a sample of how the server performs, and how you might configure your system to best take advantage of the iPlanet Web Server's strengths.

For additional performance information, see the Mindcraft white paper "iPlanet Web Server, Enterprise Edition 4.1 and Stronghold 2.4.2 Performance Comparison Analysis and Details" at:

http://www.mindcraft.com/whitepapers/iws/iwsee4-sh242-p2.html

Scalability of Dynamic and Static Content (4.0)
Scalability for the server varies for different content types, but all types of content scale well. This section describes a study that tests the scalability of various types of content: 100% static, 100% dynamic, and mixed load (30% static + 70% dynamic). Please note that this study was not done using optimal equipment or configuration to produce benchmarks.

Perl-CGI and C-CGI scale the most by a factor of 0.88, followed by SHTML and mixed load, with a scaling factor of 0.79. Java servlets scale moderately by a factor of 0.68. NSAPI's scaling factor is 0.57. Finally, 100% static content's scaling factor is only 0.44, which is expected. The poor scalability of static content is most likely due to the fact that the system only has a single disk to store content, and system performance is bottlenecked on disk I/O. Performance will improve if you spread the data out on more than one disk, or if you use a faster disk or faster file system.

Study Goals
This study shows how well iPlanet Web Server, Enterprise Edition scales against one CPU, two CPUs and four CPUs. This study also helps in determining what kind of configuration (CPU and memory) is required for different types of content. The studies were conducted against the following content:

Study Assumptions
The following assumptions were made to make the studies more realistic:

Setting up the Study
After modifying the /etc/system appropriately (physmem =256MB for one CPU or 512MB for two CPUs or 1GB for four CPUs), we rebooted the server. Using the psradm command, we disabled the desired number of CPUs. We started the server. After making a note of the memory (using top command) and CPU utilization (using vmstat command), we started WebBench clients, first with one client, then with two clients, and so on, until the server CPU utilization was close to 100%.

The result with the highest requests/second and response time no more than 20ms was considered a good reading. We repeated this three times to check for consistency.

Application. The default configuration (obj.conf and magnus.conf) of iPlanet Web Server, Enterprise Edition 4.0 was used.

Study Tool. WebBench 3.0.

Server. The server under test was an E450 with 4 CPUs (168MHz) and 1.6 GB of memory. The server parameters were tuned appropriately.

Clients. The clients were WIntel (running Windows NT 4.0) machines running 1 or more clients (depending on the size of the machine). In all 7 to 8 machines were used.

Each WebBench 3.0 client was configured to run HTTP 1.0, with 24 threads.

Network. All systems are connected through a single 100baseT switch.

CPU. The number of CPUs used was controlled by the psradm command (and
-f option).

Memory. The amount of physical memory used was controlled by the adding the line set physmem=x in the /etc/system file; where x was equal to 0x8000 for 256 MB, 0x10000 for 512 MB and 0x20000 for 1 GB.

Content. The static content was a 64 MB tree (provided by WebBench 3.0), containing 6000 files. The files varied in size from 1K to 500K. The document root (in obj.conf) was pointed to this tree, which is on a separate disk. Except NSAPI executables, all other content--such as SHTMl, C-CGI, Perl-CGI and Java servlets--were on the same disk as the document root.

Study Results
The following sections show the results of the study.

100% Static

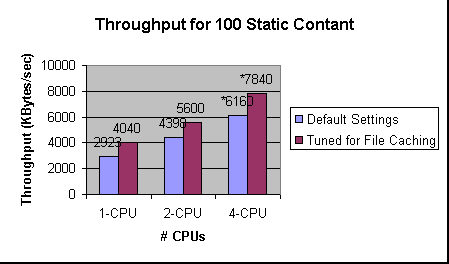
The study used Web Bench 3.0 standard static content tree comprising files of different sizes totalling about 64 MB. Each file belongs to a particular class depending on its size. The workload characteristics ensure small and medium sized files are accessed more than the large files, reflecting a more realistic stress on the server. The study was first run with defaults (without tuning the file cache with nsfc.conf). The server scales moderately with a scaling factor of 0.40.

The study was run for the second time after tuning the file cache. The scaling factor was still about 0.40. The nsfc.conf was configured to cache or mmap all the content, guaranteeing better performance. Figure 1.1 and Figure 1.2 show the average requests per second and average throughput for 100% static content against one CPU, two CPUs and four CPUs, for both unconfigured and configured nsfc.conf.

Figure 1.1    Requests per second for 100% static content

Figure 1.2    Throughput for 100% static content
Notes
The numbers with an asterisk (*) in the graphs are estimated. These numbers are estimated due to the small number of client machines and plenty of available CPU idle time. When all the four CPUs were enabled, and all available 18 clients were used, the server (CPU) was still idle for approximately 30% of the time, with default file cache (no nsfc.conf present), and about 50% with a relatively tuned nsfc.conf. The maximum numbers obtained were 853 req/second and 5134 KB per second throughput, for default configuration and 955 requests/second and 5900 KB per second throughput when nsfc.conf was tuned.

Also note that the cache-hit ratio typically never reaches 100% unless the study is run a number of times (this is due to statistical nature of the study--not all files in the workload are necessarily accessed during any run).

100% SHTML

This study was run against the file mixed-dirs.shtml. This file has a number of echo statements, an include of 8 KB, and displays the last modification time stamp of a file. Figure 1.3 and Figure 1.4 represent average requests per second and average throughput for 100% SHTML content against one CPU, two CPUs and four CPUs. From the graphs it is clear that the server scales well above average, with a scaling factor of 0.79.

Figure 1.3    Requests per second for 100% SHTML content

Figure 1.4    Throughput for 100% SHTML content

100% C-CGI

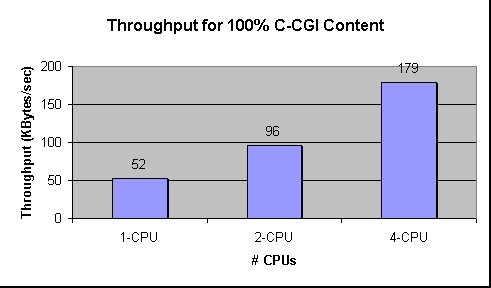
100% C-CGI was tested by accessing a C executable called printenv. This executable prints the CGI environment. Figure 1.5 and Figure 1.6 represent average requests per second and average throughput for 100% C-CGI content against one CPU, two CPUs and four CPUs. From the graphs it is clear that the server scales very well for C-CGI content. It scales with a factor of 0.88.

Figure 1.5    Requests per second for 100% C-CGI content

Figure 1.6    Throughput of 100% C-CGI content
100% Perl-CGI

This study ran against a Perl script called printenv.pl. This script prints the CGI environment, just like the C executable printenv does. Figure 1.7 and Figure 1.8 represent average requests per second and average throughput for 100% Perl-CGI content against one CPU, two CPUs, and four CPUs. From the graphs it is clear that the server scales very well, similar to C-CGI. The scaling factor is 0.88.

Figure 1.7    Requests per second for 100% Perl-CGI content
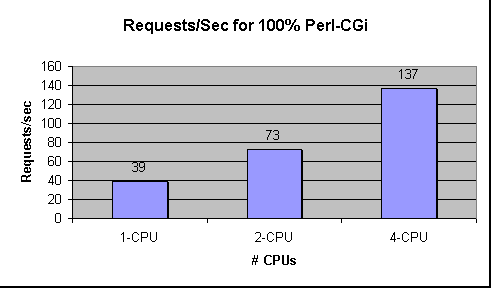
Figure 1.8    Throughput for 100% Perl-CGI content

100% NSAPI

The NSAPI module used in this study was printenv2.so. This module prints the NSAPI environment variables along with some text to make the entire response over 1 KB. Figure 1.9 and Figure 1.10 represent average requests per second and average throughput for 100% NSAPI content against one CPU, two CPUs, and four CPUs.

Figure 1.9    Requests per second for 100% NSAPI content
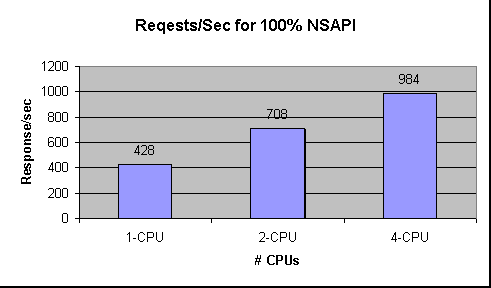
Figure 1.10    Throughput for 100% NSAPI content

100% Java Servlets

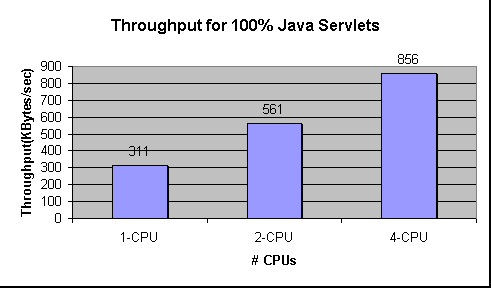
This study was conducted using the WASP servlet. It prints out the servlet's initialization arguments, environments, request headers, connection/client info, URL information, as well as remote user information. Figure 1.11 and Figure 1.12 represent average requests per second and average throughput for 100% Java servlets content against one CPU, two CPUs, and four CPUs. From the graphs it is clear that the server scales moderately well for Java servlets content. The scaling factor is 0.68.

Figure 1.11    Response per seconds for 100% Java servlets
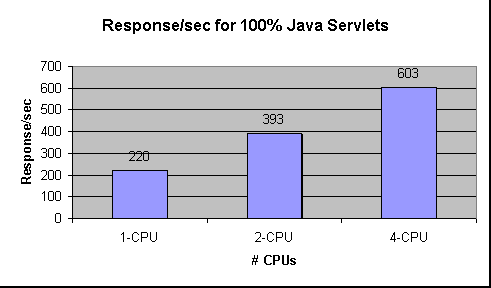
Figure 1.12    Throughput for 100% Java servlets
Mixed Load

The mixed load study was conducted using the 64 MB static content tree for static content, and all the dynamic scripts/executables for the dynamic content. The workload was configured so that 30% of the requests would access files from the static tree, 10% of the requests would access the mix-dir.shtml file, 20% printenv.pl, 20% printenv, 20% the NSAPI.so and the remaining 20% of the requests would access the WASP servlet. Figure 1.13 and Figure 1.14 show average requests per second and average throughput for content with mixed load against one CPU, two CPUs and four CPUs. From the graphs it is clear that the server scales well for content with mixed load. The scaling factor for such a mixed load is 0.79.

Figure 1.13    Requests per second for mixed content

Figure 1.14    Throughput for mixed content

Connection Scalability Study (4.0)
This study shows how many connections you can have for a given number of CPUs and the memory needed as the number of connections increases.

In terms of the number of requests that the server can handle, it scales well from one CPU to four CPUs. With a load of 5500 concurrent users, the server on a four CPUs system handles close to 2136 requests per second with a reasonable response time.

Each iPlanet Web Server process seems capable of handling up to 1500 requests with a reasonable response time; however, it is recommended that each process handle up to 1000 requests per second. You can increase the number of processes for the optimal performance. Usually, when you increase of number of processes you reduce response time.

In terms of memory footprint, it seems to grow 1 MB for each 350 incremental requests. This is true only for the single process. When the number of processes is increased, the memory footprint becomes 60 MB, with 40 MB of this 60 MB an mmaped file to share data between processes.

Configuration and Study Details
The goal of this exercise was to study the cost of connections on a four CPU system. This study deliberately uses a bare minimum size of index.html. All the load generators are set up to GET this index.html file.

Analysis
Table 1.4, Figure 1.15, and Figure 1.16, show that the number of requests served and throughput scale almost linearly from one CPU to four CPUs, with reasonable response time.

Table 1.4 Throughput vs. number of CPUs
Number of CPUs
Number of Requests
Throughput (MB)
Response time (ms)
1 CPU
885
2.8
29.5
2 CPUs
1571
4.9
5.6
4 CPUs
2136
7.9
5.0

Figure 1.15    Throughput in Number of Requests

Figure 1.16    Throughput in MB
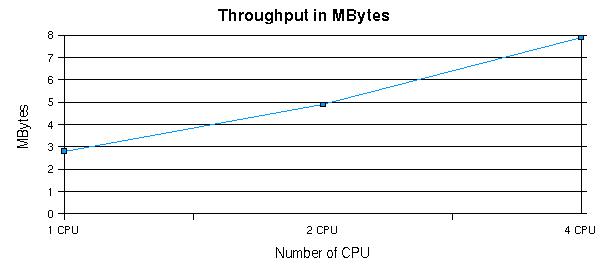
Table 1.5, Figure 1.17, Figure 1.18, and Figure 1.19 show that the throughput and requests handled scale quite well with increasing load on the system from 500 concurrent users all the way up to 5500 clients. Note that we started more than one iPlanet Web Server process when it reached 1500 requests per second, otherwise there are long delays for all the requests.

Table 1.5 Statistics on a 4 CPU system
Load
Throughput
Number of Requests
Response Time
Notes
500
0.73
19
4.15

1000
1.46
393
4.15

1500
2.16
589
4.15

2000
2.80
785
4.70

2500
3.65
982
5.00

3000
4.38
1177
6.00

3500
4.90
1374
8.30

4000
5.60
1548
10.00

4500
6.30
1769
5.00
MaxProc=3
5000
7.00
1908
5.00
MaxProc=3
5500
7.70
2136
5.00
MaxProc=3

Figure 1.17    Throughput in MB vs. requested load

Figure 1.18    Throughput in number of requests vs. requested load
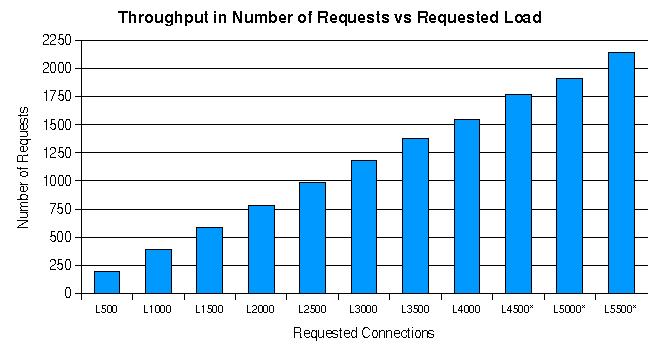
Figure 1.19    Response time vs. requested load

Table 1.6 and Figure 1.20 show that the memory footprint grew about 1M for each additional 1000 load imposed on the system (or each 400 requests). The last three rows of Table 1.6 show MaxProc has been tuned to 3 to increase the performance, since a single iPlanet Web Server process could not handle the number of requests at the load of 4500.

Table 1.6 Memory usage vs. load imposed
Load
Size
Res
Note
500
17
15

1000
17
15

1500
18
15

2000
18
15

2500
21
17

3000
21
17

3500
21
17

4000
21
17

4500
62
14
MaxProc=3
5000
65
15
MaxProc=3
5500
64
15
MaxProc=3

Figure 1.20    Memory usage vs. load imposed

magnus.conf Directive Settings Used in Study
iPlanet Web Server 4.1 Scalability Study
The major focus of this study was to address scalability of the iPlanet Web Server 4.1 server on a Solaris E4500 system, whose configuration is given below. This study has the following sections:

Goals
The study focused mainly on these issues:

The studies were conducted against the following content:

While the perl-CGI and servlet tests used the same load as described in the previous studies of iPlanet Web Server 4.0, static and SHTML tests were different both in content and the method used to generate load; for these two tests there is no direct comparison with the previous studies. In addition, SSL-enabled performance, scalability, and the effect of using an alternate threads library, which is available on Solaris 8, were studied. This study also emphasizes scalability on larger servers.

Server Settings Used
The study used default settings for the server except for the static test, for which the file cache was enabled. For this test, the cache was configured to be large enough to contain all the directories being accessed.

The following nsfc.conf settings were used:

FileCacheEnable=true
MaxAge=7200
MaxFiles=200500
MaxOpenFiles=200500
SmallFileSizeLimit=10240
SmallFileSpace=2147483648
MediumFileSizeLimit=10
MediumFileSpace=1024

The following obj.conf setting (all on one line) enabled the cache:

Init fn="cache-init" MaxNumberOfCachedFiles="200500" MaxNumberOfOpenCachedFiles="200500" CacheHashSize="400001" Reaper="off"

For java servlets, the JVM was configured to use the JDK1.2.2-05a production release.

Hardware and Software Configuration of the System
The server ran the Solaris 8 operating system with the settings described below.

System Limits

System limits were set using the following /etc/system settings:

set rlim_fd_max=8192

set rlim_fd_cur=8192

set sq_max_size=0

set tcp:tcp_conn_hash_size=8192

Here is another tcp setting used (via ndd):

tcp_time_wait_interval=60000

System Hardware

A Sun Enterprise E4500/E5500 computer with a System clock frequency of 100 MHz and 12288 MB of memory was used. The following tables summarize the CPUs, memory, and I/O cards.

Table 1.7 CPU summary
Board
CPU
Module
Run MHz
Ecache MB
CPU Impl.
CPU Mask
0
0
0
400
8.0
US-II
10.0
0
1
1
400
8.0
US-II
10.0
2
4
0
400
8.0
US-II
10.0
2
5
1
400
8.0
US-II
10.0
4
8
0
400
8.0
US-II
10.0
4
9
1
400
8.0
US-II
10.0
5
10
0
400
8.0
US-II
10.0
5
11
1
400
8.0
US-II
10.0
6
12
0
400
8.0
US-II
10.0
6
13
1
400
8.0
US-II
10.0
7
14
0
400
8.0
US-II
10.0
7
15
1
400
8.0
US-II
10.0

Table 1.8 Memory summary
Board
Bank
MB
Status
Condition
Speed
Intrlv. Factor
Intrlv. Width
0
0
1024
Active
OK
60ns
8-way
A
0
1
1024
Active
OK
60ns
8-way
A
2
0
1024
Active
OK
60ns
8-way
A
2
1
1024
Active
OK
60ns
8-way
A
4
0
1024
Active
OK
60ns
8-way
A
4
1
1024
Active
OK
60ns
4-way
B
5
0
1024
Active
OK
60ns
8-way
A
5
1
1024
Active
OK
60ns
4-way
B
6
0
1024
Active
OK
60ns
8-way
A
6
1
1024
Active
OK
60ns
4-way
B
7
0
1024
Active
OK
60ns
8-way
A
7
1
1024
Active
OK
60ns
4-way
B

Table 1.9 I/O card summary
Board
Bus Type
Freq. MHz
Slot
Name
Model
1
SBus
25
0
SUNW,socal/sf (scsi-3)
501-3060
1
SBus
25
1
SUNW,hme
SUNW,501-2739
1
SBus
25
1
SUNW,fas/sd (block)

1
SBus
25
2
SUNW,qfe
SUNW,sbus-qfe
1
SBus
25
2
SUNW,qfe
SUNW,sbus-qfe
1
SBus
25
2
SUNW,qfe
SUNW,sbus-qfe
1
SBus
25
2
SUNW,qfe
SUNW,sbus-qfe
1
SBus
25
3
SUNW,hme

1
SBus
25
3
SUNW,fas/sd (block)

1
SBus
25
13
SUNW,socal/sf (scsi-3)
501-3060
3
SBus
25
0
SUNW,socal/sf (scsi-3)
501-3060
3
SBus
25
1
SUNW,hme
SUNW,501-2739
3
SBus
25
1
SUNW,fas/sd (block)

3
SBus
25
3
SUNW,hme

3
SBus
25
3
SUNW,fas/sd (block)

3
SBus
25
13
SUNW,socal/sf (scsi-3)
501-3060

Load Generators Used
These load generators were used:

Performance Metrics
For all tests, operations per second (number of successful requests processed per second) and throughput were the performance metrics.

Results
The following figure shows the overall results of the study for the types of content examined.

Figure 1.21    Sizing data for different micro-benchmarks

The static tests involved downloading files from 60 directories, each containing 100 files. The files ranged in size from 1K to 50K Since static downloads are not CPU bound, caching the contents in memory makes downloads faster. For small downloads, the performance is more limited by memory latency than bandwidth. This may explain the better performance data when using the E450 (which was used for 4.0 studies) than the E4500 systems used for the current study.

Figure 1.22    Static content scalability

Figure 1.23    Static load throughput
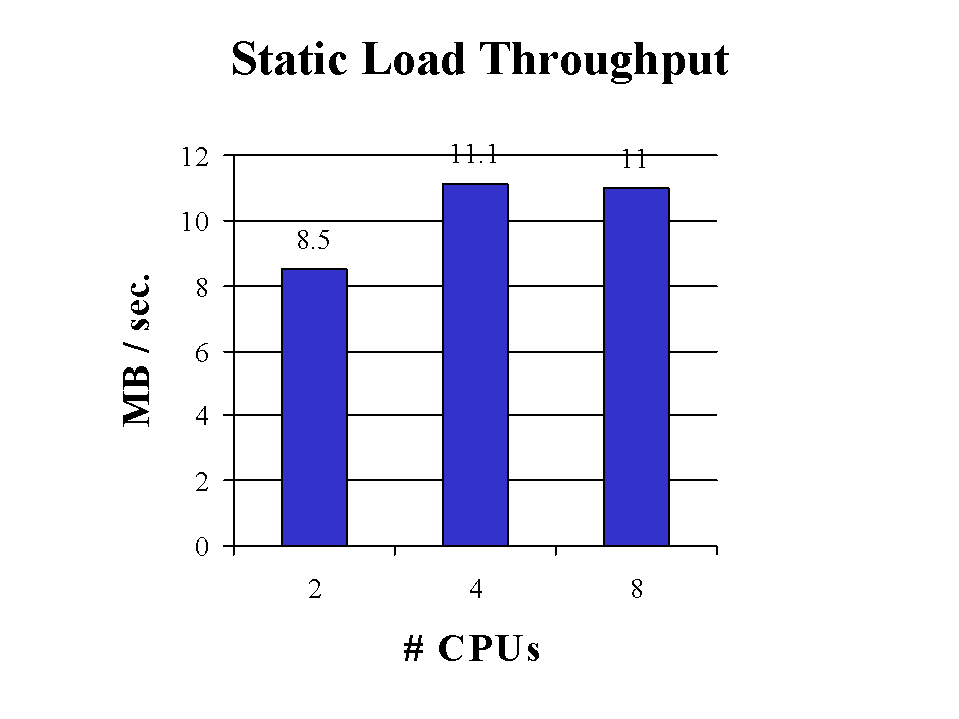
For SSL-enabled static tests, the operations were very CPU bound, and good scaling was seen up to 4 CPUs ( a factor of 0.7). For the default two-level Solaris threads library the scaling stalled beyond 4 CPUs. When the same test was repeated using single level threads, scaling improved considerably for 8 CPU tests.

Figure 1.24    Static content SSL scalability
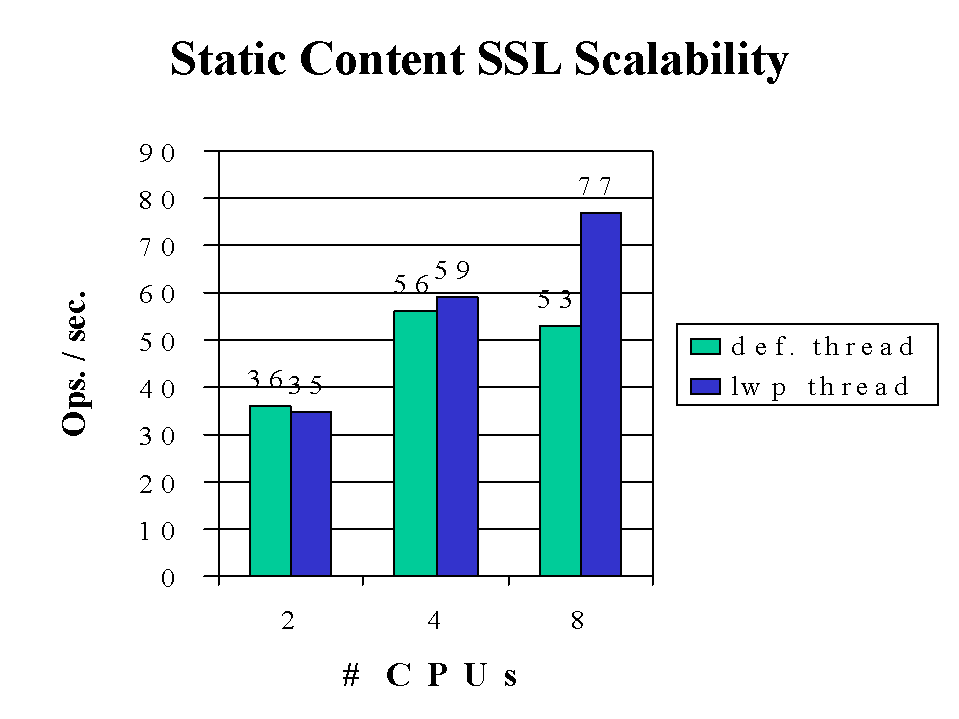
Figure 1.25    Static SSL throughput

Also shown here are the results of an SSL-enabled static test using the session cache. The cache is tuned for 100% session re-use: only one handshake computation is performed for the duration of the test.

Figure 1.26    Static/SSL scalability with and without session cache

For SHTML, a nested include of depth 3 was used. These results are shown in the following figures. A factor of 0.4 scaling was seen going from 2 to 4 CPUs.

Figure 1.27    SHTML scalability
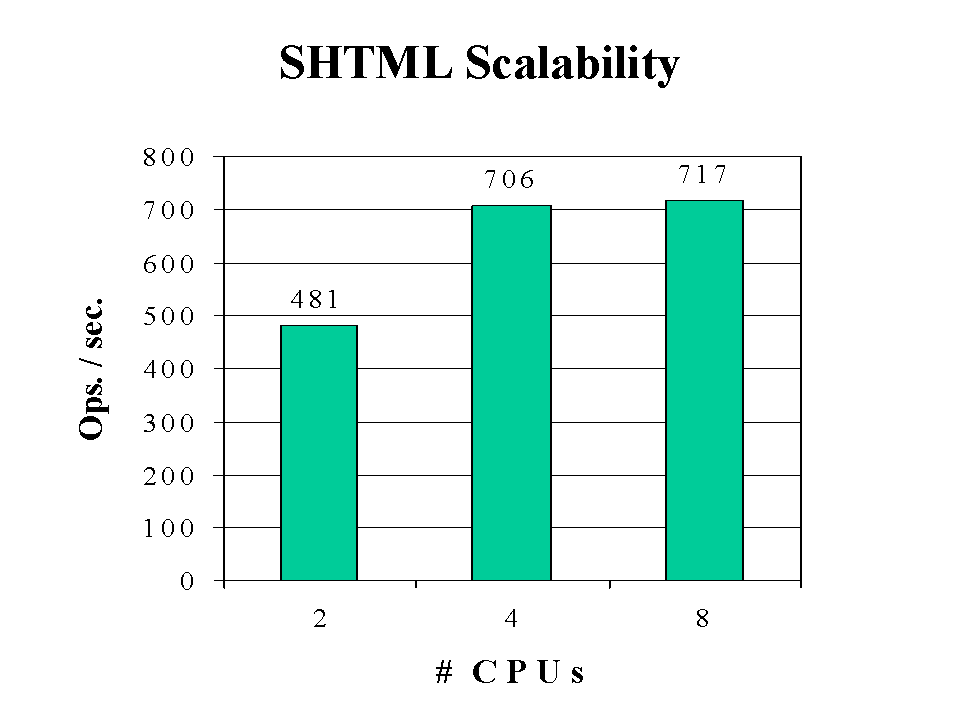
Figure 1.28    SHTML scalability throughput
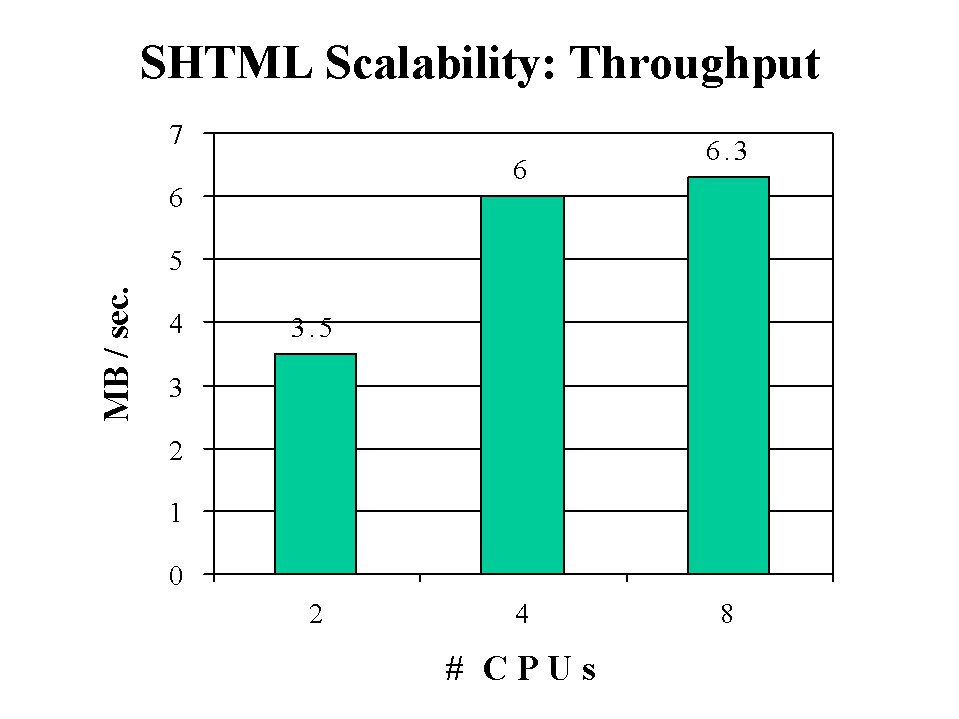
The Perl-CGI test was identical to the same test in the 4.0 study. The Perl-CGI test scaled well all the way to 8 CPUs. For a simple printenv test, near linear scaling was seen.

Figure 1.29    Perl-CGI scalability
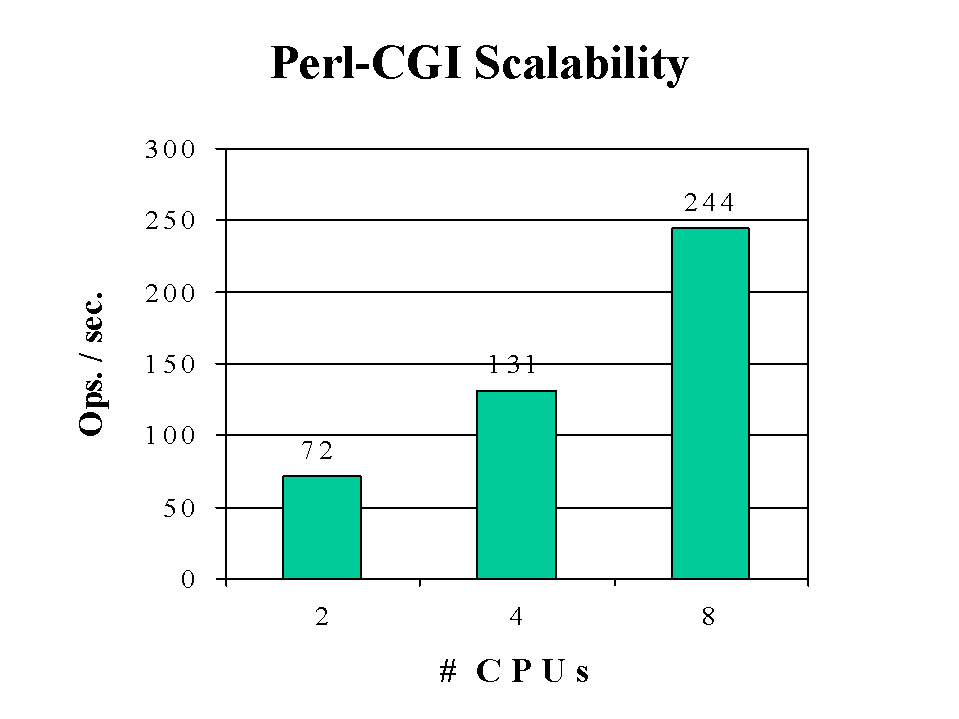
The servlet test achieved the best scaling using alternate lib threads. A factor of 1.8 scaling was seen going from 2 to 8 cpus. Here we need to investigate limitations imposed by the JVM and contention at the kernel level.

Figure 1.30    WASP servlet scalability
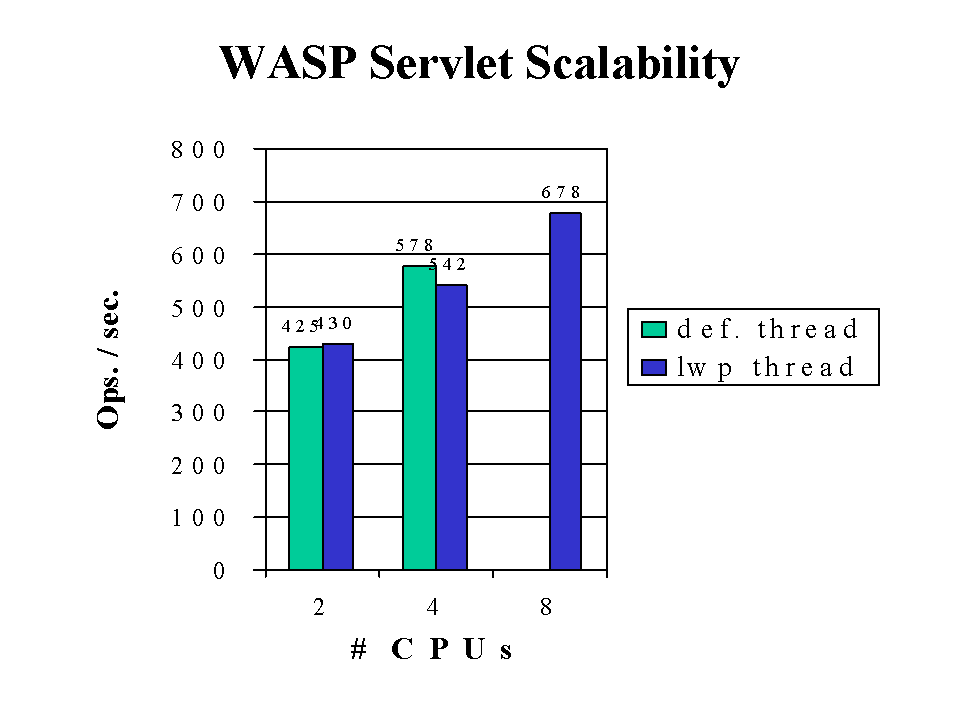
 

© Copyright 1999 Netscape Communications Corporation. All rights reserved.