Starting and Finishing a BPEL Debugging Session
A debugging session begins when you connect the BPEL Debugger to the BPEL Service Engine. Only one debugging session can be running with the BPEL Service Engine at a given time.
After a BPEL debugging session starts, you can execute process instances step-by-step, inspecting the values of BPEL variables and XPath expressions in the Local Variables and Watches windows. You can monitor the execution of a BPEL process within a debugger session on the diagram in the Design view: the activities that are being executed are highlighted on the diagram as the current execution position advances. The BPEL Process Execution window also shows the execution of the BPEL process.
 To prepare the debugging environment:
-
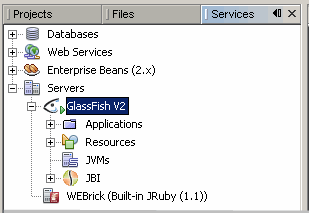
In the Services window, make sure that the GlassFish V2 Application Server is running. The Application Server is running if it has subnodes and is marked with a green triangle.
If the server is not started, right-click it and choose Start from the pop-up menu. For details about how to start the Application Server, see the The BPEL Service Engine section.

-
In the IDE, open the BPEL process in either the Source or Design view.
-
Set breakpoints in the BPEL process.
-
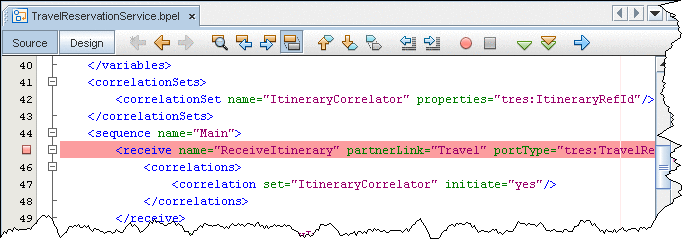
To set breakpoints in the Source view, click next to the line where you want to set the breakpoint.

-
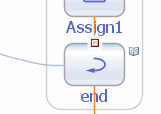
To set breakpoints on the diagram, switch to the Design view, right-click the element and choose Toggle Breakpoint from the pop-up menu. A red square appears at the top of the element with a breakpoint.

-
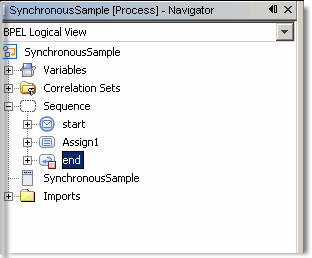
The Toggle Breakpoint pop-up menu command is also available for the elements in the Navigator BPEL Logical View. For the elements with breakpoints, the Navigator shows a small red box (ReceiveItinerary):

-
-
Optionally, you can add watches to monitor XPath expressions. To add a watch, copy the XPath expression you want to monitor, choose Run > Add Watch from the main menu, and paste the expression into the Watch Expression field. Click OK.
Note: You can also add XPath expressions that are not present in the code, but that would be valuable from the debugging point of view.

 To start and finish a debugging session on the BPEL
Engine:
-
In the Projects window, right-click the Composite Applications project you want to debug and choose Debug (BPEL) from the pop-up menu.
A debug session is established on the BPEL Service Engine. Watch the BPEL Debugger Console window for confirmation. The connection might take some time to complete. When it is successfully completed, you can see the new session in the Sessions window and the following messages in the BPEL Debugger Console:
11:35:17 Connecting to localhost:3343
11:36:19 Debug session started
Note that the Debug (BPEL) command performs the following actions:
-
Enables debugging with the BPEL Service Engine (sets the DebugEnabled property of the BPEL Service Engine to true)
-
Builds the Composite Application project and all JBI Modules added to this project
-
Deploys the Composite Application project to the BPEL Service Engine
-
Starts the debugging session by connecting the BPEL Debugger to the BPEL Service Engine
Therefore, whenever you start a debugging session you can be sure that the latest version of the BPEL process is deployed on the BPEL Service Engine.
Now you can run a test case and monitor the execution of the BPEL process until it stops or reaches a breakpoint. As the process advances, the current context is displayed on the diagram and in the BPEL Process Execution window.
If you have several debugging sessions (you may have a Java debugging session running at the same time) and want to change the current session, double-click the name of this session in the Sessions window. Alternatively, right-click the session you want to make current and select Make Current. This session becomes current and the BPEL Process Instances, Watches and Local Variables Windows are updated to show the data related to the new current session.
When you want to finish a debugging session, open the pop-up menu for the session you want to stop and choose Finish in the Sessions window or select Finish Debugger Session on the toolbar. A message that the debugging session is finished is displayed in the BPEL Debugger Console.
To finish all debugging sessions, in the Sessions window, right-click any session and choose Finish All.
-
- © 2010, Oracle Corporation and/or its affiliates
