| Skip Navigation Links | |
| Exit Print View | |

|
System Administration Guide: Advanced Administration Oracle Solaris 11 Express 11/10 |
| Skip Navigation Links | |
| Exit Print View | |

|
System Administration Guide: Advanced Administration Oracle Solaris 11 Express 11/10 |
1. Managing Terminals, Modems and Serial Port Services (Tasks)
2. Displaying and Changing System Information (Tasks)
3. Scheduling System Tasks (Tasks)
4. Managing System Processes (Tasks)
5. Monitoring System Performance (Tasks)
What's New in Managing System Performance?
LatencyTOP Performance Tuning Utility
Where to Find System Performance Tasks
System Performance and System Resources
About Monitoring System Performance
Displaying System Performance Information (Task Map)
Displaying Virtual Memory Statistics (vmstat)
How to Display Virtual Memory Statistics (vmstat)
How to Display System Event Information (vmstat -s)
How to Display Swapping Statistics (vmstat -S)
How to Display Interrupts Per Device (vmstat -i)
Displaying Disk Utilization Information (iostat)
How to Display Disk Utilization Information (iostat)
How to Display Extended Disk Statistics (iostat -xtc)
Displaying Disk Space Statistics (df)
How to Display Disk Space Information (df -k)
Monitoring System Activities (Task Map)
Monitoring System Activities (sar)
How to Check File Access (sar -a)
How to Check Buffer Activity (sar -b)
How to Check System Call Statistics (sar -c)
How to Check Disk Activity (sar -d)
How to Check Page-Out and Memory (sar -g)
Checking Kernel Memory Allocation
How to Check Kernel Memory Allocation (sar -k)
How to Check Interprocess Communication (sar -m)
How to Check Page-In Activity (sar -p)
How to Check Queue Activity (sar -q)
How to Check Unused Memory (sar -r)
How to Check CPU Utilization (sar -u)
How to Check System Table Status (sar -v)
How to Check Swapping Activity (sar -w)
How to Check Terminal Activity (sar -y)
How to Check Overall System Performance (sar -A)
Collecting System Activity Data Automatically (sar)
Running the sadc Command When Booting
Running the sadc Command Periodically With the sa1 Script
Producing Reports With the sa2 Shell Script
Setting Up Automatic Data Collection (sar)
How to Set Up Automatic Data Collection
6. Troubleshooting Software Problems (Tasks)
7. Managing Core Files (Tasks)
8. Managing System Crash Information (Tasks)
The following table describes terms that are related to processes.
Table 5-1 Process Terminology
|
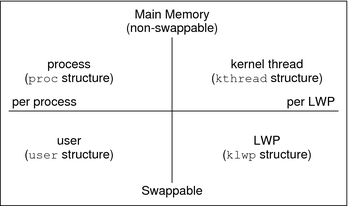
A process can consist of multiple LWPs and multiple application threads. The kernel schedules a kernel-thread structure, which is the scheduling entity in the SunOS environment. Various process structures are described in the following table.
Table 5-2 Process Structures
|
The following figure illustrates the relationships among these process structures.
Figure 5-1 Relationships Among Process Structures

Most process resources are accessible to all the threads in the process. Almost all process virtual memory is shared. A change in shared data by one thread is available to the other threads in the process.