| Oracle® Enterprise Data Quality for Product Data Governance Studio Reference Guide Release 5.6.2 Part Number E23609-02 |
|
|
View PDF |
| Oracle® Enterprise Data Quality for Product Data Governance Studio Reference Guide Release 5.6.2 Part Number E23609-02 |
|
|
View PDF |
This chapter describes the basic types of tabs that display in Governance Studio.
The Source tab in any existing Governance Studio project displays the input data that can be processed.
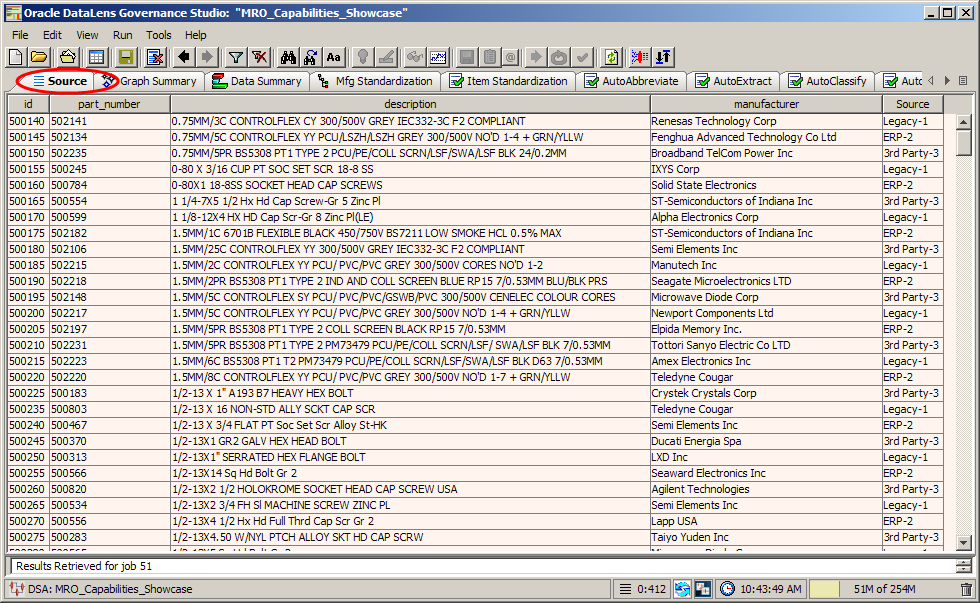
From the Source tab you can select one or multiple rows to process using the DSA. Rows are selected using the following methods:
Use Ctrl+a.
Press and hold Ctrl and click on each row to select.
Press and hold Shift then click the first row and then the last in the group you want to select.
For more information, see "Running a Governance Studio Project".
The fields in the table, with the exception of those in the unique id column, can be edited. You can double-click in a field, edit it, and then either press Enter or click outside the edited field. Changed fields are highlighted green so that you can easily identify them before processing. The edited data is available for further processing.
Tip:
When you select rows, you can copy them to the clipboard using Ctrl+c. In another Windows application, such as Excel, you can then paste the data into the open file using Ctrl-v.The Graph Summary tabs appear in the list of tabs only if an output step in your DSA has a DGS output type of Summary Data for Graphing defined. Depending on your DSA, it is possible that there are too many graphs to appear on one page in the Governance Studio.
You can define the number of graphs you want to appear (see "Configuring a DSA for Governance Studio".) Additional Graph Summary tabs are created for additional graphs until all of the graphs have been accounted for.
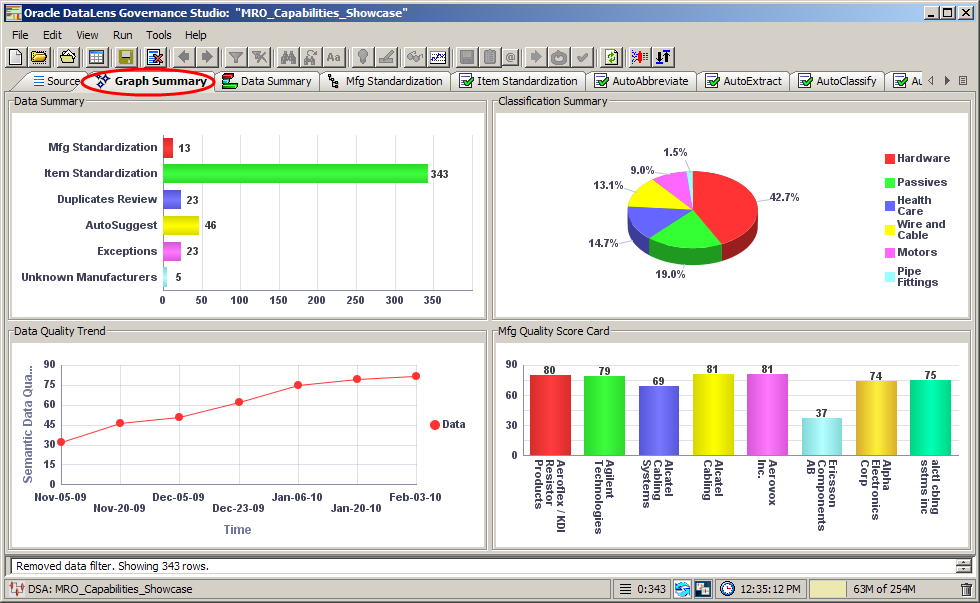
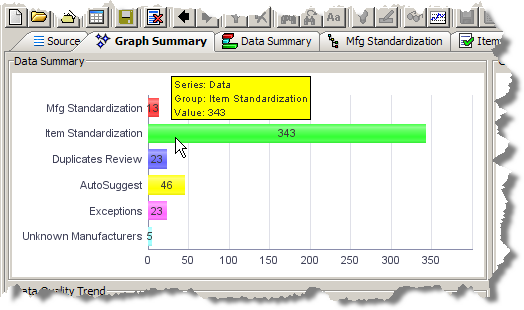
When you hover your cursor over any of the bars on this tab, a tooltip describes the information shown in that bar. You can double-click on the bar in the graph to activate the Output tab (if there is a tab associated with that graph data) that corresponds to the graphed data.
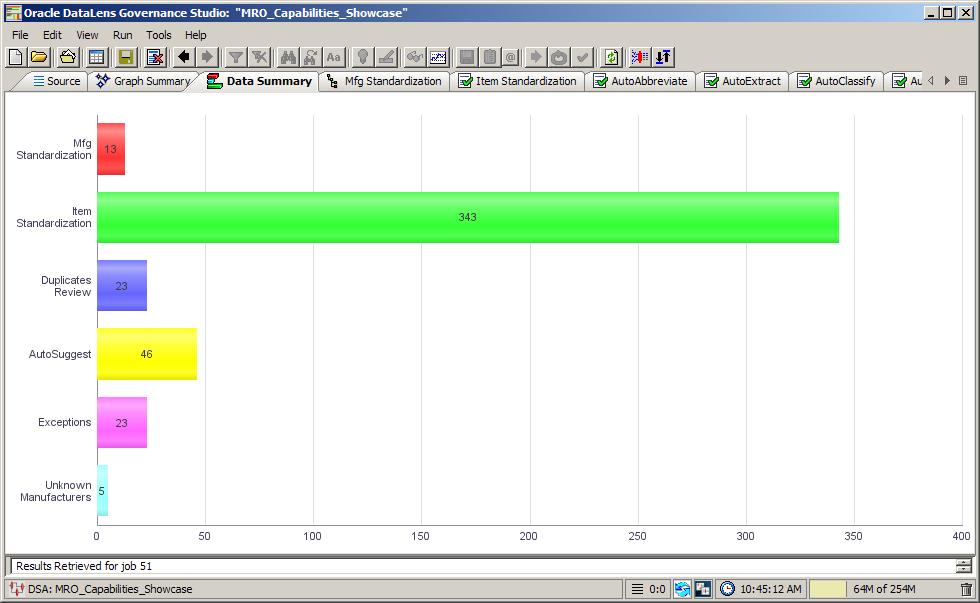
The Data Summary tab displays a bar chart of the number of rows contained in each of the output data tabs. Unlike the Graph Summary tabs, there can be only one Data Summary tab. It appears by default unless you disable the option (see "Configuring a DSA for Governance Studio".) The Data Summary tab graph shows you at a glance the number of rows of data you have in each of the Output tab tables. For example, if an Output tab table contains exception data and the number is very large relative to the other output steps, you would be able to identify this problem easily. Double-clicking on any bar in the graph immediately activates the Output tab table as identified to the left of the bar.
|
Copyright © 2001, 2011, Oracle and/or its affiliates. All rights reserved. Legal Notices |
|