| Oracle® Enterprise Data Quality for Product Data Governance Studio Reference Guide Release 5.6.2 Part Number E23609-02 |
|
|
View PDF |
| Oracle® Enterprise Data Quality for Product Data Governance Studio Reference Guide Release 5.6.2 Part Number E23609-02 |
|
|
View PDF |
Oracle DataLens Server is built on industry-leading DataLens™ Technology to standardize, match, enrich, and correct product data from different sources and systems. The core DataLens Technology uses patented semantic technology designed from the ground up to tackle the extreme variability typical of product data.
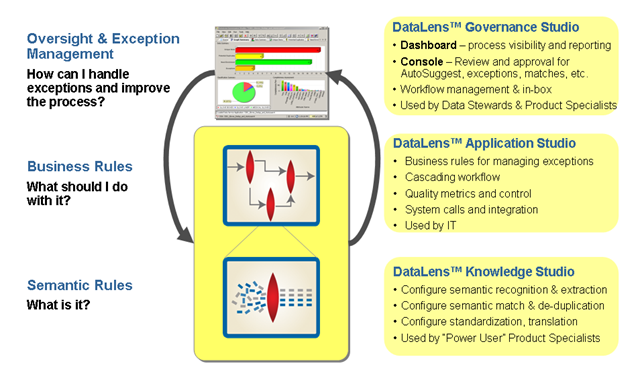
Oracle Enterprise Data Quality for Product Data, formerly known as Oracle Product Data Quality, uses three core DataLens Technology modules: Governance Studio, Knowledge Studio, and Application Studio. The following figure illustrates the process flow of these modules.
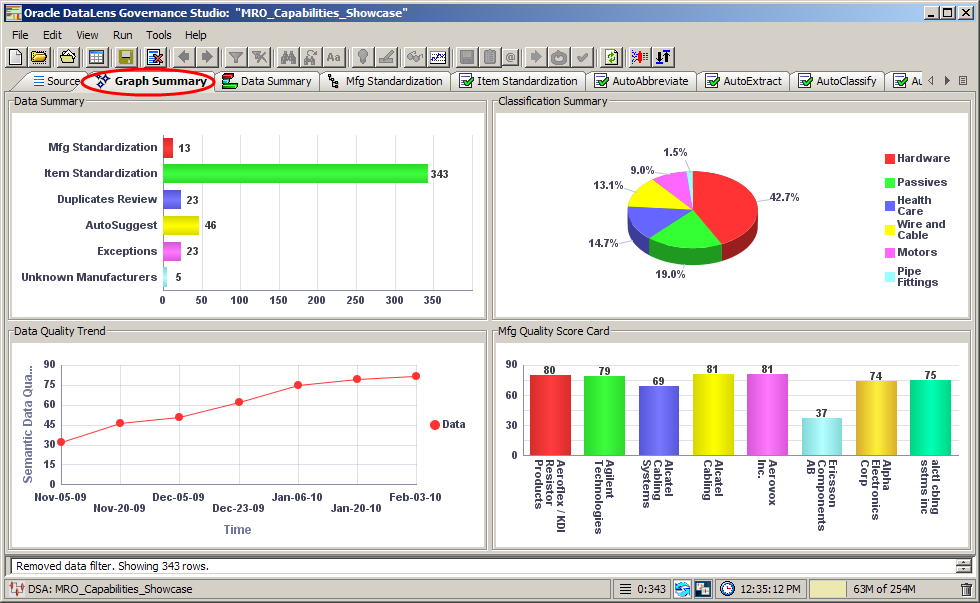
The Enterprise DQ for Product (EDQP) Governance Studio is a reporting and graphing application that streamlines the analysis of results from the Application Studio Data Service Application (DSA) job runs. You can create a Governance Studio project to create reports on data quality, analyze transformed data, email records to coworkers, and output the results to a file. The AutoSuggest feature in the Governance Studio assists you in identifying missing attributes with the click of a button.
The Governance Studio provides a flexible framework for you to design an analysis tool that suits your data interpretation needs. This tool, or project, is entirely dependent on the DSA that you design to process your input data, which must have at least one text output.
This guide explains the features and functionality delivered in the Governance Studio and provides examples of how you might use them to build your own projects. These examples are based on a set of use cases to demonstrate Governance Studio features. Because Governance Studio jobs reflect the underlying DSA, it is possible to create many types of jobs to meet the needs of an individual project.
The Governance Studio offers a convenient and easy-to-use interface for launching jobs, managing processes, reporting results, and analyzing output from Application Studio jobs, as well as analyzing all output data created. You can schedule and run jobs synchronously or asynchronously, generate reports, do trend analysis, and identify missing attributes with ease and report discrepancies to coworkers.
The Governance Studio provides a flexible, user-friendly interface for:
Running DSAs
Outputting DSA results
Manipulating DSA results
Automatically suggesting attributes using AutoSuggest
Saving output data
The benefits of using the Governance Studio are described in the following sections.
Data lens reports can help you meet your business goals. Use a data lens to:
Demonstrate value and benefit (ROI) quickly and effectively.
Enable you to visualize results and readily 'connect the dots'.
The Governance Studio enables highly effective reporting in real time using high quality graphical images that reflect the quality of your data along a set of parameters you define to enable downstream processing effectively or communication about your data.
The Governance Studio graphically enhances results from the output of any DSA template and allows you to create and leverage DSA templates for one-to-one alignment with business processes, such as:
General purpose product data assessment
Attribute extraction
Matching data records between existing and legacy data sources
Proposing alternatives based on search criteria
The Governance Studio leverages Java Web Start to enable you to:
Launch the Governance Studio application from a link on a web page
Update software to the current version automatically
Seamlessly integrate with Windows or Linux operating system (OS)
Leverage DSA database interfaces
You can start Enterprise DQ for Product by using either the desktop shortcut or the Windows Start menu as follows:
Note:
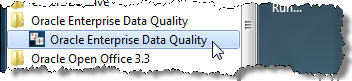
If Enterprise DQ for Product is not installed, you can install it using the instructions in Installing the Client on page 72.Double-click the desktop shortcut.
Click Start, Programs, Oracle Enterprise Data Quality for Product Data, and select Oracle Enterprise Data Quality for Product Data.
The Oracle Enterprise Data Quality for Product Data Login dialog box appears.
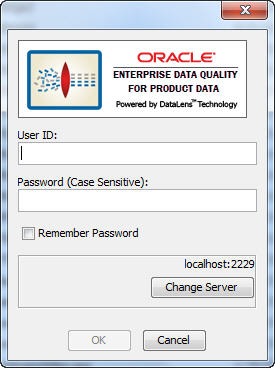
Enter your user name and password . You can avoid entering your password every time you logon by selecting the Remember Password check box.
If you want to change your Oracle DataLens Server or use HTTP Secure (HTTPS), click Change Server. The HTTPS option is only certified to run on an Oracle DataLens Server using WebLogic as the application server.
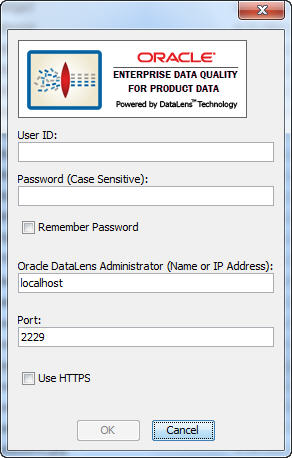
To change your Oracle DataLens Server, enter the hostname or IP Address of your Oracle DataLens Administration Server and its port number.
Note:
When the Oracle DataLens Server is using a WebLogic Application Server, this port number must match the port number of the WebLogic Domain Server.To use HTTPS to contact your Oracle DataLens Server, select the Use HTTPS checkbox.
Note:
Your Oracle DataLens Server (and all other servers in the EDQP topology) must all be configured to use HTTPS. For more information about configuring and using HTTPS, see the Oracle Enterprise Data Quality for Product Data Oracle DataLens Server Administration Guide.When all of the information is correct, click OK.
The Oracle Enterprise Data Quality for Product Data Launch Pad appears.
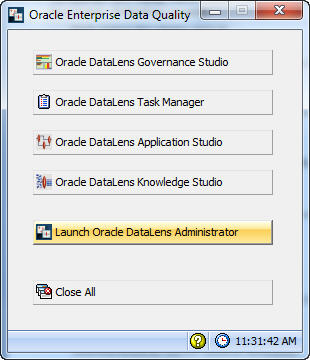
The Oracle Enterprise Data Quality for Product Data Launch Pad allows you to quickly start any of the Oracle DataLens Server applications by clicking on any of the buttons. You can close all open Enterprise DQ for Product applications using the Close All button.
Click the Oracle DataLens Governance Studio button to start the application.
The Governance Studio graphical user interface (GUI) provides the client workspace used to create and manage a data lens.
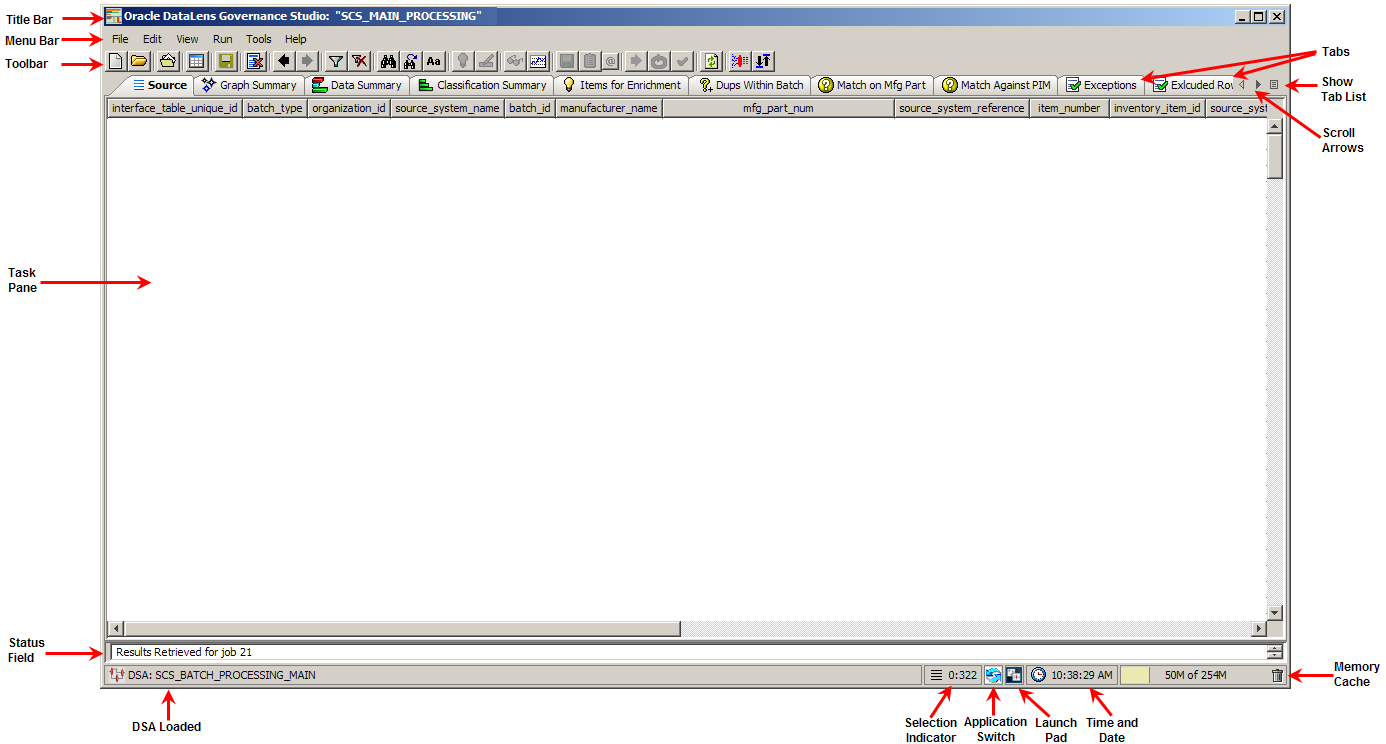
This section describes the following areas of the client workspace:
The Governance Studio client workspace frame contains useful information and interactive functions including the following:
Indicates the current application and open project.
Provides the status of the project one line at a time. Though this field cannot be resized, the scroll arrows on the right-hand side can be used to view all available status information. The status data does not change based on the selected tab; rather it is a compilation of all data.
Indicates the currently loaded DSA that is used for transforming the project data.
Indicates the number of the row currently selected and the total number of rows available for selection.
Returns you to the last Enterprise DQ for Product application used.
This button opens the Oracle Enterprise Data Quality for Product Data Launch Pad so that you can select other applications.
The time is displayed and when you hover over this field.
Indicates the amount of memory cache currently used and the total amount allowed. You can dump the memory cache by clicking on the trash can icon in this interactive field.
Note:
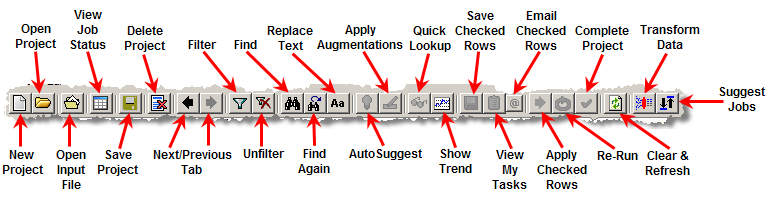
This feature is only used for system diagnosis and should not be used unless requested by the support team.The Governance Studio toolbar allows easy access to the most frequently used Governance Studio functions. Though the set of toolbar buttons remains the same during UI operation the buttons are enabled or disabled based the current state of the interface and the options set. Buttons displayed with shades of gray are disabled. Full-color buttons are enabled. All toolbar buttons are standard push buttons, requiring a single click of the mouse to activate.
The following briefly describes the toolbar buttons from left to right.
The Governance Studio GUI menus provide access to most functions. All of the buttons on the toolbar have a corresponding menu command, which are indicated on each menu with the button icon displaying adjacent to the command. The set of menu commands remains the same during the GUI operation.
Menu commands are enabled or disabled based on the current state of the data lens; commands that are dimmed are unavailable. Some menu commands perform functions that are more complex and are indicated by an ellipsis symbol (...). These commands open dialog boxes to collect information needed to complete the requested function. Menu commands that toggle functions are preceded by check mark (ü).
Tip:
The tooltips appear when you rest your mouse pointer on a menu item, button, tab, icon, or similar content.The following section briefly describes each of the Governance Studio menu commands and corresponding buttons.
| New Project
Creates a new Governance Studio project for building reports about your enterprise data. These project files are stored in one of the following directories:
or
New Project From… Creates a new project using an existing project file as the basis and closes any open project. Open Project Opens an existing project file and closes any open project file. |
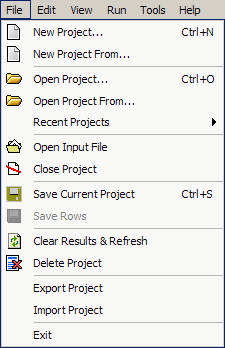 |
| Open Project From…
Opens an existing project file and allows you to rename it using the same base project name with an added unique suffix (for example, V2.) Open Project - No Results Opens an existing project file though does not display data processing results in any Output tabs. This feature allows you to open a project that previously exceeded the maximum memory allocation and so could not complete opening. For more information, see "Opening Projects Without Results". Recent Projects Provides a list of recently opened projects so that you can quickly select a project to open. |
|
| Open Input File
Allows you to select the data file for the current project. For more information, see "Retrieve the Input Data". |
|
| Close Project
Closes the open project file. |
|
| Save Current Project
Saves all project changes to disk. |
|
| Save Rows
Saves only rows that have been checked; does not save selected rows. The checked rows are automatically saved to a Microsoft Excel spreadsheet in the datalens directory where the project resides. The name of the file is based on the name of the tab and is stored in the datalens directory where the project resides. You can change the file name or save location in the dialog provided. All files are saved with the |
|
| Clear Results & Refresh
Allows you to refresh, or remap, a modified DSA to the source data to ensure that all DSA changes are reflected in the current project. If you open your project and do not refresh it, the Governance Studio will prompt you to do so to ensure consistency. |
|
| Delete Project
Deletes the open project. You are no longer able to edit this project although you are no longer able to edit this project, it can be modeled for use as a new project using the New Project From… option. |
|
| Export Project
Exports the project. For more information, see "Exporting and Importing Projects". |
|
| Import Project
Import the project. For more information, see "Exporting and Importing Projects". |
|
| Exit
Exits the Governance Studio application; a prompt is given to save any changes that were made. |
|
| Find
Allows you to specify a search string using a regular expression and attempts to find it. Find Next Repeats the last search defined by a Find operation. |
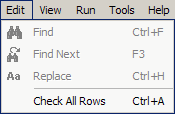 |
| Replace
Allows you to specify a search string and a replacement string, and then attempts to replace the text from the Source tab. |
|
| Check All Rows
Selects all rows in the table on the active tab. Only active when the selected tab contains a table with the Check mark column. |
|
| View Job Status
Allows you to view the status of all jobs. View My Tasks Allows you to view any tasks that are scheduled or have run. For more information, see "View My Tasks". Filter Allows you to filter the displayed data based on text or a text pattern. The filter operation applies only to the currently selected tab. Only the rows that match the text entered in the Filter dialog are displayed in the table. Un-Filter Removes the filter applied to the selected tab, thus displaying all of the data. |
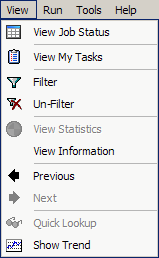 |
| View Statistics
Provides statistical information about the selection. For more information, see "Match Results Tabs". |
|
| View Information
Provides an informational message containing the project name, Transform Server, DSA name, and the location of the data file. |
|
| Previous / Next
The arrow buttons allow you to view alternative definitions for a line item. They operate differently depending on the selected tab. |
|
| Quick Lookup
Allows you to quickly locate and view Ngram matching results. When the associated DSA does not contain Ngram matching, this option is inactive. For more information, see "Applying Quick Lookup". |
|
| Show Trend
Provides a graphical trend analysis of the output data. For more information, see "Trend Analysis". |
|
| Transform Data
Processes the output data in real-time. For more information, see "Running a Governance Studio Project"9. Transform Data with Overrides Allows you to process the output data with settings that you provide at runtime that override those configured in the DSA. You can override the threshold and fuzzy matching settings for Ngram Match or an Attribute Match 2 (associated with Semantic Key 2) processing. When the associated DSA does not contain these matching processes, this option is inactive. Submit Job Processes the output data in the background. For more information, see "Running a Governance Studio Project". |
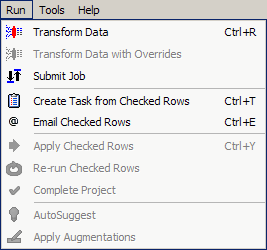 |
| Create Task from Checked Rows
Creates a new job using the selection. For more information, see "Create Task from Checked Rows"7. |
|
| Email Checked Rows
E-mails the selected rows. For more information, see "Emailing Checked Rows" |
|
| Apply Checked Rows
Processes the output data in the rows that you have selected. For more information, see "General Processing". |
|
| Re-Run Checked Rows
Reprocesses the output data in the rows that you have selected. For more information, see "General Processing". |
|
| Complete Project
Closes out a project. For more information, see "Completing Projects". |
|
| AutoSuggest
Obtain data processing suggestions from the Governance Studio. For more information, see "AutoSuggest Feature". |
|
| Apply Augmentations
Add or augment knowledge in the loaded DSA. For more information, see "Apply Augmentations Feature". |
|
| Open Oracle DataLens Task Manager…
Starts the EDQP Task Manager. See the Oracle Enterprise Data Quality for Product Data Task Manager Reference Guide. Open Oracle DataLens Application Studio… Starts the EDQP Application Studio. See the Oracle Enterprise Data Quality for Product Data Application Studio Reference Guide. Open Oracle DataLens Knowledge Studio… Starts the EDQP Knowledge Studio. See the Oracle Enterprise Data Quality for Product Data Knowledge Studio Reference Guide. |
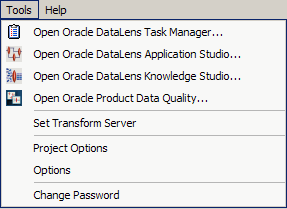 |
| Open Oracle Enterprise Data Quality for Product Data…
Starts the Oracle Enterprise Data Quality for Product Data Launch Pad. |
|
| Set Transform Server
Identifies the Oracle DataLens Server that will be used to transform data. For more information, see "Setting the Transform Server". |
|
| Project Options
Allows you to set options for the open project. For more information, see "Configuring Options". |
|
| Options
Allows you to set options for global use in the Governance Studio. For more information, see "Configuring Options". |
|
| Change Password
Enables you to change your EDQP password. |
|
| Product Guide
Opens a list of Enterprise DQ for Product documents for your selection in a browser. Help About Provides information regarding the product including the version number and a link to view third party product licenses. |
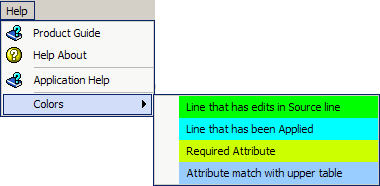 |
| Application Help
Opens the Governance Studio online help in a browser. Colors Describes the colors used in the data tables used in the Governance Studio. |
|
The following table contains keyboard shortcuts that can help make the Governance Studio easier to use.
| Function | Shortcut Key |
|---|---|
| New Project | Ctrl+N |
| Open Project | Ctrl+O |
| Save Project | Ctrl+S |
| Undo | Ctrl+Z |
| Find | Ctrl+F |
| Find Next | F3 |
| Replace | Ctrl+H |
| Check All Rows | Ctrl+A |
| Transform Data | Ctrl+R |
| Create Task from Checked Rows | Ctrl+T |
| Email Rows | Ctrl+E |
| Apply Checked Rows | Ctrl+Y |
A tab groups like information into easy to read and access areas that include graphs, panes, and text entry boxes. Tabs are displayed in the client workspace directly under the toolbar and can be activated in any order. Not all tabs are available at all times. For example, the Output tabs are not active when you create a new Governance Studio project because the output has not yet been generated.
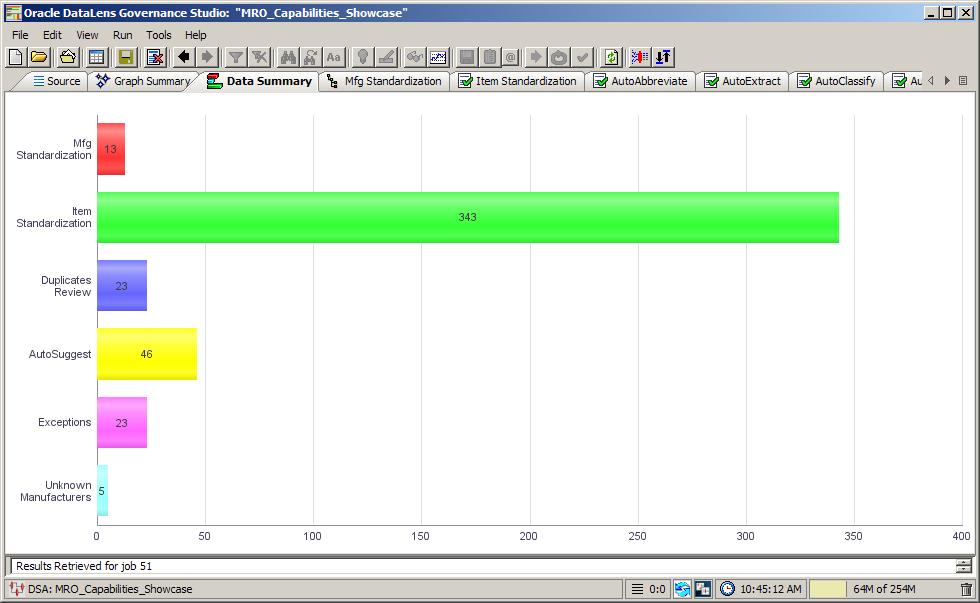
The standard data tabs provide representations of the aggregate quality and productivity metrics for the project. The graphical output tabs are highly configurable, and double-clicking a bar takes you to the underlying output. You can use these tabs to achieve business objectives in a variety of areas:
Manage data quality by source:
Determine quality of the data source
Allow closed-loop governance of sources
Monitor process effectiveness:
Determine how often a process is invoked, how often it is successful
Identify process improvement opportunities
Assess work-queue visibility and productivity metrics by user
The Source tab is created when the Governance Studio project is based on an input file load or on manual input. If the project specifies an external file, or if the underlying DSA is based on database input, or if the project connects to a scheduled job, there is no Source tab.
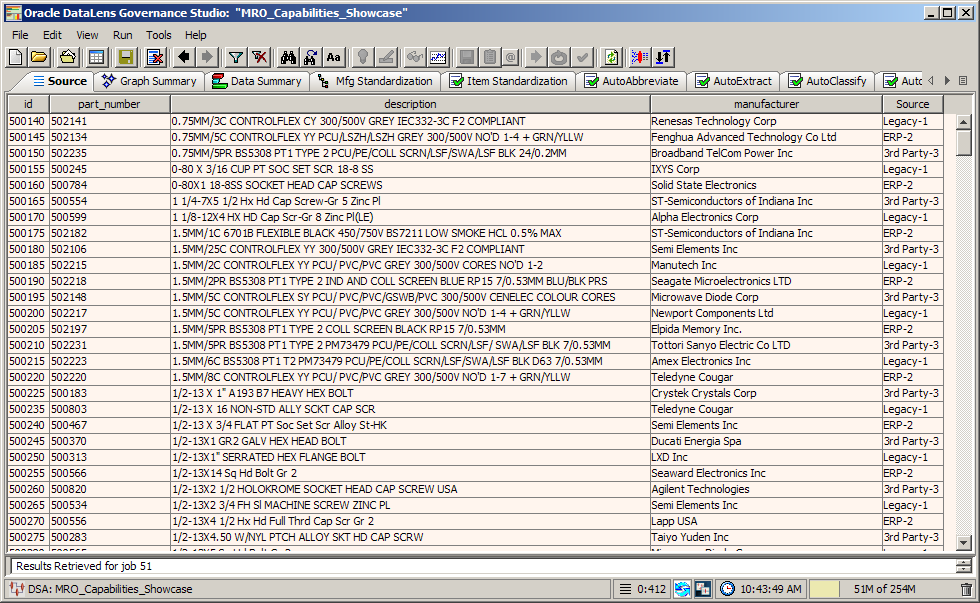
The Output tabs offer item-level validation, approval, edit, and routing. The output is displayed in a single tabular view in the top pane.
There are several types of Governance Studio Output tabs. Each type has different rules governing its creation and different properties that permit you to perform actions on the output each tab displays. Output tabs in the Governance Studio correspond to output steps in your Data Service Application.
The Output tabs provide task-specific User Interfaces (UIs) for any exception process including the following:
Review and approve parsing results
Review and approve potential matches
Reassign low quality items to different workflow/process
Direct edit/update of low quality items
Enables manual intervention while preserving process integrity and efficiency
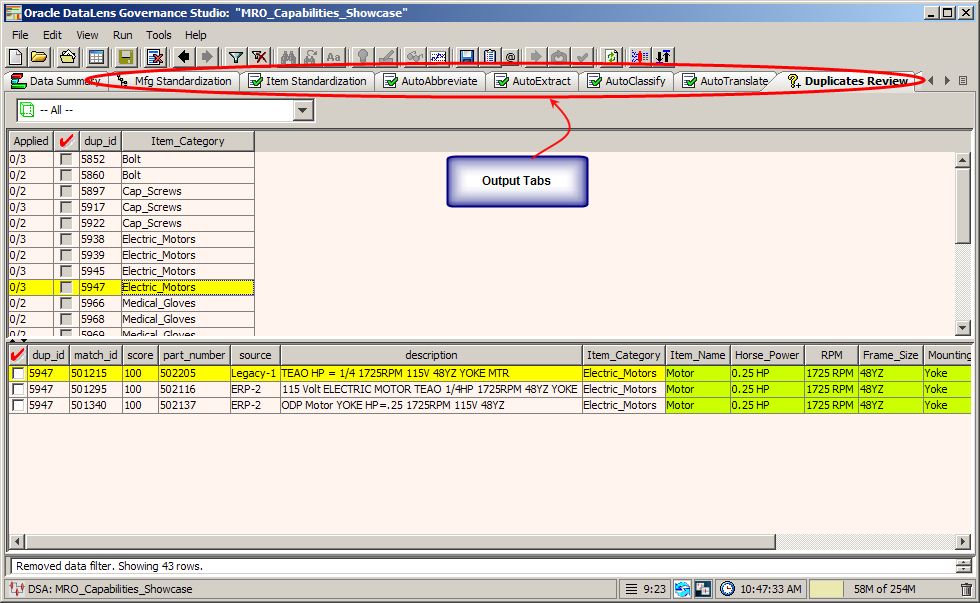
The following is an example of a match selection process, upon the selection of a row, a parent-child relationship view appears in the bottom pane for match results. These split-screen task panes provide you with an easy to use interactive console to perform tasks associated with reviewing and approval or rejecting duplicates, matches, and functional equivalents
For a new project, Output tabs are not initially displayed in the Governance Studio project. After transforming the Source tab data using the Transform button, the Output tabs are displayed. While transforming data or obtaining source data from a database query, the Job-In-Progress icon in the center of the tab shows that the run is in progress.
For an existing job, the Output tab data is recreated with each job run.
If Output tabs already exist, the Governance Studio compares the column headings of the new data with the column headings of the data in all of the existing Output tabs. If there is a data match (the columns are identical), the existing Output tabs are used. Otherwise, the Governance Studio indicates the mismatch with an error message though it automatically creates the associated Output tab.
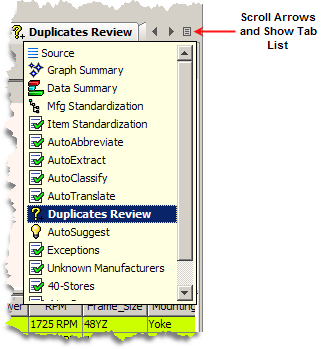
After transforming your project data, one or more Output tabs will appear depending on whether the output steps in your DSA specified Governance Studio output. If there are more Output tabs in the Governance Studio console than can display on one page, you can click the left and right Scroll Arrows at the right to scroll to the right or back to the left. Also, you can click the Show Tab List button as shown in following figure to see a list of Output tabs to select them individually.
The tabs that contain tables in the Governance Studio can be filtered to view specific information thereby reducing the number of rows displayed in a table. To filter your table click the Filter button on the toolbar or from the View menu, select Filter.
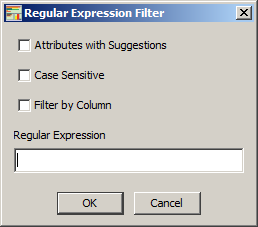
The Attributes with Suggestions checkbox is active when the selected tab is an AutoSuggest output tab (see "AutoSuggest Feature") and allows you to search by suggested data.
If the data that you want to filter with is case sensitive, select the Case Sensitive check box to ensure that proper filtering.
Enter a regular expression or a text string that you want to use to filter your data.
You can filter each column of data by selecting the Filter by Column check box.
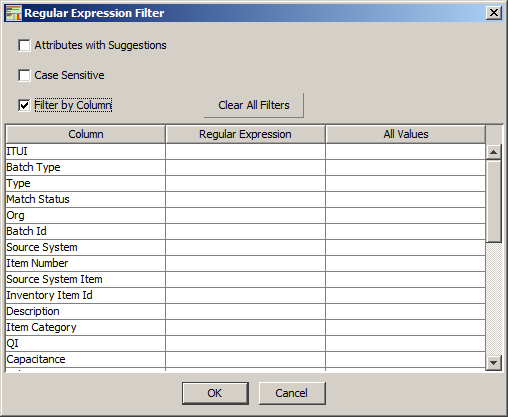
Each column of the selected tab is displayed. You can enter a regular expression for one or more columns or you click in the All Values column to select a filter value from the auto-populated lists. The Regular Expression and All Values columns are mutually exclusive so an entry or selection in one column resets the other column. The values listed in the All Values column are derived from the values currently in the table so repeated filtering will produce fewer selections. This allows you to refine your filtering based on what is visible. If the values you want to filter on do not appear, unfilter your data, and then filter again.
You can quickly clear all filtering entries by clicking the Clear All Filters. To delete individual filtering entries, select the entry and press the Delete key.
The Filter button is colored green when a filter is active so that you can easily identify that all data is not displayed. When you remove the filter, using the Un-Filter button or from the View menu, select Un-Filter, all of the data is displayed.
The Governance Studio includes two interactive task panes: the Governance Console where data is displayed in tabular form similar to a Microsoft Excel spreadsheet and the Governance Dashboard where graphical representations of the output data are displayed.
The small up/down arrows between the panes on the left-hand side, allow you to resize the panes. In addition, you can fully expand either pane to see more data by clicking on an arrow, which makes the pane inactive. To redisplay the inactive pane, click the opposite arrow and the pane reappears.
There are various context-sensitive (shortcut) menus that appear in the Governance Studio panes when you right-click on data within a pane. The contents of these menus are described throughout this reference.
|
Copyright © 2001, 2011, Oracle and/or its affiliates. All rights reserved. Legal Notices |
|