| Oracle® Argus Safety User's Guide Release 6.0.1 E15952-03 |
|
|
PDF · Mobi · ePub |
| Oracle® Argus Safety User's Guide Release 6.0.1 E15952-03 |
|
|
PDF · Mobi · ePub |
This chapter describes the dashboards in the Argus Safety application.
Dashboards option is available on the menu bar. Place the cursor over Dashboards in the menu bar to view the options available in it.
The following is list of available dashboard options.
Open Case Summary Reports
Open Action Items Reports
Quick Signal Reports
Increased Frequency Reports
Expedited Report Status
Workflow Status
Reports Due Soon
Personal Argus Status
Case Workload
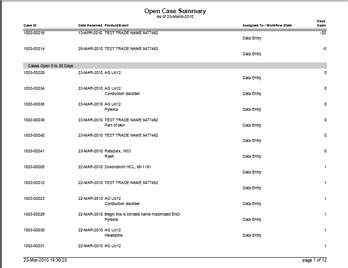
The Open Case Summary Report displays a summary of all open cases sorted in ascending order according to the number of days the case has been open.
To view the Open Case Summary Report
Select Dashboards --> Open Case Summary.
The system displays the Open Case Summary Report in PDF format.
When using the Open Case Summary Report, be aware of the following:
The Date Received column prints the initial receipt date or the latest follow-up date for the case.
If there are no follow-ups for a case, the system calculates open cases based on the initial receipt date.
If there are follow-ups for a case, the system calculates the days open based on the most recent follow-up in the case. If the latest follow-up date is older than the previous follow-up, it considers only the last follow-up.
The system also calculates days open based on the latest follow-up date for the case.
The following table lists and describes each field in the Open Case Summary Report
| Field | Description |
|---|---|
| As of (date) | Displays the report as per the current date (in dd-mmm-yyyy format). |
| Case ID | Displays the Case ID of each listed case. |
| Date Received | Displays the date when the case was received. |
| Product | Displays the Product Name. |
| Event | Displays the Event Info/Preferred Term. |
| Assigned To | Displays the Workflow/Case Owner. |
| Days Open | Displays the number of days since the initial receipt date. |
| Status | Displays the Case Status. |
| Total Cases | Displayed at the end of the report, it shows the total number of cases listed in this Open Case Summary Report. |
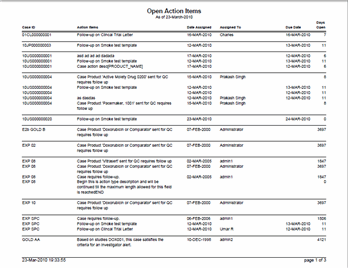
The Open Action Items Report displays all outstanding action items. This report is sorted as per the Case ID of the listed cases.
To view the Open Action Items Report
Select Dashboards --> Open Action Items.
The system displays the Open Action Items Report in PDF format as shown in the following illustration.
The following tables lists and describes the fields in the Open Action Items Report.
| Field | Description |
|---|---|
| As of (date) | Displays the report as per the current date (in dd-mmm-yyyy format) |
| Case ID | Displays the Case ID of each listed case. |
| Action Item | Lists the status of the case and the action that needs to be taken. |
| Date Assigned | Displays the date when the case was opened/assigned. |
| Assigned To | Displays the Workflow/Case Owner. |
| Date Due | Displays the date when the action item was due. |
| Days Open | Displays the number of days that have lapsed since the date when the case was opened. |
The Quick Signal Report displays the changes in numbers of events over the past year. This report is a summary listing of events, which have triggered signals.
Click the following link for information about the information in the fields on the report.
The following table lists and describes the fields in the Quick Signal Report.
| Field | Description |
|---|---|
| Product | Displays the Product Name. |
| As of | Displays the report as per the current date (in dd-mmm-yyyy format). |
| Term | Displays the Event Information in alphabetical order Body system and sort them within the body system in descending order. |
| Last 6 Months (Selected Drug) | Displays the number of cases received in the past 6 months for the selected drug. |
| All Cases (Selected Drug) | Displays the total number of cases recorded for the selected drug. |
| Last 6 Months (All Products) | Displays the number of cases received in the past 6 months for all the drugs. |
| All Cases (All Products) | Displays the total number of cases for all the drugs. |
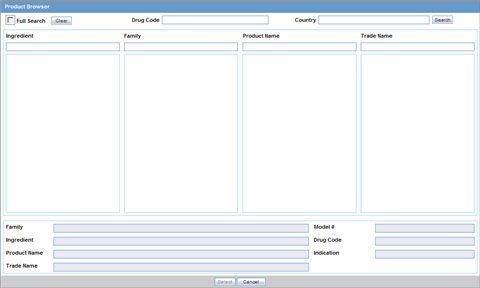
To enter information in the Product Browser
1. Select Quick Signal Report from Dashboards.
2. This displays the Product Browser dialog.
To search through the Product Browser dialog
Click the entities being displayed in the dialog.
The hierarchy above and below the entity being searched is also displayed. For example, if Product Name is searched, it displays the Product Name as well as the Family Name and Trade Name.
Search for Products based on the following criteria:
Ingredient - Displays the ingredients of the product
Family - Displays the family of the product
Product Name - Displays the Formulation (Dosage Form), Concentration (Strength) and Indication to aid in the selection of the correct product.
Trade Name - Searches the License Trade Name, Country fields.
When the system displays the results, select the appropriate Product.
Click Select to view the Quick Signal Report that matches the entered criteria.
The system enables you to recall a previously memorized case listing or case data analysis report for printing. In addition to the reports for a specific user, the system displays a list of reports whare are shared by all users.
You can select a memorized report from the dialog box. When you select the report, the system enables the Open button to permit you to open the selected memorized report. Click Cancel to close the dialog box. Click Delete to delte the selected ememorized report.
To memorize a configured report, click the Memorize button on the configuration dialog box for the Case Listing or Case Data Analysis report.The system opens the Memorized Report .
The system enables you to save the memorized report, make it available for , and Share the report with other users.
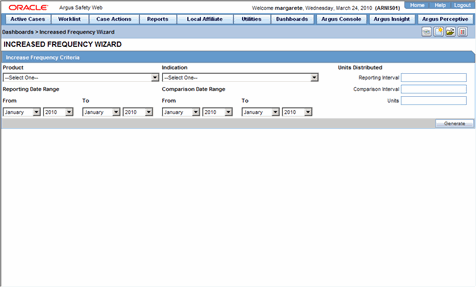
The Increased Frequency Report displays events that have occurred at increased frequency for a given product and indication, based on a FDA formula (modified t-test).
To generate an Increased Frequency Report
Select Dashboards --> Increased Frequency.
When the system opens the Increased Frequency Wizard, enter the appropriate information in the fields and click Generate.
Increased Frequency Criteria Fields and Field Descriptions
The following table lists and describes the fields in the Increased Frequency Criteria section.
| Field | Description |
|---|---|
| Product | Allows the user to select the product on which this report is to be based. |
| Indication | Allows the user to select an indication for this product. |
| Reporting Date Range From Date | Defines the starting date. |
| Reporting Date Range To Date | Defines the ending date. |
| Comparison Date Range From Date | Defines the starting date for the comparison period. |
| Comparison Date Range To Date | Defines the ending date for the comparison period. |
| Units Distributed in Reporting Interval | Allows the user to adjust the number of units distributed in the reporting interval. |
| Units Distributed in Comparison Interval | Allows the user to adjust the number of units distributed in the comparison interval. |
| Units | Allows the user to adjust the unit term as appropriate. |
| Generate button | Generates the Increase Frequency Report. |
The following table lists and describes the information that appears in the Increased Frequency Report.
| Field | Description |
|---|---|
| Adverse Event | Displays the name of the adverse event. |
| Number of Adverse Events | Displays the number of adverse events. |
The Increased Frequency Wizard enables you to determine which events have occurred at increased frequency for a given product and indication based on an FDA formula (modified t-test).Select Utilities --> Increased Frequency Wizard to open the Increased Frequency Wizard dialog box shown in the following illustration.

The following table lists and describes the fields on the Increased Frequency Wizard dialog box.
| Field/lControl Name | Description |
|---|---|
| Product | Enables you to select the product on which this report is to be based. |
| Indication | Enables you to select an indication for the product |
| Reporting Date Range From | Enables you to define the starting date. |
| Reporting Date Range To | Enables you to define the ending date. |
| Comparison Date Range From Date | Enables you to define the starting date for the comparison period. |
| Comparison Date Range To DAte | Enables you to define the ending date for the comparison period. |
| Units Distributed in Reporting Interval | Enables you to adjust the number of units distributed during the reporting interval. |
| Units Distributied in Comparison Interval | Enables you to adjust the number of units distributed during the comparison interval. |
| Units | Enables you to adjust the unit term as appropriate. |
| Generate | Click Generate to generated the Increase Frequency Report. |
The Expedited Reporting Status page enables you to search for and field information about the status of expedited reports. Expedited Reporting Status also appears on the Worklist Group menu. Additionally, if you have access to Expedited Report Status, you wil also have access to the Report Due Soon dashboard. The following is an illustration of the Expedited Report Status screen.
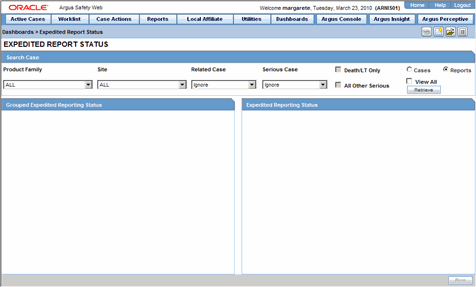
Select Dashboards --> Expedited Report Status to open the Expedited Reporting Status screen.
When the system opens the Expedited Report Status screen, enter the appropriate information in the fields in the Search Case section and click Retrieve.
he system creates the report based on the search criteria you entered.
The Expedited Report Status screen contains the sections mentioned below:
Search Case
Grouped Expedited Reporting Status
Expedited Reporting Status
This section enables you to enter the search parameters for the report
![]()
The following table lists and describes the fields
| Field | Description |
|---|---|
| Product Family | Allows the user to select which Product Family to be included in the dashboard. |
| Site | Allows the user to filter the workflow statuses to the selected site. |
| Serious Case | Displays if the case is serious or not.
If Yes is selected, the seriousness criteria are enabled. Note: A case that does not have a seriousness specified (i.e. blank) is treated as serious. |
| Related Case | Filters on the relatedness of the case. A case is only included if it meets the relatedness criterion. |
| Death/LT Only | Select this option to include any case that has any of the Fatal or Life-Threatening seriousness criteria. |
| All Other Serious | If this seriousness criterion is checked, the case only gets included if any of the following seriousness criteria of any event are checked: Hospitalized, Disability, Congenital Anomaly, Medically Significant, Intervention Required or Other. |
| Cases | Enables you to search for cases. |
| Reports | Enables you to search for reports. |
| View All | Enables you to view all. |
| Retrieve | Prints the currently selected dashboard, including filter criteria. |
You can view the Workflow Status based on case owner, site, case seriousness, and other criteria. The following is an illustration of the Workflow Status screen.
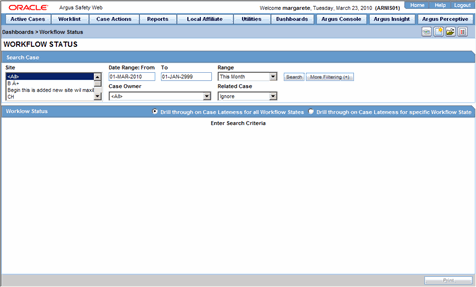
Select Dashboards --> Workflow Status to open the Workflow Status Screen.
When the system opens the Workflow Status screen, enter the appropriate data in the Search Case fields and click Search.
The system displays the Workflow Status information.
When using the Workflow Status screen, be aware of the following:
Workflow Status appears on the Worklist Group menu.
You can:
Click on a bar graph and select from a dashboard menu to open the list of cases in the Workflow Status Dashboards.
Click on the graphical bars to drill down on the specific workflow state details.
If no updates are made to cases during case processing, the cases the system displays the number of cases you clicked during the drill down.
If one or more cases change workflow state between loading the dashboard screen and loading the worklist-specific screen, a discrepancy in case numbers may occur.
The system maintains user preferences once you return to the Workflow Status Dashboard.
By default, the system displays only the first filtering results and makes other filters available when you click More Filtering.
Worklist Status. This screen provides filtering capabilities by site, workflow state, product family, date range, advanced condition, serious or non-serious, study or non-study by clicking the More Filtering option. The More Filtering options also hide additional filtering elements.
Site Filter. The Site Filter is a multiple selection screen that enables you to use the CTRL and Shift keys to select multiple sites. The default value is All Product Family. When you use the site filter, the system displays all active (undeleted) sites in the Argus Code List. However, the system does not display LAM sites.
Workflow State Filter. The Workflow State filter is a multiple selection screen. You can select use the CRTL and Shift keys to select multiple groups.
The system displays all active (undeleted) workflow states, except archived/closed, in the Argus Utilities - Configuration.
The default selected value is <All>Product Family.
The Product Family filter is a type ahead field.
The default selection on the type ahead is blank (no filtering on Product Family). By default, the system displays a maximum of 25 rows.
The system displays all active (undeleted) product families configured in the Argus Code List Product & Family in the Product Family Filter results.
Date Range Filter. In this module, the Date Range function works in the same manner as it does in other parts of the application.
The default value for range is last month.
The system automatically populates the values in the From and To fields with the dates based on the This Month option.
The date fields functions as they do in other parts of the application.
The system evaluates Aware Date to fall in between the date range specified in the Date Range filter.
Advanced Condition Filter.The Advanced Condition functions as it does in other part of the application.
Serious or Non-Serious Filter. Five (5) sub-filtering options are available.
All
This is the default option. When you select this option, the report returns all cases whether serious or non-serious.
Serious
When you select this option, the system returns only those cases that are serious. The system evaluates seriousness at the event level. If any event is serious, the system considers the case serious and returns it in the results.
Non-Serious
When you select this option, the report returns only non-serious cases. All the events must be non-serious before the system returns the case in the search results.
Death/LT Only
When you select this option, the report returns cases that have an event where Death or Life Threatening is checked. The system disables this check box when you select the non-serious option.
Serious other than death or life-threateningFilter.
When you select this option, the report returns only those cases that have an event with a seriousness criteria other than Death or Life Threatening.The system disables this check box when you select the Non-Serious option.
Report Type Filter. The Report Type filter is a multi-selection screen that enables you use the CTRL and Shift keys to select multiple items. The default value is All.
Project ID Filter. The Project ID filter is a multi-selection screen that enables you to use the CTRL and Shift keys to select multiple items. The default value is All. All active Project ID values are configured in the Argus Utilities Protocol ID Code List.
Default Report Configuration Filter. When no other filters are used, the default report configuration returns all cases for the current month. The system uses the case Aware Date for evaluation purposes.
Search Filter. When you click Search, the system displays the Workflow Status screen.
When you click the Bar Graph, the system displays a menu. You can select Late, Over Normal, Normal or All to go to the worklist-specific screen. When you double-clicks the bar, the system displays the worklist-specific screen.
Print. When you click Print, the system uses the standard Argus Print function to print the search results. This is the same as CDA print functionality.
The Workflow Status screen includes the following sections:
Search Case
Workflow Status
The Search Case section enables you to enter appropriate search criteria to search for workflow information.

The following table lists and describes the fields in the Search Case section.
| Field | Description |
|---|---|
| Site | Allows the user to filter the workflow statuses to the selected site. |
| Date Range From/To | Enables you to filter workflow status based on a specific date range |
| Range | Enables you to filter workflow status based on a pre-define date range (e.g., last 30 days, etc.) |
| Case Owner | Enables you to filter the workflow status based on the case owner. |
| Related Case | Filters on the relatedness of the case. A case is only included if it meets the relatedness criterion. |
| Search | Click Search to search for the workflow status. |
| More Filtering | Click More Filter to display more filtering options on the More Filtering section |
| Prints the currently selected dashboard, including filter criteria. |
The More Filtering section provides additional criteria for filtering cases. The following is an illustration of the More Filtering section.

The following table lists and describes the fields in the More Filtering section.
| Field | Description |
|---|---|
| Workflow State | Enables you to filter the workflow status based on workflow state (e.g., data entry, medical review, etc.) |
| Report Type | Enables you to filter the workflow status based on the report type. |
| Project ID | Enables you to filter the workflow status based on the Project ID. |
| Serious or Non-Serious | Enables you to filter workflow status based on the Serious/Non-serious criteria as follows:
|
| Product Family | Search for workflow status based on product family. |
| Advanced Condition | Search for workflow status based on a selected advanced condition |
| AC | Enables you to create an Advanced Condition. |
| Prints the currently selected dashboard, including filter criteria. |
As report scheduling is commonly configured to be executed when significant changes are made to a case, it is possible that expedited reports may be delayed if a case never gets locked. You cannot know that a report is late if it has never been scheduled. In order to address this potential compliance issue Argus Safety assesses case reportability prior to formal report scheduling. Workflow and Expedited Status monitoring screens identify unlocked cases due soon.
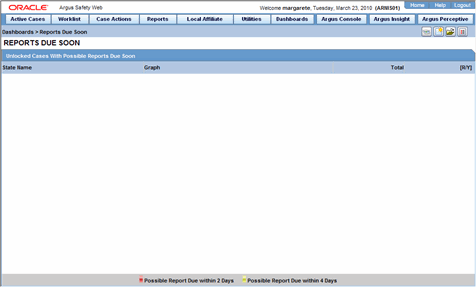
To view a list of unlocked cases with reports due
Select Dashboards --> Reports Due Soon from Dashboards.
The system opens the Unlocked Cases with Possible Reports Due Soon screen is displayed.
The Workflow and Expedited status include another report with cases that have not had reports scheduled but that may generate a report with a due date in the near future. This graph is displayed below the graph detailing the actual case status.The reports included in this sub-dashboard are limited to the filter criteria specified for the main dashboard
The following table lists and describes the fields on the Reports Due Soon screen.
| Field | Description |
|---|---|
| State Name | Displays the workflow state of each listed case is. |
| Graph | Red bars indicate that the report is likely to be due within the next 5 days.
Yellow bars indicate that the report is likely to be due in the next 10 days. |
| Total | Displays the number of cases within the displayed workflow state. |
| R/Y | Number of cases in Red/Yellow |
Click the graphical bar to view a Worklist with cases of the selected state (red or yellow).
The Personal Argus Status screen of the Argus Safety application displays a list of Cases Assigned, Contact Log Entries and Action Item Entries sections that are specific to the logged-in user. The following is an illustration of the Personal Argus Status screen.
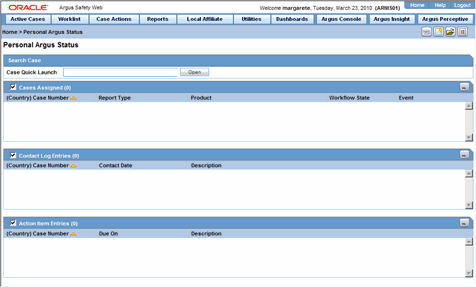
To view the Personal Argus Status screen
Select Dashboards --> Personal Argus Status.
The system opens the Personal Argus Status screen
Use the following procedure to search for a specific case.
Type the case number in the Case Quick Launch field of the Home page and click Open.
Click the link displaying a case number to view the case details.
By default, each section and header column is sorted by Case Number in ascending order.
Select the check box for any of the headers to enable that section.
The sections in which the check box is not selected are displayed at the bottom of the screen.
The system displays the Workflow status for displayed cases in the Cases Assigned section. You can right-click on the case row and select the Accept option. This moves the cases to their Worklist Open list.
The following table describes the fields in the Cases Assigned section:
| Field | Description |
|---|---|
| Country (Case Number) | Displays the name of the country to which the case belongs, with the Case Number listed in brackets. |
| Report Type | Displays the report type of the case. |
| Product | Displays the product name. |
| Event | Displays the event name |
The following table describes the fields in the Contact Log Entries section:
| Field | Description |
|---|---|
| Country (Case Number) | Displays the name of the country to which the case belongs, with the Case Number listed in brackets. |
| Contact Date | Displays the contact date |
| Description | Displays the description of the case |
The following table below describes the fields in the Action Items Entries section:
| Field | Description |
|---|---|
| Country (Case Number) | Displays the name of the country to which the case belongs, with the Case Number listed in brackets. |
| Due On | Displays the date when the case is due. |
| Description | Displays a description of the case. |
The Case Workload feature enables an administrator to view the case workload for individuals and one or more sites. The Case Workload feature is available for only Workflow Managers. For example, if a user belongs to a group which has access to this menu option but is not a Workflow Manager, this option will not be displayed.
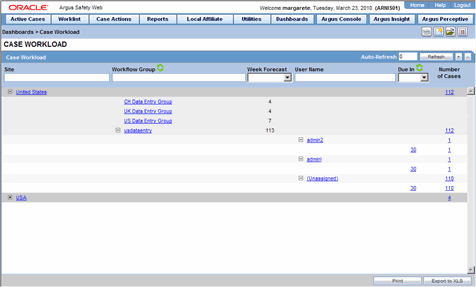
To view case workload information
Select Dashboards --> Case Workload.
The system opens the Case Workload screen.
The following table lists and describes the fields in th Case Workload screen.
| Field | Description |
|---|---|
| Site | Enables you to view the Cases part of the site.
Displays the specific Worklist where the user can view the case numbers. Click + to view the next level and expand either the Workflow State or Workflow Group. |
| Workflow State | Enables you to view the Workflow State of the Cases part of the site.
Displays the specific Worklist where the user can view the case numbers. Click + to view the next level and expand to User Name. Click the Header to toggle between Workflow Group or Workflow States. |
| Workflow Group | Displays the Workflow Group of the Cases part of the site.
Displays the specific Worklist where the user can view the case numbers. Click the Header to toggle between Workflow Group or Workflow States. Click + to view the next level and expand to User Name. |
| Week Forecast | Enables the user to view the number of cases projected in the next 5 days for the current workflow state or group.
If a case is routed to multiple workflow states/groups, it is counted multiple times within the Week Forecast. The Projected Week Forecast is based on the Dynamic Workflow calculation for the entire case, as per the configuration settings. |
| User Name | Enables you to view the User Name to whom the cases are assigned.
Displays the specific Worklist where the user can view the case numbers. Click + to view the next level and expand to Priority. Online Users can view the Online icon and their User Names appear in bold. |
| Priority | Enables you to view the Priority of the Cases part of the User.
Click the link to view the specific Worklist where the user can view the case numbers. |
| Due In | Enables you to view the Due In of the Cases part of the User.
Displays the specific Worklist where the user can view the case numbers. Due In is based on the Days remaining field, similar to the Worklist | New dialog. |
| # of Cases | Enables you to view the Total number of the Cases for the row entity.
Click the link to view the specific Worklist where the user can view the case numbers. |
| Refresh | Enables you to only refresh the number and the entities but not the entire page.
Enter a value in the text field for Auto-Refresh automatically refresh the dialog every N minutes up to a maximum of 99 minutes. |
| Expand All (+) | Enables you to expand all entities across the Summary Tabulation. |
| Collapse All (|) | Enables you to collapse all entities across the Summary Tabulation, leaving only the Sites Total. |
| Enables you to print the Load Balancing Dashboard in PDF format. | |
| Export to XLS | Enables you to export the Load Balancing Dashboard in Excel format. |