8 Working with the Client/Server Page
This chapter describes the TimesTen database client/server page. The TimesTen database client/server page conveys performance information about your TimesTen client/server connection.
Topics include:
Viewing the client/server page
To view the client/server summary page, ensure that you are on the TimesTen database target page. For information on navigating to the TimesTen database target page, see "Navigating to the TimesTen target page".
From the TimesTen Database Home menu, select Monitoring, then select Client/Server Summary.
The TimesTen database client/server summary page displays.
Analyzing information on the TimesTen client/server page
Figure 8-1 shows the three client/server specific tab that have been customized for your TimesTen database targets. Click a specific tab to view detailed client/server information.
A description of each area follows:
Server Workload
The server workload tab enables you to view information about server workload. The server workload tab contains three graph regions:
Write rates
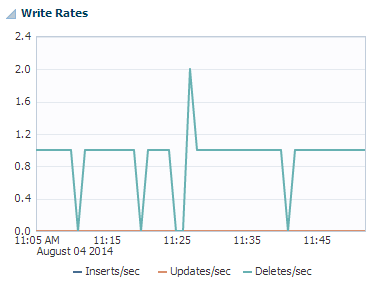
The write rates region uses a line graph to show the rate of INSERT, UPDATE, and DELETE operations executed on rows per second on the TimesTen server.
The write rates region is populated when the TimesTen database is enabled to collect all database and operating system statistics. To enable TimesTen to collect all database and operating system statistics, call the ttStatsConfig built-in procedure with the StatsLevel parameter set to ALL.
Command> call ttStatsConfig('StatsLevel','ALL');< STATSLEVEL, ALL >1 row found.
For more information about the ttStatsConfig built-in procedure, see "ttStatsConfig" in the Oracle TimesTen In-Memory Database Reference.
Read rates
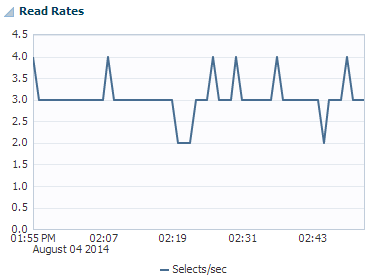
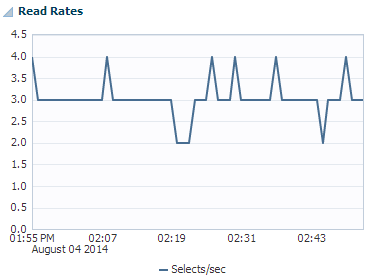
The read rates region uses a line graph to show the rate of SELECT operations executed on rows per second on the TimesTen server.
The read rates region is populated when the TimesTen database is enabled to collect all database and operating system statistics. To enable TimesTen to collect all database and operating system statistics, execute the ttStatsConfig built-in procedure with the StatsLevel parameter set to ALL.
Command> call ttStatsConfig('StatsLevel','ALL');< STATSLEVEL, ALL >1 row found.
For more information about the ttStatsConfig built-in procedure, see "ttStatsConfig" in the Oracle TimesTen In-Memory Database Reference.
Commits and rollbacks
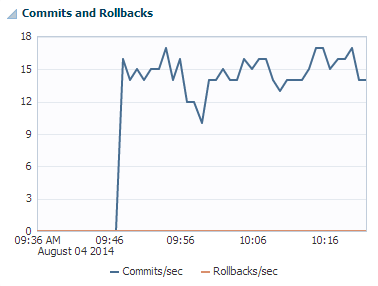
The commits and rollbacks region uses a line graph to show the rate of COMMIT and ROLLBACK statements executed per second on the TimesTen server.
Statements
The statements tab enables you to view information about the read and write rates of your SQL statements. The statements tab contains two graph regions:
Write rates
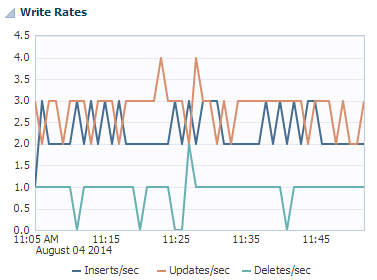
The write rates region uses a line graph to show the rate of INSERT, UPDATE, and DELETE operations executed per second on the TimesTen server.
Read rates
The read rates region uses a line graph to show the rate of SELECT operations executed per second on the TimesTen server.
Network usage
The network usage tab enables you to view information about client/server network usage. The network usage tab contains two graph regions:
Network round trips
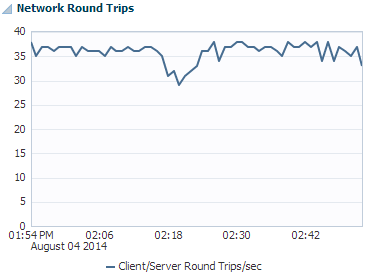
The network round trips region uses a line graph to show the client/server round trips per second.
Bytes sent and received
Figure 8-8 Bytes Sent and Received region
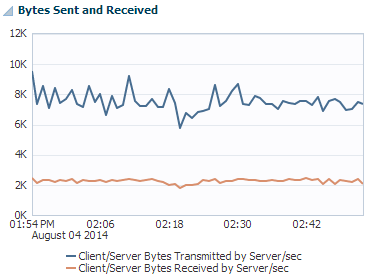
Description of "Figure 8-8 Bytes Sent and Received region"
The bytes sent and received region uses a line graph to show the number of bytes sent and received by the TimesTen server per second.

