34 Building a Ranking Report
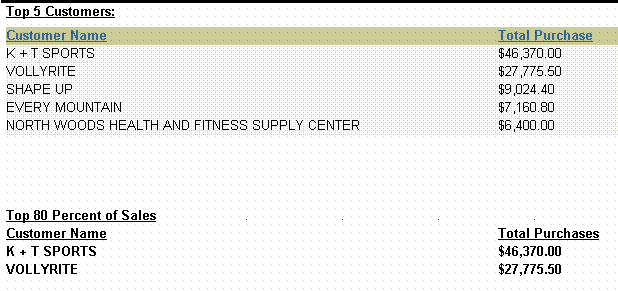
In this chapter, you will learn about reports that rank data in different way. By following the steps in this chapter, you can generate the report output shown in Figure 34-1.
Figure 34-1 Tabular report output, ranked by number and percentage of customers

Description of "Figure 34-1 Tabular report output, ranked by number and percentage of customers"
You can create a report that ranks data by comparing it to a user-specified bind parameter. This enables you to rank data in different ways in the same report; for example, by count and by percentage. You can set the ranking criteria at runtime, or let them default to previously specified values.
This report requires one query to fetch the data. To rank the data, you'll create the following objects:
-
A bind parameter that gives you the option of setting the cutoff point at runtime.
-
A bind parameter that increments by one each time a record is fetched from the database. The value in this parameter will be compared to the cutoff Bind parameter.
-
A customized group filter to include only records within the cutoff value. Using a customized filter rather than a packaged filter enables you to parameterize your cutoff values.
This report uses a tabular layout style, with some modifications.
In this example, you will create a report that displays the names and total purchases of your top three customers and the top 75% of all customers. Furthermore, you will allow end users of your report to set the ranking criteria (that is, the top x customers and the top y% of all customers) at runtime.
As you build this example report, you will:
-
Create Ranking Logic for Top number of Customers by creating parameters and a group filter to control the ranking criteria.
-
Add a Layout Object for a Parameter to display the parameter value in the report output.
-
Create a Parameter Form that only displays the parameter you want end users to set.
To see a sample ranking report, open the examples folder named ranking, then open the Oracle Reports example named rank.rdf. For details on how to access it, see "Accessing the Example Reports" in the Preface.