5 Manipulating Data in Views
This chapter explains how to apply filters, top N data, drilling, calculations, and surface prompts when creating or modifying views in Oracle Business Activity Monitoring (Oracle BAM) Active Studio.
This chapter contains the following topics:
5.1 Filtering Data
You can add data filters to all types of views.
A simple example filter is Sales is greater than 12000. When this filter is applied to data, only Sales larger than 12000 display in the view. Sales less than this amount are omitted.
You can also create more complex filters that include dependencies on other lines in the filter.
By adding a combination of entries and headers, you can create a hierarchy in the filter.
The Active Now feature in data filtering enables you to display in your views a segment of the data that is always within a defined time window. See Section 5.1.1, "Using Active Now" for more information.
-
Click the Data button in the View Editor.

Description of the illustration bam_ve_icon_data.gif
To open the View Editor, double-click the view you are editing, or click Edit view in the View Tasks/Options list.
-
Click the Filter tab.

Description of the illustration bam_ve_filter.gif
Because no filters have been added, only the default filter header is displayed.
-
Click Add new entry.

Description of the illustration bam_ve_filter_add.gif
A filter form opens.
-
Choose a field from the Field list.

Description of the illustration bam_ve_filter_exp.gif
Note:
Calculated fields created on external data objects are not supported in filters. If a calculated field is created on any field of an external data object, do not use those it in the filter expression.
-
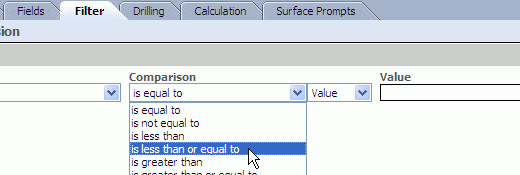
Choose an expression from the Comparison list.
Description of the illustration bam_ve_filter_comp.gif
See Appendix B, "Filter Comparison Expressions," for more information about each comparison expression.
-
Choose Value, Field, or Formula from the next list.
If you select Value, choose from the following options:
-
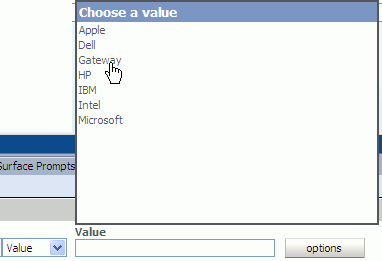
For string fields, click Options and select Browse to see a list of values.

Description of the illustration bam_filter_val_str_browse.gif

Description of the illustration bam_filter_val_str_browse2.gif
Description of the illustration bam_filter_val_str_browse3.gif
Select a value from the list. Up to 50 values display in the list. The Value field can be left blank to create a filter on a blank string.
Note:
If there are more than 50 values in the field, not all of the values are shown in the Browse list. Your Oracle Business Activity Monitoring administrator can configure the number of rows to display in the list.
See
RecordsLimitForValueBrowserin "Oracle BAM Configuration Property Reference" in Oracle Fusion Middleware Administrator's Guide for Oracle SOA Suite and Oracle Business Process Management Suite for more information. -
For numeric fields, enter a number in the Value field.

Description of the illustration bam_filter_value_num.gif
-
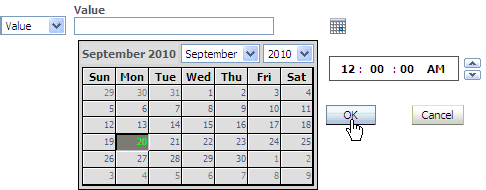
For datetime fields, click the calendar button, and select a date in the calendar and a time on the clock. Then click OK.
Description of the illustration bam_filter_value_date.gif
If you want to compare only date values without considering the time of day, select the Compare Date Only checkbox located under the Value field. The complete date and time must remain in the filter expression, however, so do not remove it from the Value field.

Description of the illustration bam_filter_val_dateonly.gif
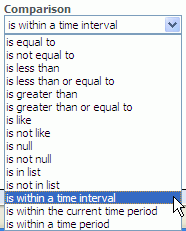
If you selected is within a time interval, is within the current time period, or is within a time period, configure the time period using the lists.
Week is based on a Sunday through Saturday week, Quarter is based on the typical fiscal year January through December with Q1 starting January 1, and year is based on a January through December year.
Select Active Now to keep the displayed time interval current as time passes. See "Using Active Now" for more information.
-
For lists (when is in list Comparison is used), click Edit, and then create the list.
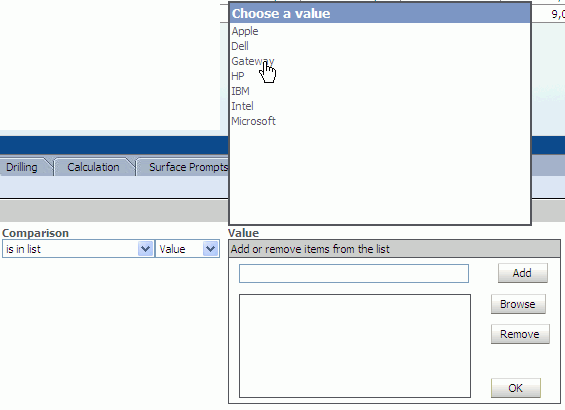
Description of the illustration bam_filter_value_list.gif
You can by entering the values in the field and click Add, or you can click Browse and choose the data object field values (as shown in the graphic).
Select unwanted values and click Remove to remove them from the list.
Click OK to finish.
-
To set the value to the value of a prompt or parameter, click Options and select an existing prompt or parameter.

Description of the illustration bam_filter_param.gif
Only prompts and parameters that have the same data type as the selected field in the filter are displayed in the list.
You can select *New Parameter/Prompt to create a prompt or parameter to use in this filter. See Chapter 8, "Using Prompts and Parameters" for more information about creating prompts and parameters.
If you select Field, select a field in the Field list to compare with the first field in the filter expression.

Description of the illustration bam_filter_field.gif
If you select Formula, enter an expression in the Formula field to compare with the first field.
For example, if you create a list view using the sample Call Center data object and create a filter with the following attributes:
-
Field: Total
-
Comparison: is equal to
-
Formula: Quantity*2

Description of the illustration bam_filter_formula.gif
This filter yields only those rows where the value in the Total column equals twice the value in the Quantity column.
-
-
Click Add Entry to add the entry to the filter expression.

Description of the illustration bam_filter_addentry.gif
The entry is added under the top-level header.

Description of the illustration bam_filter_entry.gif
Add combinations of entries and header to create complex filters. Select a different operator for headers to change the entry meanings.
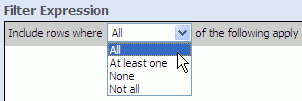
Description of the illustration bam_filter_header.gif
For the following options, data is returned when:
-
All: All of the included the entries are true.
-
At least one: At least one and maybe more of the included entries are true.
-
None: None of the included entries are true.
-
Not all: Some or none of the included entries are true, but not all of the included entries are true.
For numeric data types, nulls are not returned for filters returning values equal to zero or values not equal to zero.
5.1.1 Using Active Now
The Active Now feature in data filtering enables you to display in your views a segment of the data that is always within a defined time window. As time passes, the view is updated with the data within the defined time interval in the filter. Older data is removed from the view and newer data is added as time passes.
The time zone chosen in your Personalization does not control the time slice shown for the data. You can choose any setting for time zone in Personalization, but the behavior of the Active Now filter is based on Oracle BAM Server time.
Note:
Note that time groups are used to arrange the data in the chart based on a datetime field, while Active Now filters are used to concentrate on a particular time slice in a data object. These options can be used in the same chart.
See Section 4.2.5, "Configuring Time Groups" for more information about grouping data in a chart by datetime values.
For an example of how time groups and Active Now can be used in the same view, see Section 5.1.1.4, "Using Active Now and Time Groups in the Same Chart."
Active Now is available when you select one of is within a time interval, is within the current time period, or is within a time period comparison expressions in a filter, as shown in Figure 5-2.
Active Now behaves differently depending on which comparison expression you choose.
See the following topics for more information:
-
Section 5.1.1.4, "Using Active Now and Time Groups in the Same Chart"
-
Section 5.1.1.5, "Understanding Active Now Behavior in a Multiple Entry Filter Expression"
5.1.1.1 Using is within a time interval
The is within a time interval comparison option, when used with the Active Now interval, is absolute in nature irrespective of the unit of time selected in the filter expression. The time interval is derived from the current time on Oracle BAM Server.
There are two types of time intervals that can be configured: previous and next.
The previous type derives a time interval based on the current time on Oracle BAM Server, and datetime values occurring before the current time.
The next type derives a time interval based on the current time on Oracle BAM Server, and datetime values occurring after the current time.
Figure 5-3 Is within a time interval Type Selection

Description of "Figure 5-3 Is within a time interval Type Selection"
The time unit includes weeks, days, hours, and minutes.
Figure 5-4 Is within a time interval Unit Selection

Description of "Figure 5-4 Is within a time interval Unit Selection"
Synchronize Active Now Boundaries With Continuous Time Series or Groups
The Synchronize Active Now boundaries with Continuous time series/groups setting enables you to set the Active Now interval to the time unit configured for the time group.

Description of the illustration bam_activenow_synch.gif
When Synchronize Active Now boundaries with Continuous time series/groups is checked along with Active Now, then the Active Now time window is synchronized with the time unit selected in the continuos time series configuration. For example, if a filter is created for within the time interval previous 1 hour on a group-by field that is displayed in a continuous time series in units of one hour, and the current time is 11:23 pm, the data between 11 pm to 12 pm is displayed in the view.
When Synchronize Active Now boundaries with Continuous time series/groups is not checked along with Active Now, then Active Now time window is not synchronized with the continuos time series time unit. For example, if a filter is created for within the time interval previous 1 hour on a group-by field that is displayed in a continuous time series in units of one hour, and the current time is 11:23pm, the data between 10:23 pm to 11:23 pm is displayed in the view.
The Active Now Interval setting enables you to control how fast (in seconds) the time window within which data is displayed advances. Whether you select weeks, days, hours or minutes as your unit of time, the Active Now Interval guarantees that the data shown is precise to the number of seconds configured. This option is not available in the other comparison expressions that offer Active Now.
For example, a filter is created on a datetime field using the settings shown in Figure 5-5.
Because the Active Now interval is set for 20 seconds, the filter runs every 20 seconds regardless of the unit selected.
If the current time is 12:07:00 PM, only data from 12:05:01 PM - 12:07:00 PM is displayed in the view as shown in Figure 5-6.
Figure 5-6 Active Now Interval at 12:07:00 PM
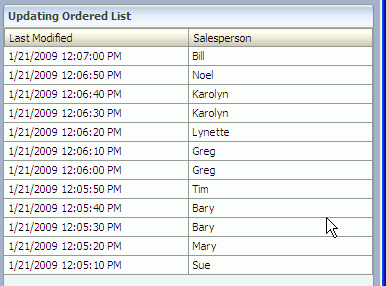
Description of "Figure 5-6 Active Now Interval at 12:07:00 PM"
When the current time changes to 12:07:20 PM, only data from 12:05:21 PM - 12:07:20 PM is displayed in the view. Every 20 seconds the data that is over 2 minutes old, by 20 seconds, is removed from the view.
Figure 5-7 Active Now Interval at 12:07:20 PM
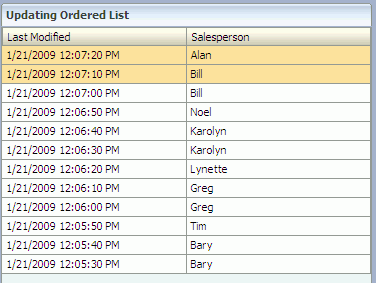
Description of "Figure 5-7 Active Now Interval at 12:07:20 PM"
5.1.1.2 Using is within the current time period
When you choose is within the current time period with Active Now enabled, the data is refreshed when the current time period changes as derived from the current time on Oracle BAM Server.
You can select a unit (time period) over which the current data is displayed. You can display data in the current year, quarter, month, week, day, hour, or minute.
Figure 5-8 Is within the current time period Unit Selection

Description of "Figure 5-8 Is within the current time period Unit Selection"
For example, a filter is created on a datetime field using the settings shown in Figure 5-9.
Figure 5-9 Active Now as used with Is within the current time period

Description of "Figure 5-9 Active Now as used with Is within the current time period"
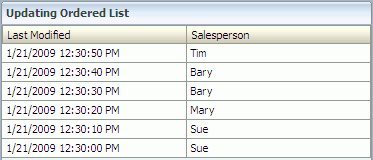
Be cause the unit is set in Minutes, this filter runs once per minute, at the beginning of the minute.
If the current time is 12:30 PM, only data from 12:30:00 PM - 12:30:59 PM (the current minute time period) is displayed in the view as shown in Figure 5-10.
Figure 5-10 Active Now Time Period at 12:30 PM
Description of "Figure 5-10 Active Now Time Period at 12:30 PM"
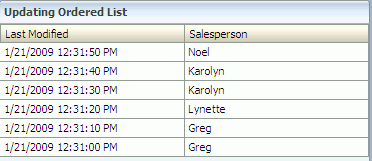
At 12:31 PM all of the data with a datetime value of 12:30:00 PM - 12:30:59 PM (the previous minute time period) is removed from the view, and data that accumulates during the 12:31:00 PM - 12:31:59 PM time period is displayed in the view.
Figure 5-11 Active Now Time Period at 12:31 PM
Description of "Figure 5-11 Active Now Time Period at 12:31 PM"
5.1.1.3 Using is within a time period
When you choose is within a time period, the data is refreshed when the time period changes. Unlike is within the current time period, you can offset to any period relative to the current time period, and the offset can be either in the future or in the past.
For example a filter is created on a datetime field using the settings shown in Figure 5-12.
Figure 5-12 Active Now as used with Is within a time period

Description of "Figure 5-12 Active Now as used with Is within a time period"
Be cause the unit is set in Hours, this filter runs once per hour at the beginning of the hour.
If the current time is 1:00:00 PM then the values displayed in the datetime field are between 2:00:00 PM - 2:59:59 PM.
Note:
In filters, you can use a negative value for offset with types from now and ago to select an interval in past.
Figure 5-13 Active Now Time Period at 1:00 PM

Description of "Figure 5-13 Active Now Time Period at 1:00 PM"
5.1.1.4 Using Active Now and Time Groups in the Same Chart
Oracle BAM provides the tools to both chart data in datetime value based groups (Section 4.2.5, "Configuring Time Groups") and filter against the same datetime fields to concentrate your view on to a particular time slice in the data object (Section 5.1.1, "Using Active Now"). This section provides an example of how to use these features in the same chart.
If the Use time series option is used to group chart values, the chart appears to slide from right to left as time passes. If the Use time groups option is selected, there is no sliding effect, but the data that is displayed in the stationary time groups changes as time passes.
In this example, we create a bar chart grouping the sample Call Center data object by the datetime field in a time series, and then add a time-based filter to only show data from the previous 10 minutes. If you complete this example in your own Oracle BAM installation you can watch the chart shift as each minute advances in real time.
-
In Oracle BAM Active Studio, create a report with a single bar chart view.
Description of the illustration bam_activenow_group1.gif
-
In the View Editor, select the Call Center data object in the Samples folder, and click Next.

Description of the illustration bam_activenow_group2.gif
-
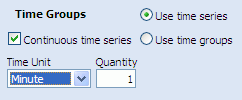
In the Choose Data Fields selection tab, select the Last Modified field in the Group By box, and configure the Time Groups settings as shown.

Description of the illustration bam_activenow_group3.gif
Description of the illustration bam_activenow_group4.gif
-
In the Choose Data Fields selection tab, select the Quantity field as the value to chart, and click Next.

Description of the illustration bam_activenow_group5.gif
-
Click Create a filter in the last step of the wizard.
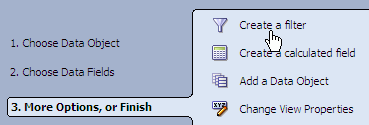
Description of the illustration bam_activenow_group6.gif
-
In the Filter tab click add new entry, and configure the filter expression as shown. Click Add Entry to save the filter expression.

Description of the illustration bam_activenow_group7.gif
-
Click OK to view the chart. The chart should be empty because there are no records in this data object containing values within the last 10 minutes.
-
Click the View link in the Actions section and save the report when prompted. The report opens for viewing so that you can see real-time data changes as we add data to the sample data object.
-
To add current data to this data object, open Oracle BAM Architect and select the Call Center data object.
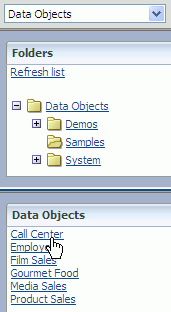
Description of the illustration bam_activenow_group8.gif
-
Click the Contents link and click Edit Contents.
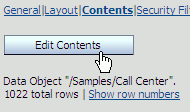
Description of the illustration bam_activenow_group9.gif
-
Click Add to add a row to the data object and enter values into the Quantity and Last Modified fields. (It is not necessary to enter data in the remaining fields.)

Description of the illustration bam_activenow_group10.gif
-
Click Save to commit the row to the data object.
-
Quickly look at the report in the Oracle BAM Active Studio browser window. You should see it update immediately.
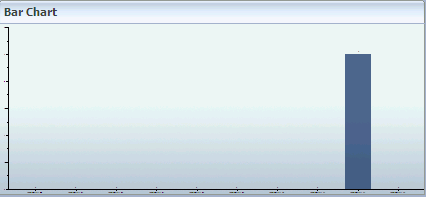
Description of the illustration bam_activenow_group11.gif
-
Try entering more data to watch the grouping and filtering in operation. As each minute advances the oldest minute label drops off on the left end of the horizontal axis, and the newest minute label appears on the right end.
5.1.1.5 Understanding Active Now Behavior in a Multiple Entry Filter Expression
When a report or alert consists of an entry on datetime or timestamp fields, and Active Now is enabled in one entry, among others, The entry with Active Now is evaluated first, and the other entries are ANDed with it.
In other words, the order of precedence will always be (Acitve_Now_Entry) AND (Other_Entries).
For example, consider three entries in a filter expression such as:
Entry1: col1 is equal to value1
Entry2: time_col is within the current time period current YEAR
Entry3: col2 is equal to value2
(Where Entry2 is an entry with Active Now enabled)
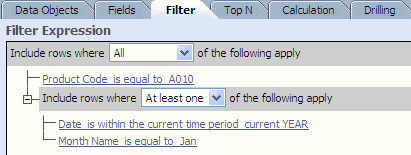
Description of the illustration bam_activenow_mult.gif
If the filter expression headers and entries are configured like this:
Entry1 AND (Entry2 OR Entry3)
The expression will be evaluated as:
Entry2 AND (Entry1 AND Entry3)
An expression like
Entry1 OR Entry2 OR Entry3
will be evaluated as
Entry2 AND (Entry1 OR Enrty2)
5.2 Displaying Top N Data
You can choose to display only the top values of the first field series in Bar Chart (2D and 3D), Line Chart (2D and 3D), Area Chart (2D and 3D), Combo Chart (2D and 3D), Stacked Bar Chart (2D and 3D), Updating Ordered List, and Action List views.
When there is a tie in the top n list, the rank will be the same for all tied rows. For example, if the top four sales amounts are 100,200,300, and 300, then the rank field will show 1,2,3,3 instead of 1,2,3,4.
In Updating Ordered List and Action List views, you must apply sorting to a field before applying top N. The top N selection applies to the first sorted field.
-
Click the Data button in the View Editor. To open the View Editor, double-click the view you are editing, or click Edit view in the View Tasks/Options list.
-
Click the Top N tab.

Description of the illustration bam_ve_topn.gif
-
Select the check box next to the Quantity field.
-
Use the arrow icons to select the quantity of top values to display.
-
In Updating Ordered List and Action List views, you can select the ranking check box and type a name for the field to show the ranking of the top N values.
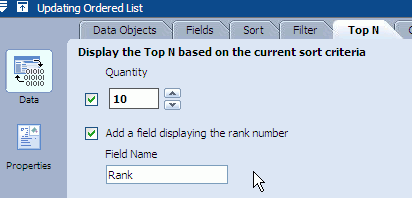
Description of the illustration bam_ve_topn_list.gif
-
Click Apply or OK to update the view.
5.3 Using Drilling
Drilling enables you to select an item in a series and view data at a more detailed level or view the actual data rows. To drill down through multiple levels, the data object must include a dimensional hierarchy that is selected on the Drilling tab in the View Editor.
When designing a view where you want users to be able to drill down into multiple levels, group by the highest level in the hierarchy to use. If you choose an intermediate level, users can only drill down from that level in the hierarchy. They cannot drill upwards above the level you select in the chart.
You can drill in reports that you are viewing, but you cannot drill in reports while you edit them. Active data stops and then restarts when drilling.
5.3.1 Drilling Down
Drilling down means to display data one level down the drill path and display it in the same view type in the current report. Drilling down is an option when intermediate levels exist in the drill path and the next level down is not the last level in the drill path. If the next level down is the last level in the drill path, it is only possible to drill through. In some cases, drill through is also not an option because report designers can disable the drill through to detail option.
The drilling areas include bars or labels on horizontal axis in bar charts, and segments or legends in pie charts. You can also drill down into a collapsed list on a row of data. Right-click to view the drill options.
-
Move the cursor over the bar or pie slice of the series to drill down in. A magnifying glass icon is displayed. Click the bar or pie slice to drill down.
-
Right-click the bar or pie slice of the series to drill down in and select Drill Down.
5.3.2 Drilling Up
Drilling up means to display data one level up the drill path.
-
Right-click the bar or pie segment of the series to drill up in and select Drill Up.
5.3.3 Drilling Through
Drilling through means to display data at the lowest level of the drill path and display it in an Updating Ordered List, Collapsed List, or Action List view. Drilling through displays data at the most detailed list level.
Drill through is an option on most chart, KPI and crosstab views unless the report designer deselected the Enable drill through to detail check box in the Drilling tab. See Section 5.3.6, "Enabling Drilling Through to Details" for more information.
You can also configure the drill through target to drill across to another report. See Section 5.3.7, "Configuring Drill-Across Targets."
-
Right-click the line, bar, or pie slice of the series to drill through, and select Show Details.

Description of the illustration bam_drill_through.gif
-
Left-click the line, bar, or pie slice until you reach the final drill-through target.
5.3.4 Drilling Across
Drilling across means replacing a view with another report (the target), replacing the entire report with another report, or opening a report in a separate window.
-
Right-click the view and select the target report name.
-
Select Menu in the view title bar and select the target report name.
Depending on how it is configured, the report replaces the current view, replaces the entire report, or opens in a separate window.
See Section 5.3.7, "Configuring Drill-Across Targets" for more information.
5.3.5 Adding Drilling Hierarchies to Views
You can select drilling hierarchies to enable Drill Through in the following views:
-
Collapsed List
-
Bar Chart (2D and 3D)
-
Line Chart (2D and 3D)
-
Area Chart (2D and 3D)
-
Combo Chart (2D and 3D)
-
Pie Chart (2D and 3D)
-
Stacked Bar Chart (2D and 3D)
You can select a data object that contains dimensions in hierarchies. You create hierarchies in data objects using Oracle BAM Architect.
To select a drilling hierarchy:
-
In a report that you are editing, select the Drilling tab.
-
Select the hierarchy to use during drilling.
If no items display in the list, the data object does not have any drilling hierarchies defined. For information about configuring hierarchies in data objects, see Oracle Fusion Middleware Developer's Guide for Oracle SOA Suite.
-
Deselect Enable drill through to detail to prevent users from drilling to the underlying data, which are displayed in an Updating Ordered List or Action List view.
-
Click OK or Apply.
5.3.6 Enabling Drilling Through to Details
Whether or not the data object has a dimensional hierarchy defined, you can drill through to view detailed data (shown in an Updating Ordered List or Action List) in any of the following views:
-
Collapsed List
-
Bar Chart (2D and 3D)
-
Line Chart (2D and 3D)
-
Area Chart (2D and 3D)
-
Combo Chart (2D and 3D)
-
Pie Chart (2D and 3D)
-
Stacked Bar Chart (2D and 3D)
-
Arrow
-
Market Arrow
-
Range Gauge
-
Dial Gauge
-
Crosstab
-
Summary Crosstab
-
Matrix
Not all views that allow drilling through to details allow hierarchical drilling.
To enable drilling through to details:
-
In a report that you are editing, click the Drilling tab.
-
Select Enable drill through to detail.
-
Select whether the details should appear in an Updating Ordered List or Action List view.
-
Select the fields to display in the detail view. If none are selected all fields selected to create the view (on the Fields tab) and the drilling hierarchy are displayed.
-
Click OK or Apply.
5.3.7 Configuring Drill-Across Targets
You can configure any view to drill across to another target report. You can replace the current view with the target report, replace the entire report with the target report, or open the target report in a separate window. You can create many drill-across targets in a view.
Drilling across cannot be done from surface prompts, container, tabbed group, row and column group, dashboard, external content, and action form views.
To configure a drill-across target:
-
In a report that you are editing, select the Drilling tab.
-
In the Drill Across Menu box click New Target. The Drill Across Action Creation and Edit dialog box opens.
-
Select a Destination Type.
-
Replace the Current View replaces the space occupied by the current view with the target report.
-
Replace the Current Report replaces the entire report with the target report. If you select this option you can see bread crumbs at the top of the report. To turn off the bread crumbs, click Change Report Properties, select the Advanced tab, and uncheck the Show Breadcrumbs box.
-
Launch a New Window opens a separate browser in which to display the target report. You can configure the properties of a separate browser window that opens when a user clicks a hyperlink in a list view, by selecting Click here to edit the window features.
-
-
Optionally select context options.
-
Show With Context includes the target in the right-click menu in any data row or chart element.
-
Show With No Context includes the target in the right-click menu outside of the data rows and chart elements, and it includes the target in the view title bar menu.
-
-
Click Next.
-
Click Browse to select a target report. To drill across to a URL, see Section 5.3.8, "Drilling Across to a URL" for more information.
-
Click Next.
-
Optionally, map fields to parameters and prompts in the target report.
When the target report contains prompts and parameters, you can send values to them by mapping fields in this step. The value is chosen from the data row or chart element you clicked when choosing the target. For example if you right-click a bar in a Bar Chart view, the group value represented in that bar that are mapped to a prompt or parameter is sent to the target report.
-
Click OK to close the dialog box.
-
To configure this drill-across target to be a drill-through target, click Drill Through in the Drill Across Menu box, and deselect Enable drill through to details in the Drill Level Properties box.
-
Click OK or Apply in the View Editor.
5.3.8 Drilling Across to a URL
When launching a target in a separate window you can choose any URL, rather than a report, as the target.
To configure a drill-across URL target:
-
In a report that you are editing, select the Drilling tab.
-
In the Drill Across Menu box click New Target. The Drill Across Action Creation and Edit dialog box opens.
-
Select Launch a New Window.
-
Optionally select a context option.
-
Show With Context includes the target in the right-click menu when the mouse is in any data row or chart element.
-
Show With No Context includes the target in the right-click menu outside of the data rows and chart elements, and it includes the target in the view title bar menu.
-
-
Click Next.
-
Enter a URL in the Destination URL field.
-
Enter a Destination Name that appears in the drilling menu.
-
Edit window features as desired.
You can configure the properties of a separate browser window that opens when a user clicks a hyperlink in a list view, by selecting Click here to edit the window features.
-
Click Next.
-
Map fields to external parameters to build a query string.
-
Click OK to dismiss the dialog box.
-
Click OK or Apply in the View Editor.
5.4 Adding Calculated Fields
You can add calculated fields to views in reports. You can create a calculation based on other fields in the view, for example, fields such as Sales and Costs. The calculator includes aggregate functions, string functions, and date/time functions that you combine with existing data fields to create calculated fields. Then, you can add these calculated fields to the view or create more calculated fields based on other calculated fields.
If you create an aggregated calculated field for a list view, you are not able to add it as a field in the list.
-
Click the Data button in the View Editor. To open the View Editor, double-click the view you are editing, or click Edit view in the View Tasks/Options list.
-
Select the Calculation tab.
-
Start a calculated field expression:
-
Select a number, operator, or parenthesis button on the calculator.
-
Select a field from the Field list and click Insert Field.
-
Select a function from Expression list and click Insert Expr. See Appendix A, "Calculation Operators and Expressions" for more information.
-
Type directly in the calculated field area.
See Section 5.4.2, "Using Decimal Type Numbers in Calculations" for information about using Decimal type constants in calculation expressions.
-
Click Group By and select one or more fields to group by. You cannot group on a calculation that does not perform any aggregation.
Note:
You can insert HTML strings in an expression to add formatting to a calculated field. See Section 5.4.1, "Using HTML in Calculations" for more information.
-
-
When you have created the calculated field expression, click Enter.
A basic syntax check is performed and displays either a green check mark if the syntax passes or a red exclamation mark if the syntax does not pass.
If the calculation passes the syntax check, the field is displayed in the calculated fields list on the right.
-
To add the field to the view, click the Fields tab in the View Editor and click the check box next to the field name.
-
Click Apply or OK to update the view.
-
Select the field in the calculated fields list, and click Rename.
The Rename dialog box opens.
-
Enter a name for the calculated field, and click OK.
You cannot rename a calculated field to an existing field name.
The field name must start with a letter or underscore and contain no more than 30 characters (letters, numbers, and underscores). Spaces are not valid.
If you include a calculated field in a view either as a field or in a filter or other applications, and then you rename it, the calculated field might not perform correctly in the view. Rename a calculated field before adding it to a view or a filter.
Select the field and click Delete.
The calculated field is deleted.
The calculated field must not be used in any other tab (for example, it cannot be selected in the View Editor Fields tab) prior to deleting in the Calculation tab.
5.4.1 Using HTML in Calculations
You can add HTML tags to calculated fields to add special formatting to the field.
The following example guides you through the steps for using HTML in calculated fields.
-
Create a report using the Streaming List view.
-
When the View Editor opens, select the Call Center data object in the Samples folder and click Next.
-
Select all of the fields and click Next.
-
Click Create a calculated field.
-
Enter the following in the expression box:
If(Total > 50)
Then(Concat("<div style='color:red'>",Total,"</div>"))
Else(Concat("<div style='color:green'>",Total,"</div>"))
-
Click Enter. The field name appears in the calculated fields list.
-
Click Apply.
-
Select the Fields tab.
-
Select the calculated field and click Apply.
-
Select the Properties icon and select the Value Format tab.
-
Select the calculated field from the Apply To list.
-
Select HTML from the Category list.
-
Click OK. The calculated field shows the Total values in green or red.
5.4.2 Using Decimal Type Numbers in Calculations
Constant values of type Decimal used in a calculated field require the "D" character suffix.
For example, 10D, 55.45D, 8999.6767D.
This requirement is applicable to calculated columns in Oracle BAM data objects and calculated fields in reports created in Oracle BAM Active Studio.
Usage of the "D" suffix is mandatory for operators such as If, IfNull(), and so on, that require all operands to be of same type. While using constants as operands with other fields of type Decimal in these operations, you must add the character "D" as a suffix to all of the constants in the expression.
-
Numeric constants without a decimal point (.) and without the "D" suffix are interpreted as type Integer (for example, 0, 5, 9, 676).
-
Numeric constants with a decimal point (.) and without the "D" suffix are interpreted as type Float (for example, 78.6, 78.9 9.0, 0.0).
-
Numeric constants with the "D" suffix and with or without a decimal point are interpreted as type Decimal.
For a field Field1 of type Decimal, a calculation formula could be:
If(Field1 == 0.0D) Then (111111D) Else (222222D)

IfNull(Field1, 0.0D)
5.4.3 Formatting Date Subtractions in Calculated Fields
Calculated fields involving date subtractions such as datetime–datetime, timestamp–datetime or datetime–timestamp, can be created in both Oracle BAM Active Studio and Oracle BAM Architect.
When you add a calculated field involving a date subtraction, the result is an integer displayed in seconds (for example, 82,944,000). To format the result in Days, H:mm:ss (for example, 40 Days, 7:40:33), change the number value format property of the calculated field.
If the calculated field is created in Oracle BAM Architect, you can only change the value format property of the calculated field when you use the field in a view in Oracle BAM Active Studio. The following example guides you through the steps for formatting a date subtraction calculated field in Oracle BAM Active Studio.
-
In the View Editor, click the Properties icon and then click the Value Format tab.
-
Select the calculated field from the Apply To list.
Select a field that involves a date subtraction. The date subtraction formatting feature does not apply to integer only fields.
-
Select Number in the Category list.
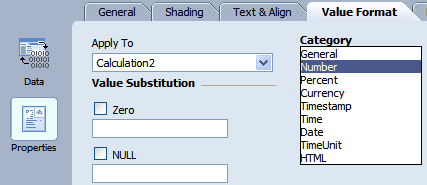
Description of the illustration bam_ve_datesubtract1.gif
-
Select the To Time Unit checkbox.
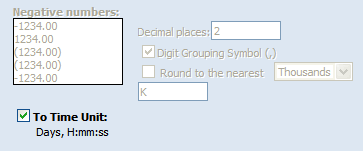
Description of the illustration bam_ve_datesubtract2.gif
When you choose to format a date subtraction field in Days, H:mm:ss, you cannot specify a negative number format or other formatting related to numeric values.
-
Click OK or Apply to update the view.
5.5 Adding Surface Prompts
You can add surface prompts to List, Chart, KPI, Crosstab, Excel, and Surface Prompts views.
Dashboard layout and size, label lengths, field lengths, and the number of prompts must be designed appropriately in order for surface prompts to be fully visible and operable. If there is not room onscreen to display them all for a given report, you won't be able to see all the prompts.
-
Create a Prompt in the report. See Section 8.4, "Creating Prompts" for more information.
-
Click the Data button in the View Editor. To open the View Editor, double-click the view you are editing, or click Edit view in the View Tasks/Options list.
-
Select the Surface Prompts tab.
The prompts available in the report are listed in the View Prompts box.
-
Use the Display in list to determine where a prompt should be displayed.
-
Use the Go Button Location list to determine where the Go button should be displayed.
-
Update the text for the Go button if desired in the Go Button Text box.
-
Click OK or Apply.
5.6 Applying Summary Functions to Groups
Many view types support adding summary functions to groups of data. The summary functions are defined in Table 5-1.
| Function | Description |
|---|---|
|
Sum |
For fields of a numeric type, this function returns the sum of all the values in the specified column. |
|
Average |
For fields of a numeric type, this function returns the mathematical average of all the values in the specified column. |
|
Minimum |
For fields of a numeric type, this function returns the smallest value of all the values in the specified column. |
|
Maximum |
For fields of a numeric type, this function returns the largest value of all the values in the specified column. |
|
Count |
For fields of any type, this function returns a count of the number of values (including duplicates) in the specified column. |
|
Count Distinct |
For fields of any type, this function returns a count of the unique values (does not include duplicates) in the specified column. |
|
Percent of Total |
For fields of a numeric type, this function returns the percentage of values in the specified column that fall within the specified group of the sum of all the values in the specified Chart Value column. |

