| Skip Navigation Links | |
| Exit Print View | |

|
Oracle Solaris Studio 12.3 Overview Oracle Solaris Studio 12.3 Information Library |
| Skip Navigation Links | |
| Exit Print View | |

|
Oracle Solaris Studio 12.3 Overview Oracle Solaris Studio 12.3 Information Library |
Oracle Solaris Studio 12.3 Overview
Introduction to Oracle Solaris Studio Software
Developer Workflow for Oracle Solaris Studio
Oracle Solaris Studio Compilers
OpenMP 3.1 for Parallel Programming
Sun Performance Library for Programs With Intensive Computation
dmake Utility for Building Applications
Tools for Debugging Applications
Tools for Verifying Applications
Discover Tool for Detecting Memory Errors
Uncover Tool for Measuring Code Coverage
Code Analyzer Tool For Integrated Error Checking
Tools for Tuning Application Performance
Collect Performance Data With the Collector
Examine Performance Data With the Performance Analyzer
Examine Performance Data With the er_print Utility
Analyze Multithreaded Application Performance With the Thread Analyzer
Oracle Solaris Studio software features several tools you can use to examine your application's behavior, enabling you to tune its performance.
The performance tools include the following:
Performance Analyzer and associated tools. A set of advanced performance tools and utilities to help you identify locations in your code where problems affect performance.
Simple Performance Optimization Tool (SPOT). A command-line tool that works with the Performance Analyzer tools and produces web pages to report the data gathered by the tools.
Profiling Tools in DLight. A set of graphical tools that run simultaneously, enabling you to analyze data about a running application from multiple sources in a synchronized fashion.
Profiling Tools in the IDE. Profiling tools similar to those in DLight, enabling you to examine the performance of your projects from within the IDE.
The Oracle Solaris Studio software provides a set of advanced performance tools and utilities that work together. The Collector, the Performance Analyzer, the Thread Analyzer, and the er_print utility help you assess the performance of your code, identify potential performance problems, and locate the part of the code where the problems occur. These tools together are referred to as the Performance Analyzer tools.
You can use options for the Oracle Solaris Studio C, C++, and Fortran compilers to target hardware and advanced optimization techniques that will improve your program's performance. The Performance Analyzer tools also are engineered for use on Oracle Sun hardware together with the compilers, and can help you improve your program's performance when running on Oracle Sun machines.
Compared to the DLight profiling tools, the Performance Analyzer tools allow you to have greater control over the data that is collected, inspect the data more deeply, and examine your program's interaction with the hardware. The Performance Analyzer tools are designed for and tested with complex compute-intensive applications running on current Oracle Sun hardware.
The Performance Analyzer tools also feature profiling of OpenMP parallel applications and MPI-based distributed applications, to help you to determine if you are using these technologies effectively in your application.
To use the Performance Analyzer tools, you must perform two steps:
Collect performance data with the Collector.
Examine the data with the Performance Analyzer graphical tool, the er_print command line utility, or the Thread Analyzer to detect data races and deadlocks on multithreaded applications.
The Collector collects performance data using profiling and by tracing function calls. The data can include call stacks, microstate accounting information (on Oracle Solaris platforms only), thread synchronization delay data, hardware counter overflow data, Message Passing Interface (MPI) function call data, memory allocation data, and summary information for the operating system and the process. The Collector can collect all types of data for C, C++, and Fortran programs, and profiling data for applications written in the Java programming language. You can run the Collector using the collect command, or from the Performance Analyzer, or by using the dbx debugger's collect subcommand.
The Oracle Solaris Studio IDE profiling tools also use the Collector to gather information.
To collect data with the collect command:
% collect [collect-options] executable executable-options
You can include options to the collect command to specify the type of data you want to collect. For example, the -c on option causes the Collector to record instruction counts. You can pass arguments to the target executable by specifying the arguments after the executable.
The Collector creates a data directory with the name test.1.er by default, but you can specify a different name on the command line. The test.1.er directory is known as an experiment, and the name must always end in .er in order for the tools to recognize it as an experiment.
The following command shows how to use collect on the synprog program:
% collect synprog
Creating experiment database test.1.er ...
00:00:00.000  ===== (15909) synprog run
00:00:00.002  ===== (15909) Thu  10 Nov 11  15:12:18 Stopwatch calibration
  OS release 5.10 -- enabling microstate accounting 5.10.
        0.001498 s.  (32.8 % of 0.004568 s.) -- inner
        N = 1000, avg = 1.498 us., min = 0.721, max = 596.665
        0.003482 s.  (72.9 % of 0.004776 s.) -- outer
        N = 1000, avg = 3.482 us., min = 2.883, max = 599.007
00:00:00.007  ===== (15909)  Begin commandline
        icpu.md.cpu.rec.recd.dousl.gpf.fitos.uf.ec.tco.b.nap.sig.sys.so.sx.so
00:00:00.008  ===== (15909) start of icputime
    3.019055 wall-secs.,   2.328491 CPU-secs., in icputime
00:00:03.027  ===== (15909) start of muldiv
    3.012635 wall-secs.,   2.675769 CPU-secs., in muldiv
00:00:06.040  ===== (15909) start of cputime
    3.000567 wall-secs.,   2.591964 CPU-secs., in cputime
00:00:09.041  ===== (15909) start of recurse
...
(output edited to conserve space)
...
The data is stored in the test.1.er directory, which can be viewed using Performance Analyzer or er_print.
For information about using the Collector, see the Help menu in the Performance Analyzer, the Oracle Solaris Studio 12.3: Performance Analyzer manual, and the collect(1) man page.
The Performance Analyzer is a graphical user interface (GUI) that displays metrics for the data recorded by the Collector. These metrics are:
Clock profiling metrics, which tell you where your program spent time in several categories.
Hardware counter metrics, which show information about CPU-specific events experienced by your program.
Synchronization delay metrics, which show delays in the synchronization of tasks performed by different threads of a multithreaded program.
Memory allocation metrics, which shows memory leaks in your program.
MPI tracing metrics, which can help you identify places where your MPI program has a performance problem due to MPI calls.
You can run the Performance Analyzer with the analyzer command. The basic syntax of the analyzer command to start the Performance Analyzer is:
% analyzer [experiment-list]
The experiment-list is one or more file names of experiments that were collected with the Collector. If you want to load more than one experiment, specify the names separated by spaces. When invoked on more than one experiment, the Analyzer aggregates the experiment data by default, but can also be used to compare the experiments.
To open the experiment test.1.er in Performance Analyzer:
% analyzer test.1.er
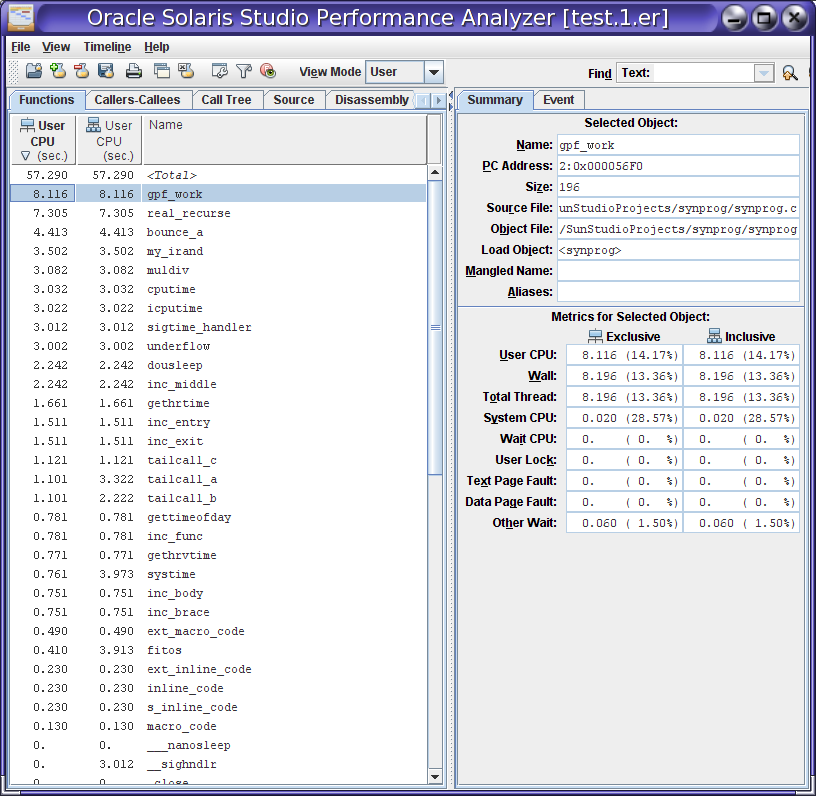
The following figure shows the Performance Analyzer's Functions tab for a test.1.er experiment that was made on the synprog example. The Functions tab shows the CPU time used by each function of the synprog program. When you click the function gpf_work the Summary tab on the right side shows details about the gpf_work function's resource usage.
For information about using the Performance Analyzer, see the Oracle Solaris Studio 12.3: Performance Analyzer manual, the Performance Analyzer integrated help, and the analyzer(1) man page.
The er_print utility presents in plain text most of the displays that are presented in the Performance Analyzer except the Timeline display, the MPI Timeline display, and the MPI Chart display.
You can use the er_print utility to display the performance metrics for functions, callers and callees, the call tree, source code listing, disassembly listing, sampling information, dataspace data, thread analysis data, and execution statistics.
The general syntax of the er_print command is:
% er_print -command experiment-list
You can specify one or more commands to indicate the type of data you want to display. The experiment-list is one or more file names of experiments that were collected with the Collector. When invoked on more than one experiment, er_print aggregates the experiment data by default, but can also be used to compare the experiments.
The following example shows the command for displaying function information for a program. The output shown is for the same experiment that was used in the screen capture of Performance Analyzer in the previous section of this document.
%  er_print -functions test.1.er
Functions sorted by metric: Exclusive User CPU Time

Excl.     Incl.      Name
User CPU  User CPU
  sec.      sec.
57.290    57.290     <Total>
 8.116     8.116     gpf_work
 7.305     7.305     real_recurse
 4.413     4.413     bounce_a
 3.502     3.502     my_irand
 3.082     3.082     muldiv
 3.032     3.032     cputime
 3.022     3.022     icputime
 3.012     3.012     sigtime_handler
 3.002     3.002     underflow
 2.242     2.242     dousleep
 2.242     2.242     inc_middle
 1.661     1.661     gethrtime
 1.511     1.511     inc_entry
 1.511     1.511     inc_exit
 1.121     1.121     tailcall_c
 1.101     3.322     tailcall_a
 1.101     2.222     tailcall_b
 0.781     0.781     gettimeofday
 0.781     0.781     inc_func
 0.771     0.771     gethrvtime
 0.761     3.973     systime
 0.751     0.751     inc_body
 0.751     0.751     inc_brace
 0.490     0.490     ext_macro_code
.
.lines deleted
You can also use er_print interactively if you specify the experiment name and omit the command when starting er_print. You can type commands at an (er_print) prompt.
For information about the er_print utility, see the Oracle Solaris Studio 12.3: Performance Analyzer manual and the er_print(1) man page.
The Thread Analyzer is a specialized version of the Performance Analyzer for examining multithreaded programs. The Thread Analyzer can detect multithreaded programming errors that cause data races and deadlocks in code that is written using the POSIX thread API, the Solaris thread API, OpenMP directives, or a mix of these.
The Thread Analyzer detects two common threading issues in multithreaded programs:
Data races, which occur when two threads in a single process access the same shared memory location concurrently and without holding any exclusive locks, and at least one of the accesses is a write.
Deadlocks, which occur when two or more threads are blocked because they are waiting for each other to complete a task.
The Thread Analyzer is streamlined for multithreaded program analysis and shows only the Races, Deadlocks, Dual Source, Race Details, and Deadlock Details tabs of the Performance Analyzer. For OpenMP programs, the OpenMP Parallel Region and OpenMP Task tabs are also shown.
You can detect data races on source code or binary code. In both cases, you have to instrument the code to enable the necessary data to be collected.
To use the Thread Analyzer:
Instrument your code for analysis of data races. For source code, use the -xinstrument=datarace compiler option when compiling. For binary code, use the discover -i datarace command to create instrumented binaries.
Deadlock detection does not require instrumentation.
Run the executable with the collect command with the -r race option to collect datarace data, the -r deadlock option to collect deadlock data, or the -r all option to collect both types of data.
Start the Thread Analyzer with the tha command or use the er_print command to display the resulting experiment.
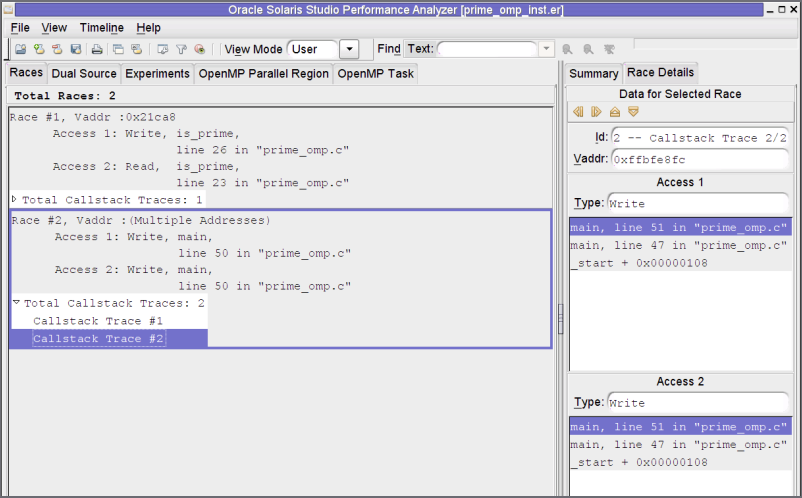
The following figure shows the Thread Analyzer window with data races that were detected in an OpenMP program, and the call stacks that lead to the data races.
For information about using the Thread Analyzer, see the tha(1) man page and the Oracle Solaris Studio 12.3: Thread Analyzer User’s Guide.
The Simple Performance Optimization Tool (SPOT) can help you diagnose performance problems in an application. SPOT runs a set of performance tools on an application and produces web pages to report the data gathered by the tools. The tools can also be run independently of SPOT.
SPOT is complementary to the Oracle Solaris Studio Performance Analyzer. The Performance Analyzer tells you where the time was spent in running your application. In certain situations, however, you may need more information to help diagnose your application's problems. SPOT can assist you in these situations.
SPOT uses the Performance Analyzer's collect utility as one of its tools. SPOT uses the er_print utility and an additional utility called er_html to display the profiling data as a web page.
Before you use SPOT, the application binary should be compiled with some level of optimization with the -O option and debugging information with the -g option to enable the SPOT tools to map performance information to lines of code.
SPOT can be used to gather performance data by launching an application or attaching to an already running application.
To run SPOT and launch your application:
% spot executable
To run SPOT on an already running application:
% spot -P process-id
SPOT produces a report for each run of your application, as well as a report that compares SPOT data from different runs.
When SPOT is used on a PID, multiple tools are attached to the PID in sequence to generate the report.
The following figure shows part of the SPOT run report, which shows information about the system on which SPOT was run, and about how the application was compiled. The report includes links to other pages with more information.
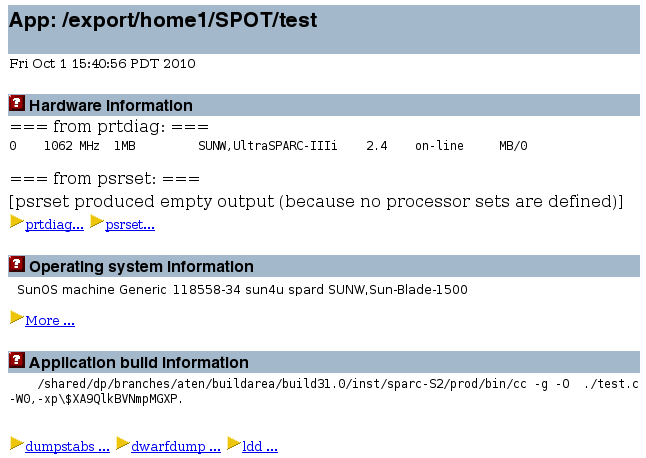
The SPOT report web pages are linked together to make it easy for you to examine all the data complied.
For more information, see the Oracle Solaris Studio 12.2: Simple Performance Optimization Tool (SPOT) User’s Guide.
DLight is an interactive graphical tool that uses the Oracle Solaris Dynamic Tracing (DTrace) technology to observe the behavior of running programs. DLight launches multiple profiling tools simultaneously, enabling you to analyze data about a running application from multiple sources in a synchronized fashion. The DLight profiling tools can help you determine the root cause of a runtime problem in an application. The tools are low impact, which enables the profiling to be done without negatively affecting the program or the system.
The DLight profiling tools require privileges that control user access to DTrace features. For this reason, you should run DLight on a system where you either have administrative privileges or can have the dtrace_user, dtrace_proc, and dtrace_kernel privileges granted to you by an administrator.
To start DLight:
% dlight
You choose a target application that you want to monitor, and the profiling tools that you want DLight to run. The target application can run on the local system, or on a remote networked system where you have login access and DTrace privileges.
You can run DLight on an executable that is not yet running, or attach it to a running process. You can also attach DLight to a process tree, which includes a process and any child processes that are started by the process. DLight graphically displays the data it collects as the target program runs.
DLight includes the following profiling tools:
Thread Microstates – Shows summary data about the states of the threads running in your program as it runs.
CPU Usage – Shows the percentage of CPU time used by your program during its run. The CPU time is divided between user CPU time and system CPU time.
Memory Usage – Shows how your program's memory heap changes over time.
Thread Usage – Shows the number of threads running in your program and indicates when the threads are waiting.
I/O Usage – Shows number of bytes read and written by your program.
Each of the tools provides a button that opens a related tool that shows more detailed information:
Thread Details – Click the Thread Details button in the Thread Microstates graph
CPU Time Per Function – Click the Hot Spots button in the CPU Usage graph
Memory Leaks – Click the Memory Leaks button in the Memory Usage graph
Thread Synchronization Details – Click the Sync Problems button in the Thread Usage graph
I/O Details – Click the I/O Details button in the I/O Usage graph
The following figure shows the DLight profiling tools running on the ProfilingDemo sample application that is used in the Oracle Solaris Studio 12.3: DLight Tutorial.
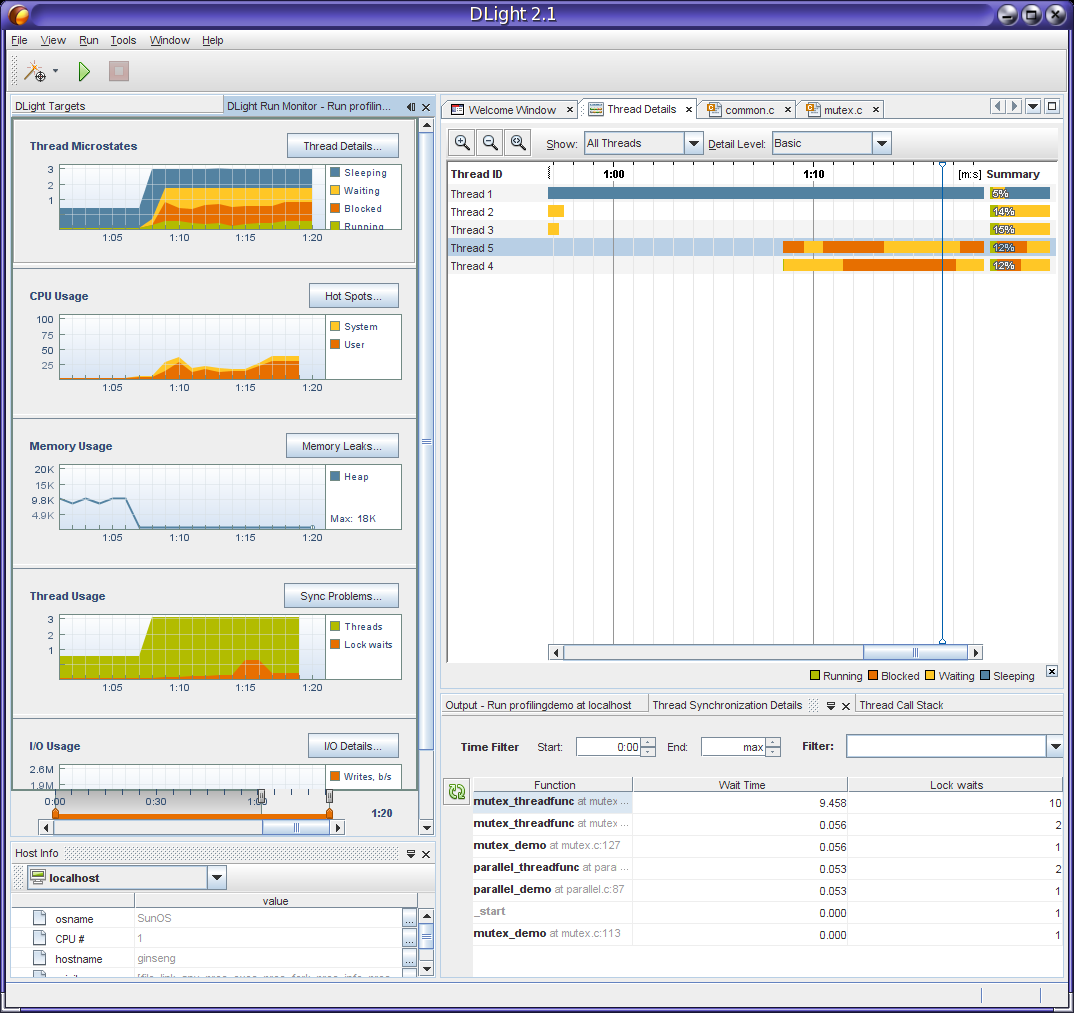
In the figure, the Thread Details window is open at the top left of the DLight window after the user clicked the Thread Details button in the Thread Microstates tool. The Thread Synchronization Details window, shown at the lower right, is open after the user clicked the Sync Problems button in the Thread Usage tool.
When you run DLight on a process tree target the following tools are displayed:
Thread Microstates of Profiled Processes – Shows an aggregation of the microstates of all the threads of all the processes that DLight profiled with the Process Tree Target. Buttons in this graph open windows for the following details:
Process Tree Microstate Details – Shows the microstate transitions in the form of a timeline for each thread of the target process and its child processes. Open this tool by clicking a button in the Thread Microstates of Profiled Processes tool.
Process Tree Blocked Thread Details – Shows locking statistics for the process and its children. Open this tool by clicking a button in the Thread Microstates of Profiled Processes tool.
CPU Usage of Profiled Processes – Shows the aggregated CPU usage of all threads in all the targeted processes profiled across all the CPUs they are running on.
Process Tree CPU Hot Spots – Shows the CPU-intensive areas in your program's process tree by displaying the functions in your program along with the CPU time used by the function and any functions it calls. Open this tool by clicking a button in the CPU Usage of Profiled Processes tool.
The following figure shows DLight running on a process tree target.
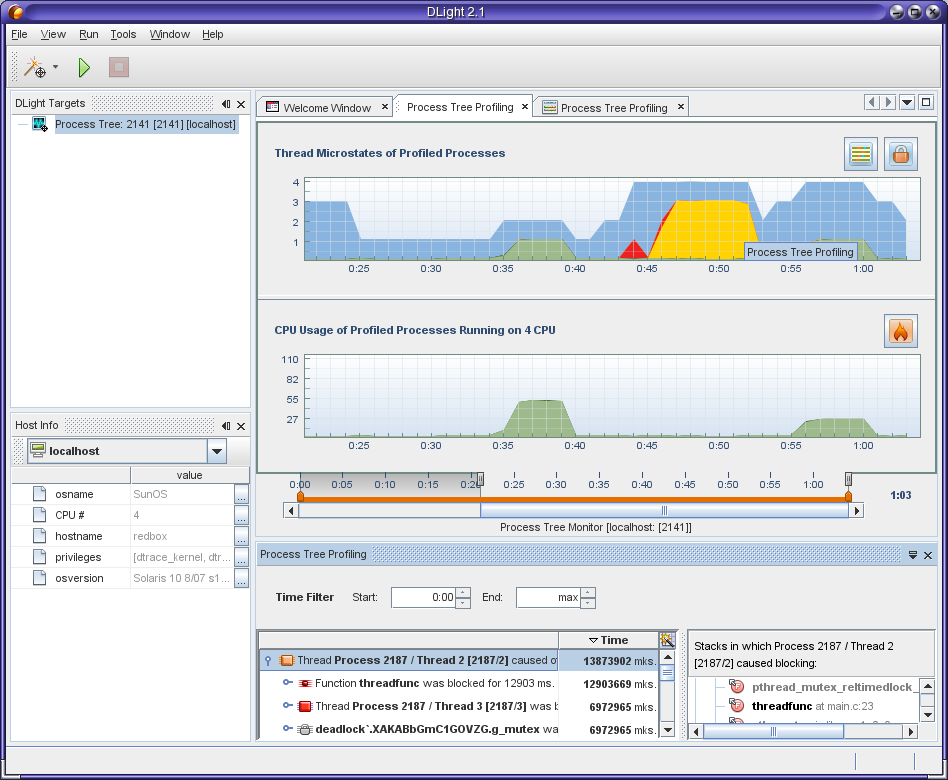
The figure shows the Process Tree Blocked Thread Details window at the bottom, which the user opened by clicking the lock icon in the Thread Microstates of Profiled Processes tool. On the right side of this window you can see the call stacks where the locks of the selected thread occurred.
The Process Tree Profiling graphs together can be used to determine how your application's multiple processes and multiple threads are working together. You can see points where threads are blocked and the effect on CPU usage, and narrow the problems down to the lines of code where they occur.
For information about using DLight, see the Oracle Solaris Studio 12.3: DLight Tutorial and DLight's integrated help available from the Help menu.
The IDE provides many of the same profiling tools as DLight to enable you to examine the performance of your projects from within the IDE. The tools run automatically whenever you run your C, C++, or Fortran projects. The tools are low impact, which enables the profiling to be done without negatively affecting the program or the system.
The data is presented graphically so you can easily see a summary of resource usage of your program. When you run your project, the Run Monitor window automatically opens to display the output of the low-impact tools. You can disable the profiling tools if you like, or specify which tools you want to run automatically.
The default profiling tools do not use DTrace as the underlying technology. Instead, they use Studio utilities and operating system utilities to collect the data. This approach enables all users to use the tools whether they are running on Oracle Solaris or Linux. However, you can also select tools that use DTrace and provide much more detailed information if you are running the IDE on Oracle Solaris.
As in DLight, the IDE tools that use DTrace require privileges that control a user's access to DTrace features. See the instructions "Enabling DTrace for Profiling C/C++/Fortran Applications" in the IDE help for information about how to assign the privileges.
The following figure shows the IDE with the default Run Monitor tools.
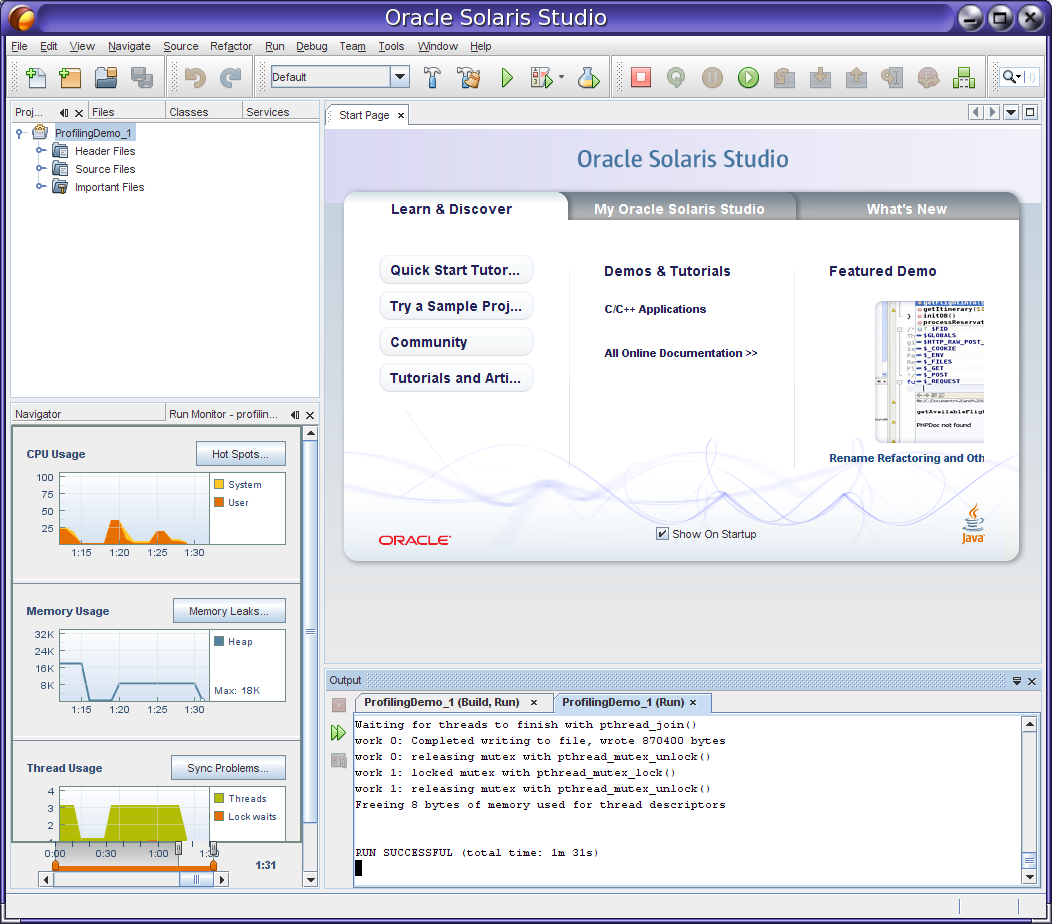
Additional tools for more detailed profiling have a greater performance impact on the system and the application, so those tools do not run automatically. The advanced tools are linked to the automatic profiling tools and can be launched easily by clicking a button.
The IDE features two additional tools that are not available in DLight: the Data Races and Deadlocks Detection tool, and the Memory Access Error tool.
The Data Races and Deadlocks Detection tool uses the same underlying technology as the Thread Analyzer, described later in this document. The tool adds instrumentation to your threaded program and then analyzes the program as it runs to detect actual and potential data races and deadlocks among the threads. To start the tool, click the Profile Project button, select Data Races and/or Deadlocks, specify options for data collection, and click Start.
The following figure shows the Data Races and Deadlocks Detection tool after it has detected data races.
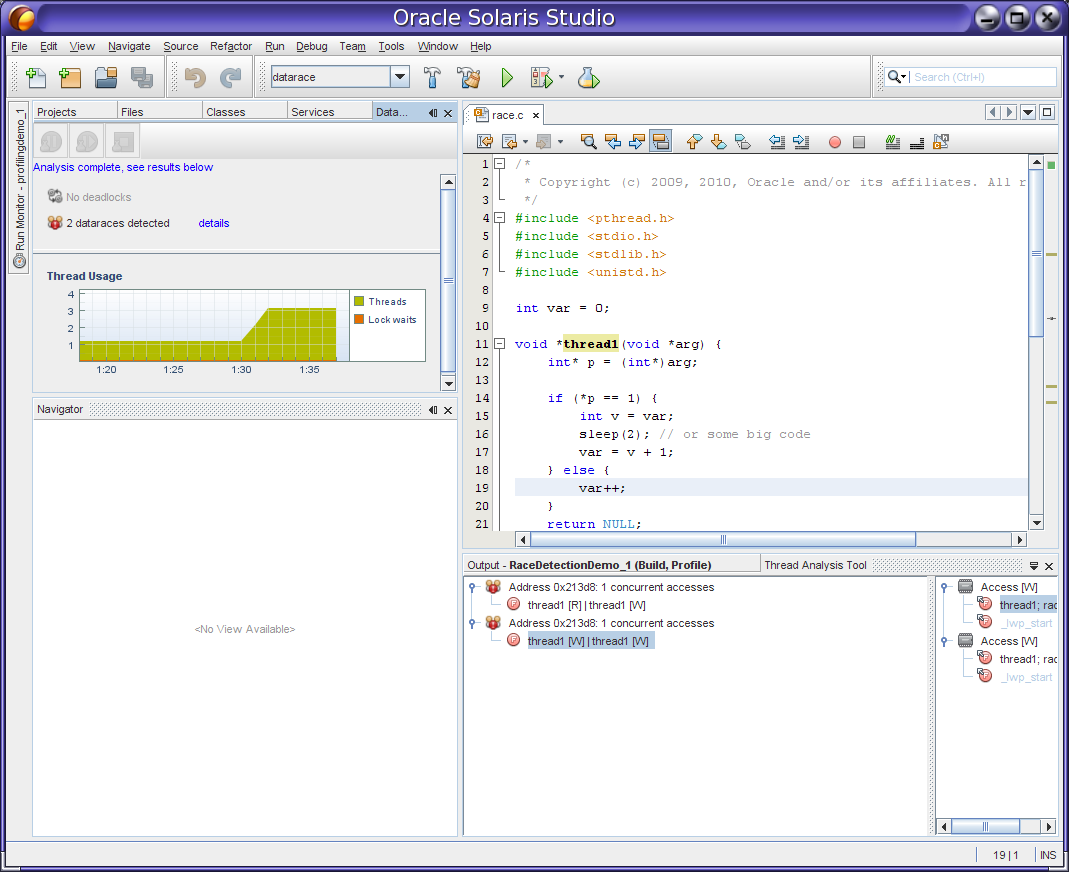
If you click the details link in the Data Race Detection window, the Thread Details window opens to show where the data races occur. You can double-click the threads in the Thread Details window to open the source file where the problem occurs and go to the affected line of code.
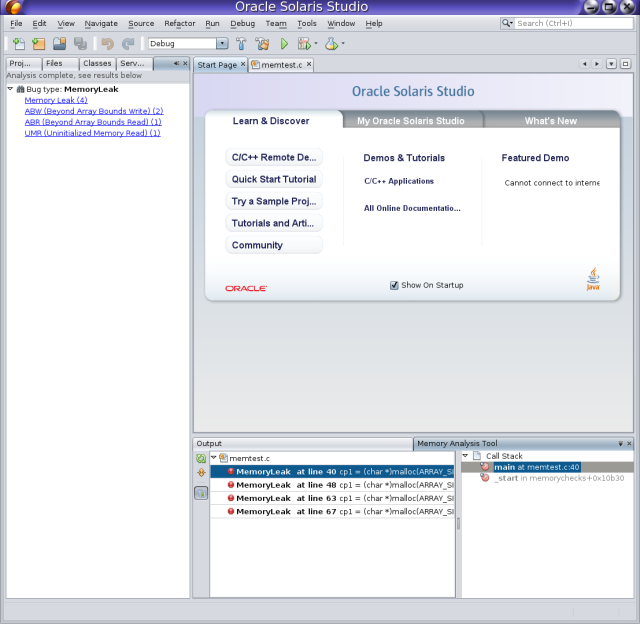
The Memory Access Error tool uses the same underlying technology as Discover, described earlier. The tool instruments your program and then analyzes the program as it runs to detect memory access errors and memory leaks. To start the tool, click the Profile Project button, select Memory Access Error, specify options for data collection, and click Start. The memory access error types are displayed in the Memory Analysis window. When you click on an error type, the errors of that type are displayed in the Memory Analysis Tool window, where you can see the call stack for each error.
The following figure shows the Memory Access Error tool after it has detected memory access errors.
For information about using the profiling tools, see the IDE integrated help, which you can access by pressing the F1 key or through the Help menu in the IDE. See "Profiling C/C++/Fortran Applications" , "Detecting Data Races and Deadlocks" and "Finding Memory Access Errors in Your Project" in the help Contents tab.