10 Advanced Threshold Management
There are monitoring situations in which different workloads for a target occur at regular (expected) intervals. Under these conditions, a static alert threshold would prove to be inaccurate. For example, the accurate alert thresholds for a database performing Online Transaction Process (OLTP) during the day and batch processing at night would be different. Similarly, database workloads can change based purely on different time periods, such as weekday versus weekend. In both these situations, fixed, static values for thresholds might result in false alert reporting.
Advanced Thresholds allow you to define and manage alert thresholds that are either adaptive (self-adjusting) or time-based (static).
-
Adaptive Thresholds are thresholds based on statistical calculations from the target's observed behavior (metrics).
-
Time-based Thresholds are user-defined threshold values to be used at different times of the day/week to account for changing target workloads.
This chapter covers the following topics:
10.1 Accessing the Advanced Threshold Management Page
You manage advanced thresholds from the Enterprise Manager console. The Advanced Threshold Management page allows you to create time-based static thresholds and adaptive thresholds. To access this page:
-
From a target home page (host, for example), navigate to the Metric Collection and Settings page.
-
From the Related Links region, click Advanced Threshold Management.
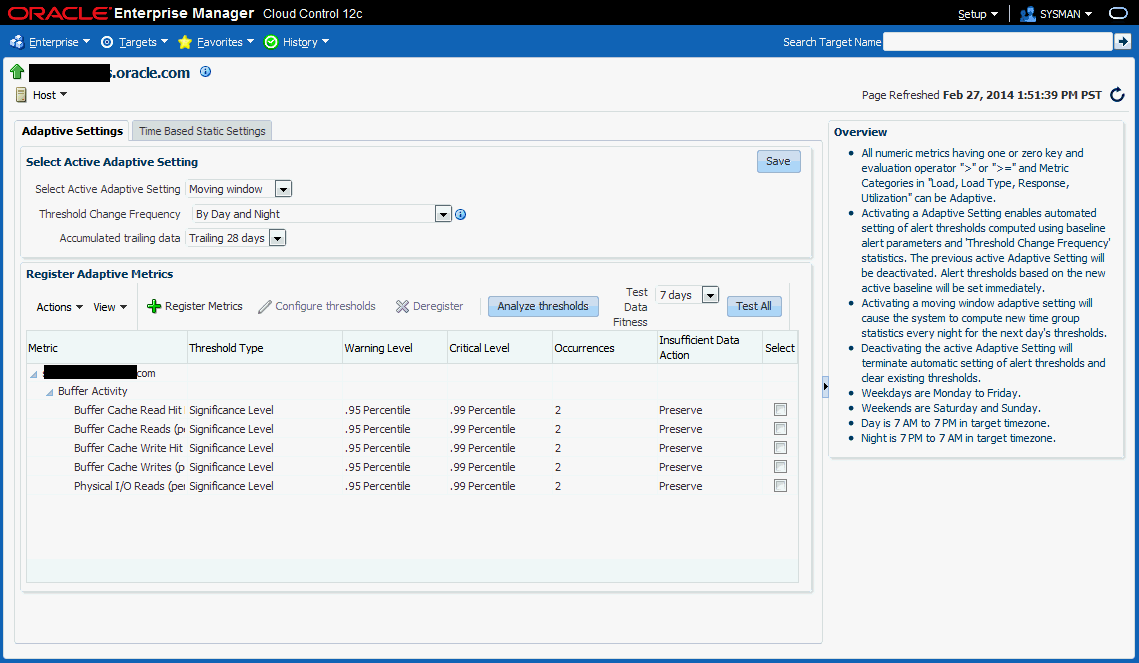
The Advanced Threshold Management page displays as shown in the following graphic.
10.2 Adaptive Thresholds
Adaptive thresholds are statistically computed thresholds that adapt to target workload conditions. Adaptive thresholds apply to all targets (both Agent and repository-monitored).
Creating an adaptive threshold is based on the following key concepts:
-
For the purpose of performance evaluation, a baseline period is a period of time used to characterize the typical behavior of the system. You compare system behavior over the baseline period to that observed at some other time.
There are two types of baseline periods:
-
Moving window baseline periods: Moving window baselines are defined as some number of days prior to the current date. This "window" of days forms a rolling interval that moves with the current time. The number of days that can be used to define moving window baseline in Enterprise Manager are:
-
7 days
-
14 days
-
21 days
-
30 days
Example: Suppose you have specified trailing 7 days as a time period while creating moving window baseline. In this situation, the most recent 7-day period becomes the baseline period for all metric observations and comparisons today. Tomorrow, this reference period drops the oldest day and picks up today.
Moving window baselines allow you to compare current metric values with recently observed history, thus allowing the baseline to incorporate changes to the system over time. Moving window baselines are suitable for systems with predictable workload cycles.
Note:
Enterprise Manager computes moving window statistics every day rather than sampling. -
10.2.1 Registering Adaptive Threshold Metrics
Adaptive threshold metrics are not immediately available by default; they must be defined and added to the system (registered) in order for them to become available for use by Enterprise Manager. Not all metrics can have adaptive thresholds: Adaptive Threshold metrics must fall into one of the following categories:
-
Load
-
LoadType
-
Utilization
-
Response
You register adaptive threshold metrics from the Advanced Threshold Management page.
-
From a target menu (Host is used in this example), select Monitoring and then Metric and Collection Settings.
-
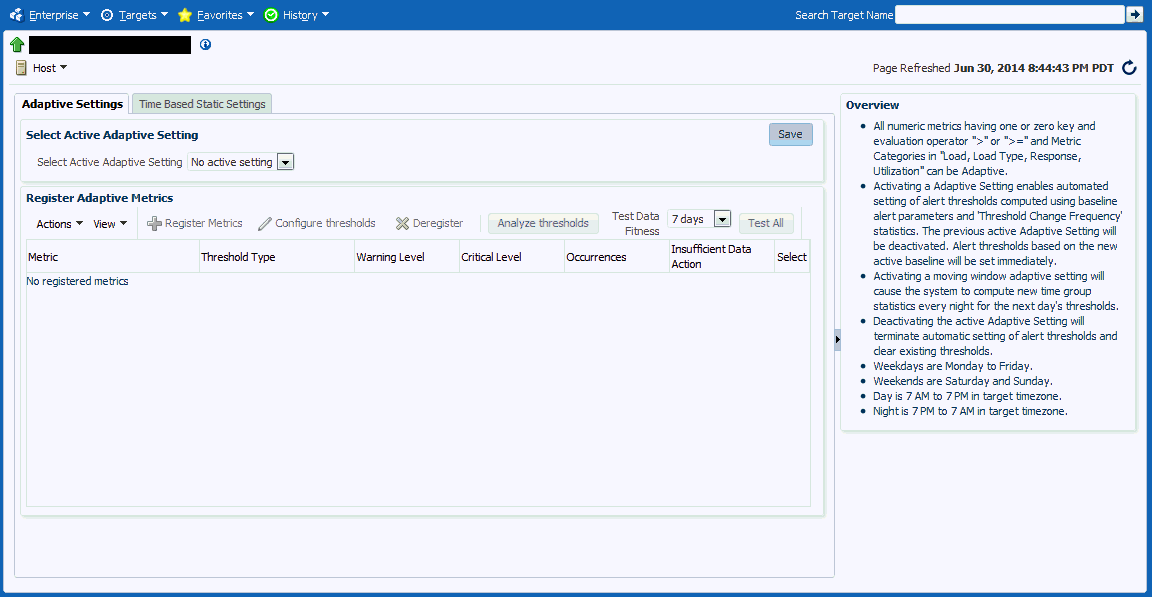
In the Related Links area, click Advanced Threshold Management.The Advanced Threshold Management page displays.
-
From the Select Active Adaptive Setting menu, select Moving Window, additional controls are displayed allowing you to define the moving window's Threshold Change Frequency and the Accumulated Trailing Data that will be used to compute the adaptive thresholds.
-
Threshold Change Frequency (The target timezone is used.)
-
None: One set of thresholds will be calculated using past data. This set of thresholds will be valid for the entire week.
None should be used when there is no usage pattern between daytime versus nighttime or within hours of a day.
-
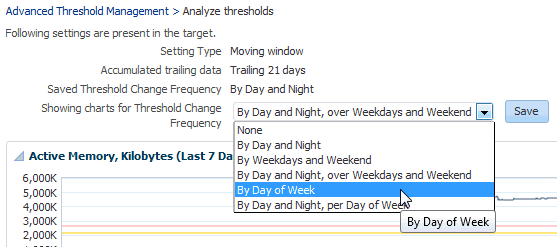
By Day and Night: Two sets of thresholds (day and night) will be calculated using past data. Day thresholds will be calculated using previous day's daytime data, Night thresholds will be calculated using previous day's nighttime data. Thresholds will be changed every day and night.
By Day and Night should be used when there are distinct performance and usage variations between day hours and night hours.
-
By Weekdays and Weekend: Two sets of thresholds (weekdays and weekend) will be calculated using past data. Weekdays thresholds will be calculated using the previous weekdays data. Weekend thresholds will be calculated using the previous weekend data. Thresholds will be changed at start of the weekdays and start of the weekend.
-
By Day and Night, over Weekdays and Weekend: Four sets of thresholds will be calculated using past data. Weekdays Day thresholds will be calculated using the previous weekday's daytime data, Weekdays Night thresholds will be calculated using the previous weekday's nighttime data. Weekends Day thresholds will be calculated using previous weekend's daytime data, Weekends Night thresholds will be calculated using previous weekend's nighttime data. Thresholds will be changed each day and night.
Weekday day hours (7a.m. to 7p.m)
Weekend day hours (7am to 7pm)
Weekday night hours (7pm to 7am)
Weekend night hours (7pm to 7am)
-
By Day of Week: Seven sets of thresholds will be calculated, one for each day of the week. Thresholds will be calculated using the previous week's same-day data. Thresholds will be changed every day.
By Day of Week should be used when there is significant daily variation in usage for each day of week.
-
By Day and Night, per Day of Week: Fourteen sets of thresholds will be calculated, one for each day of the week and one for each night of the week. Day thresholds will be calculated using previous weeks same-day daytime data, Night thresholds will be calculated using the previous week's same-day nighttime data. Thresholds will be changed every day and night each day of the week.
-
-
Accumulated Trailing Data
Total time period for which metric data will be collected. Options are 7, 14, 21, and 28 days. In general, you should select the larger value as the additional data helps in computing more accurate thresholds.
-
-
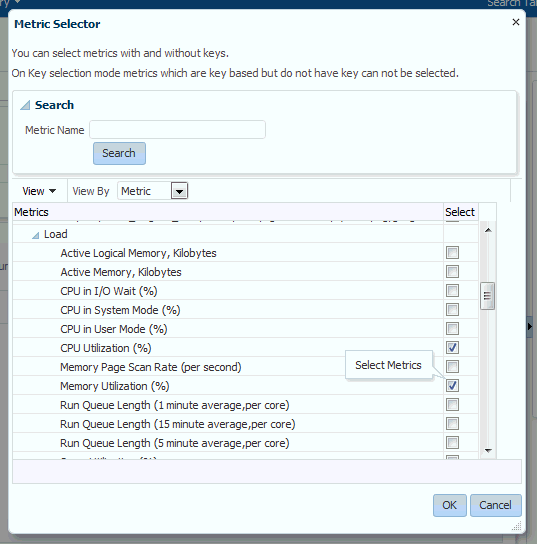
The Register Metrics button becomes active in the Register Adaptive Metrics region. Click Register Metrics. The Metric Selector dialog displays.
-
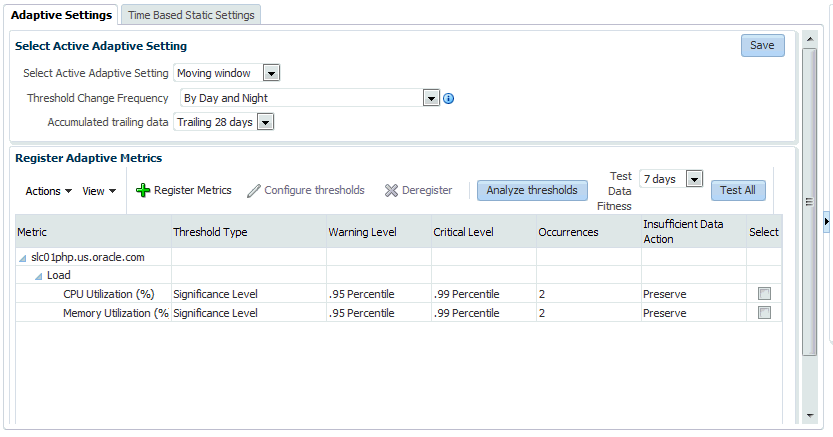
Select the desired metric(s) and then click OK. A confirmation dialog displays stating that the selected metric(s) will be added to this target's Adaptive Setting. Click Yes to confirm the action. The selected metrics appear in the Register Adaptive Metrics region.
-
Once registered as adaptive metrics, you can then select individual metrics to configure thresholds. When metrics are first registered, by default, Enterprise Manager enables Significance Level and sets the warning and critical thresholds at 95 and 99 percentile respectively.
10.2.2 Configuring Adaptive Thresholds
Once you have registered the adaptive metrics, you now have the option of configuring the thresholds if the predefined thresholds do not meet your monitoring requirements.
To configure adaptive thresholds:
-
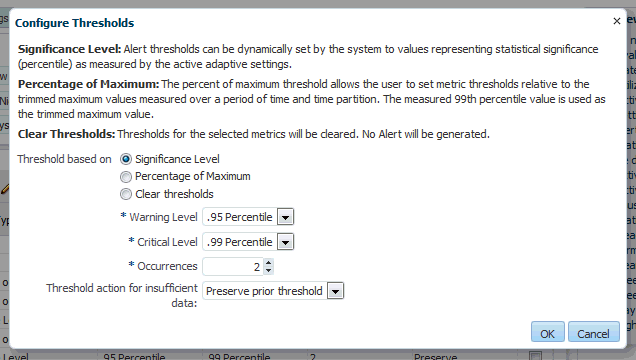
From the Register Adaptive Metrics region, select the metric(s) you wish to configure and click Configure Thresholds. The Configure Thresholds dialog displays.
-
Choose whether you want your threshold to be based on:
Significance Level: Thresholds based on significance level use statistical relevance to determine which current values are statistical outliers. The primary reason to use Significance Level for alerting is that you are trying to detect statistical outliers in metric values as opposed to simply setting a threshold value. Hence, thresholds are percentile based. For example, if the significance level is set to .95 for a warning threshold, the metric threshold is set where 5% of the collected metric values fall outside this value and any current values that exceed this value trigger an alert. A higher significance level of .98 or .99 will cause fewer alerts to be triggered.
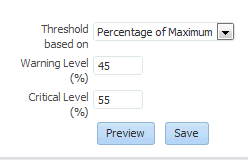
Percentage of Maximum: These types of thresholds compute the threshold values based on specified percentages of the maximum observed over the period of time you selected. Percentage-of-maximum-based alerts are generated if the current value is at or above the percentage of maximum you specify. For example, if a maximum value of 1000 is encountered during a time group, and if 105 is specified as the Warning level, then values above 1050 (105% of 1000 = 1050) will raise an alert.
For both types of alerts you can set the Occurrences parameter, which is the number of times the metric crosses a threshold value before an alert is generated.
Clear Threshold: Thresholds for the selected metrics will be cleared. No Alert will be generated. Use this option when you do not want any thresholds set for the metrics but you do not want to remove historical data. Important: Deregistering metrics will remove the historical data.
Occurrences: Consecutive number of occurrences before raising an alert.
Depending on the option selected, the Warning, Critical, and Occurrence setting options will change.
The Threshold action for insufficient data menu allows you set the appropriate action for Enterprise Manager to take if there is not enough data to calculate a valid metric threshold. There are two actions available: Preserve the prior threshold and Suppress Alerts.
-
Click OK to set the changes.
10.2.3 Determining whether Adaptive Thresholds are Correct
Even though Enterprise Manager will use the adaptive threshold settings to determine an accurate target workload-metric threshold match, it is still be necessary to match the metric sampling schedule with the actual target workload. For example, your moving window baseline period (see Moving Window Baseline Periods ) should match the target workloads. In some situations, you may not know the actual target workloads, in which case setting adaptive thresholds may be problematic.
To help you determine the validity of your adaptive thresholds, Enterprise Manager allows you to analyze threshold using various adaptive settings to determine whether the settings are correct.
To analyze existing adaptive thresholds:
-
From the Register Adaptive Metrics region, click Analyze Thresholds.
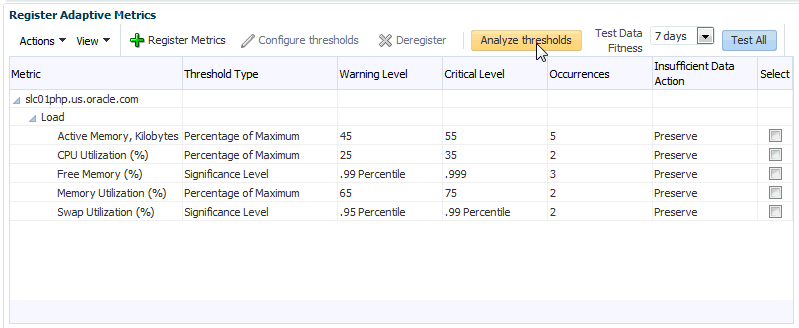
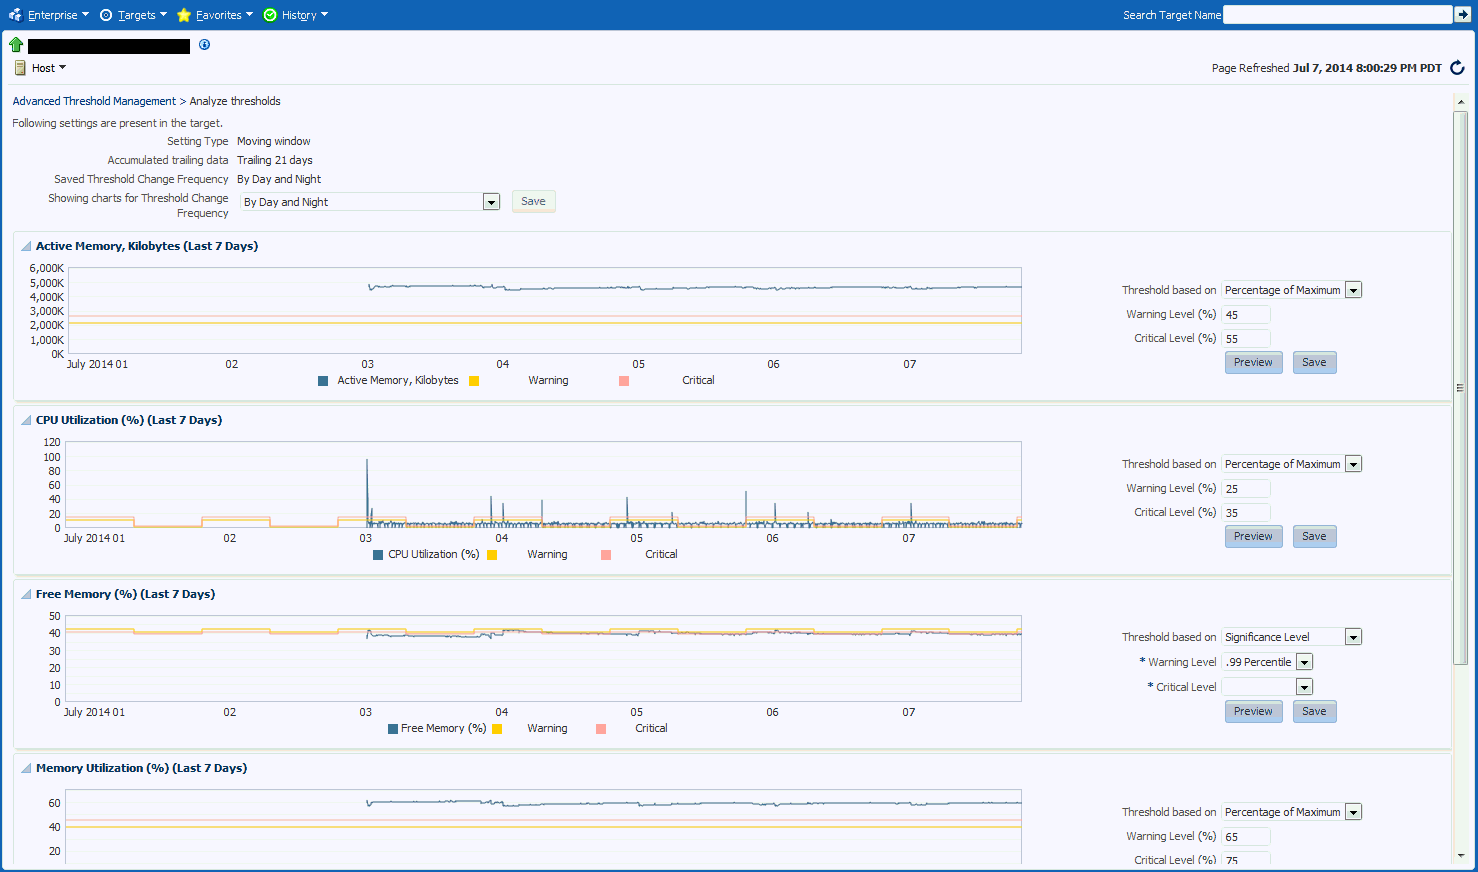
The Analyze Threshold page displays containing historical metric data charts (one for each metric).
-
Modify the adaptive threshold parameters to closely match metric threshold settings with the target workload. You can experiment with the following adaptive metric parameters:
Threshold Change Frequency
Threshold Based On

Metric Warning and Critical Thresholds
-
Once you are satisfied with the modifications for the Threshold Change Frequency or any of the individual metrics, click Save to set the new parameters.
10.2.4 Testing Adaptive Metric Thresholds
Because adaptive metric thresholds utilize statistical sampling of data over time, the accuracy of the thresholds will rely on the quantity and quality of the data collected. Hence, a sufficient amount of metric data needs to have been collected in order for the thresholds to be valid. To verify whether enough data has been collected for metrics registered with adaptive thresholds, use the Test All function.
-
From the Registered Adaptive Metrics regions, click Test All.

Enterprise Manager evaluates the adaptive threshold metrics and then displays the results in the Test Metrics window.
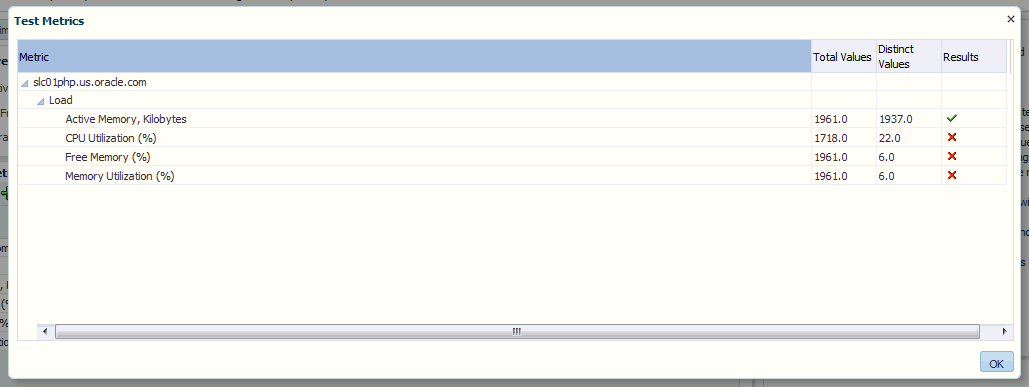
If there is sufficient data collected to compute the adaptive threshold, a green check appears in the results column. A red 'x' appears in the results column if there is insufficient data collected. To resolve this situation, you can use a longer accumulating trailing data window. Additionally, you can have metric data collected more frequently.
-
Click OK once you are finished viewing the results.
10.2.5 Deregistering Adaptive Threshold Metrics
If you no longer want specific metrics to be adaptive, you can deregister them at any time. To deregister an adaptive threshold metric:
-
From the Register Adaptive Metrics regions, select the metric(s) you wish to deregister.

-
Click Deregister. A confirmation displays asking if you want the metric removed from the target's adaptive setting.
-
Click Yes.
10.2.6 Setting Adaptive Thresholds using Monitoring Templates
You can use monitoring templates to apply adaptive thresholds broadly across targets within your environment. For example, using a monitoring template, you can apply adaptive threshold setting for the CPU Utilization metric for all Host targets.
To apply adaptive thresholds using monitoring templates:
-
Create a template out of a target that already has adaptive threshold settings enabled.
From the Enterprise menu, select Monitoring and then Monitoring Templates.The Monitoring Templates page displays.
-
Click Create. The Create Monitoring Template: Copy Monitoring Settings page displays.
-
Choose a target on which adaptive thresholds have already been set and click Continue.
-
Enter a template Name and a brief Description. Click OK.
Once the monitoring template has been created, you can view or edit the template as you would any other template. To modify, add, or delete adaptive metrics in the template:
-
From the Enterprise menu, select Monitoring and then Monitoring Templates.The Monitoring Templates page displays.
-
On the Monitoring Templates page, select the monitoring template from the list.
-
From the Actions menu, select Edit Advanced Monitoring Settings. The Edit Advanced Monitoring Settings page displays with the Adaptive Settings tab selected.
-
Modify the adaptive metrics as required.
10.3 Time-based Static Thresholds
Time-based static thresholds allow you to define specific threshold values to be used at different times to account for changing workloads over time. Using time-based static thresholds can be used whenever the workload schedule for a specific target is well known or if you know what thresholds you want to specify.
10.3.1 Registering Time-based Static Thresholds
To register metrics with time-based static thresholds:
-
From the target menu (Host is used in this example), select Monitoring and then Metric and Collection Settings.
-
In the Related Links area, click Advanced Threshold Management.The Advanced Threshold Management page displays.

-
Click on the Time Based Static Settings tab.
-
Select the Threshold Change Frequency.
-
Click Register Metrics.
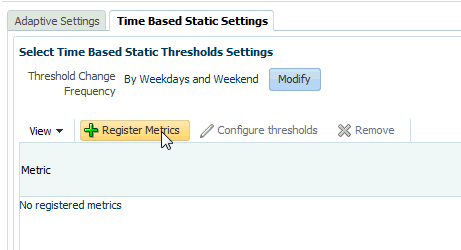
The Metric Selector dialog displays.
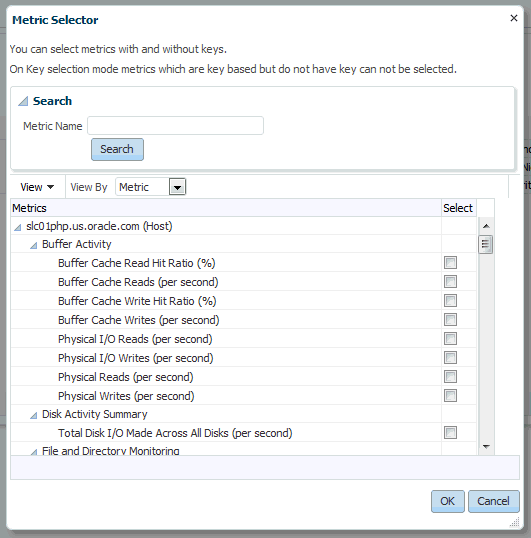
-
Select the desired metric(s) and click OK.
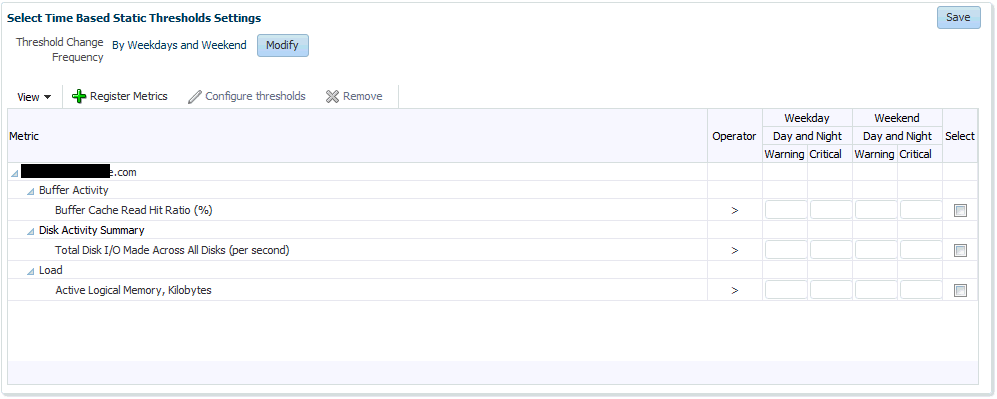
The selected metrics appear in the Registered Metrics table.
-
Enter the desired metric thresholds and click Save once you are done.
If you want to set the thresholds for multiple metrics simultaneously, check the Select box for the metrics you want to update and click Configure Thresholds. The Configure Thresholds dialog displays.
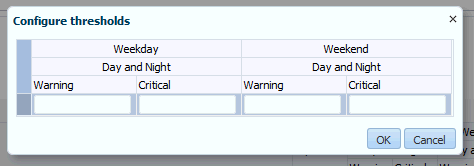
Enter the revised Warning and Critical threshold values and click OK. A confirmation dialog displays stating that existing metric threshold values will be overwritten. Click Yes.
-
Optionally, you can change the Threshold Change Frequency. To do so, from the Time Based Static Thresholds Settings page, click Modify. The Modify Threshold Change Frequency dialog displays allowing you to select a new change frequency. Select a new frequency and click OK.

A confirmation dialog displays stating that changing Threshold Change Frequency will affect all the registered metrics and whether you want to continue. Click Yes to proceed.
-
Click Save to ensure all changes have been saved to the Enterprise Manager repository.
10.3.2 Deregistering Time-based Static Thresholds
If you no longer require time-based static threshold metrics, you can deregister them from the target.
To deregister time-based static metric thresholds:
-
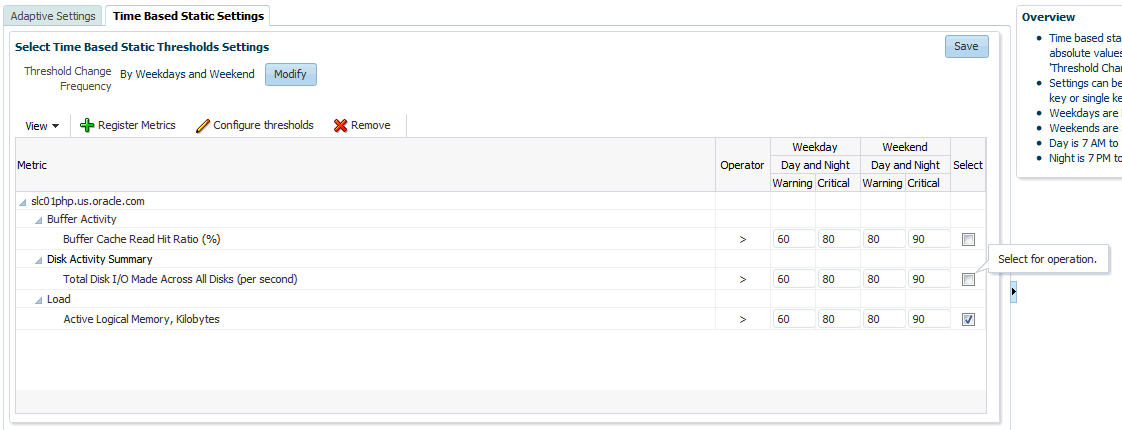
From the Time Based Static Thresholds tab, select the metric(s) you want to deregister.
-
Click Remove. The metric entry is removed from list of
-
Click Save to save the changes to the Enterprise Manager repository.
10.4 Determining What is a Valid Metric Threshold
As previously discussed, static thresholds do not account for expected performance variation due to increased/decreased workloads encountered by the target, such as the workload encountered by a warehouse database target against which OLTP transactions are performed. Workloads can also change based on different time periods, such as weekday versus weekend, or day versus night. These types of workload variations present conditions where fixed static metric threshold values may cause monitoring issues, such as the generation of false and/or excessive metric alerts. Ultimately, your monitoring needs dictate how to best go about obtaining accurate metric thresholds.
