14 Maintaining Enterprise Manager
Enterprise Manager provides extensive monitoring and management capabilities for various Oracle and non-Oracle products. Used to manage your heterogeneous IT infrastructure, Enterprise Manager plays an integral role in monitoring and maintaining the health of your IT resources. It is therefore essential to ensure Enterprise Manager itself is operating at peak efficiency.
To help you maintain your Enterprise Manager installation, a variety of enhanced self-monitoring and diagnostic functionality is available from the Enterprise Manager console. These functions are designed to help you understand and monitor various components of Enterprise Manger, monitor/measure the quality of services Enterprise Manager provides, diagnose failures quickly, and manage Agents more easily.
This chapter covers the following topics:
14.1 Overview: Managing the Manager
Although Enterprise Manager functions as a single entity to manage your IT infrastructure, in reality it is composed of multiple components working in concert to provide a complete management framework from a functional standpoint. All major components of Enterprise Manager have been grouped into a single system. A special set of services has been created (based on the system) to model Enterprise Manager functions.
-
Topology view that allows you to see all major components of Enterprise Manager and their current status.
-
Dashboard displaying the overall health of Enterprise Manager.
-
Full control of the Agent directly from the Enterprise Manager console. Functions include:
-
View/edit Agent configuration properties.
-
View Agent(s) configuration history and compare the results against other Agents.
-
Perform Agent control operations (start/stop/secure).
-
Upgrade Management Agents
-
14.2 Health Overview
The Health Overview provides a comprehensive overview of OMS and Repository operation and performance, and therefore allows you to view the overall health of your Enteprise Manager environment.
From the Setup menu, select Manage Cloud Control and then Health Overview.
All major areas of Enterprise Manager are represented.
-
Overview: Provides key information for active Management Services such as the Management Agents, the WebLogic Administration Server, total number of monitored targets, number of administrators, and server load balancer (SLB) upload and console URLs, provided SLB is configured. If configured, the SLB upload and console URLs are also displayed.
-
Repository Details: Provides physical information about the Management Repository and the host on which the database is located. You can drill down into the database home page for more information and carry out administrative operations.
-
Job System Status: Displays key operational parameters of the Enterprise Manager Job service. For detailed information, you can click on the status icon to drill down into the Enterprise Manager Job Service home page.
-
Console Activity: Displays the overall load on the Enterprise Manager console through the average number of requests per minute and the average time required to process those requests.
-
Alerts: Provides details on the metric errors recorded and when an alert was triggered. In-context links to Incident Manager are also provided.
-
Performance Charts: Upload Backlog and Upload Rate, Backoff Requests, Notification backlog. You can drill down into any chart to view detailed metric information.
From this page, you can carry out all monitoring and management operations using the OMS and Repository menu.
Note:
The Diagnostic Metrics page is intended for use by Oracle Support when diagnosing issues with the OMS. The page can be accessed by selecting Monitoring and then Diagnostic Metrics from the OMS and Repository menu.
14.2.1 Viewing Enterprise Manager Topology and Charts
The Enterprise Manager Topology page provides a graphical representation of the Enterprise Manager infrastructure components and their association. Each node in the hierarchy displays key information about the member type, the host on which it resides, and the number of incidents, if any. The incident icons on each of the nodes expand to display a global view of current status for each node in the hierarchy.
Note:
In order for the Enterprise Manager repository database to appear in the Topology page, you must first manually discover the database. Manual discovery is also required in order to have the database's metric data (Database Time (centiseconds per second)) displayed in the charts.Accessing the Enterprise Manager Topology
-
From the Setup menu, select Manage Cloud Control and then Health Overview.
-
Click on the OMS and Repository menu to display available operations that can be performed from this page.
-
Select Members and then Topology.
The Enterprise Manager Charts page displays eight charts representing key areas that together indicate the overall health of Enterprise Manager. These are Overall Files Pending Load -Agent, Job Step Backlog, Job Step Throughput (per second), Request Processing Time (ms), Database Time (centiseconds per second), CPU Utilization (%), Pages Paged-in (per second), Pages Paged-out (per second). Data can be viewed for the Last 24 hours, last 7 days or last 31 days.
Accessing the Enterprise Manager Charts
-
From the Setup menu, select Manage Cloud Control and then Health Overview.
-
Click on the OMS and Repository menu to display available operations that can be performed from this page.
-
Select Monitoring and then Charts.
14.2.2 Determining Enterprise Manager Page Performance
Page Performance Monitoring and diagnosis feature provides you with the ability to identify and diagnose performance issues with Enterprise Manager pages without having to contact Oracle support.
Important:
The Enterprise Manager page performance tracing feature requires Agent version 12.1.0.4 or later.The charts and tables in this page will display data only if the Agent that is monitoring Management Services and Repository target is version 12.1.0.4 or later. If you have upgraded Enterprise Manager 12.1.0.4, you should also upgrade the Agents on Management Service (OMS) machines to 12.1.0.4 in order to access the latest monitoring capabilities for the Management Services and Repository, as well as related targets.
See the Oracle® Enterprise Manager Cloud Control Upgrade Guide for more information on upgrading Agents.
To access Page Performance Monitoring and Diagnosis functionality:
-
From the Setup menu, select Manage Cloud Control, and then Health Overview or Repository.
-
From the OMS and Repository menu, select Monitoring and then Page Performance. The Page Performance page displays.
The overview tab provides details of the overall page performance in Enterprise Manager.
The charts display the Page Accesses and Sessions, Current Page Accesses and Sessions Distribution across OMSs and the Overall Statistics of page performance in the last 24 hours. There are details of the page performance in each of the OMSs as well as the details of the available repositories.
The Overall Statistics table provides the breakdown of times spent in the Repository, the OMS and network and the number of page accesses, the maximum time taken by page in the last 24 hours.
The page level performance tab shows the list of pages accessed in the last 24 hours.
The page also displays the breakdown of time spent in the Repository and the OMS and network in a line graph format for each page.
The performance correlation tab displays graphs for page performance that allow you to correlate performance trends.
This tab provides details of page accesses and sessions, page processing time, SQL/PLSQL executions, and average active sessions.
Symptom diagnosis can be performed for both overall page processing time and individual page times. Symptom diagnosis is triggered when the set metric thresholds for overall page processing time are exceeded. Diagnosis is accessed by means of an icon in the Overview tab in the Overall Statistics section when the overall page performance threshold is exceeded, as shown in the following graphic.
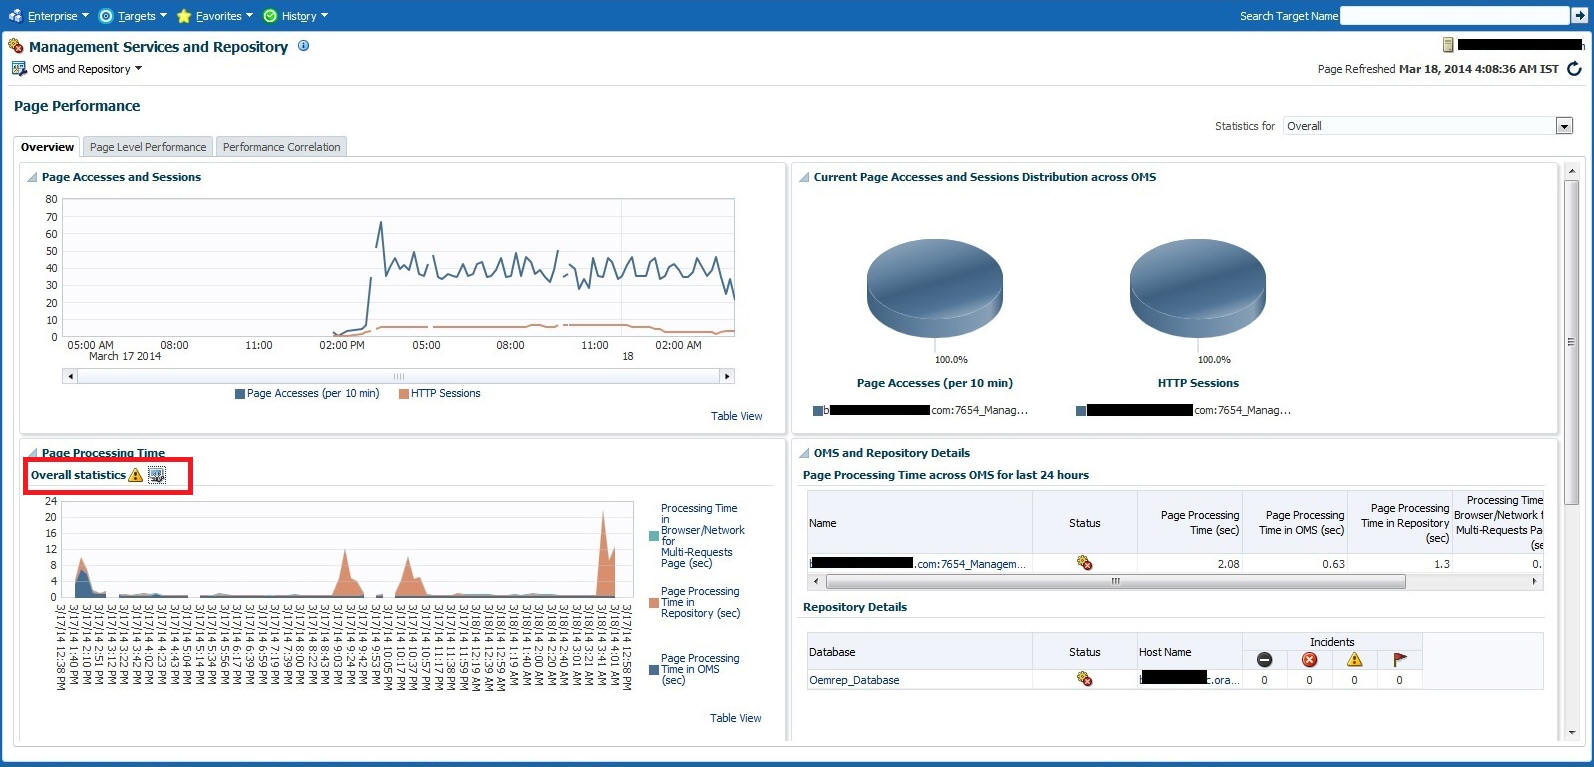
For individual pages, the symptom diagnosis icon is displayed in the table in the Current Severity column if the page performance metric threshold is exceeded.
When the icon is displayed in the Overall Statistics section, it indicates that the overall performance of the Enterprise Manager pages has exceeded the threshold in the last 10 minutes. Clicking on the icon, you are taken to another tab where the details of the diagnosis are presented. The diagnosis indicates the root cause for the overall page performance exceeding the metric threshold, the findings that were deduced on diagnosis and the checks that were performed to analyze the overall page performance issue.
The checks are performed at the database level, middle-tier level and the browser/network level to isolate which part of the system might be the cause of the issue. Each check is analyzed and the checks that are identified as the top causes are reported as findings. The topmost finding is then reported as the root cause for the performance issue.
Target Availability Symptom Diagnosis:
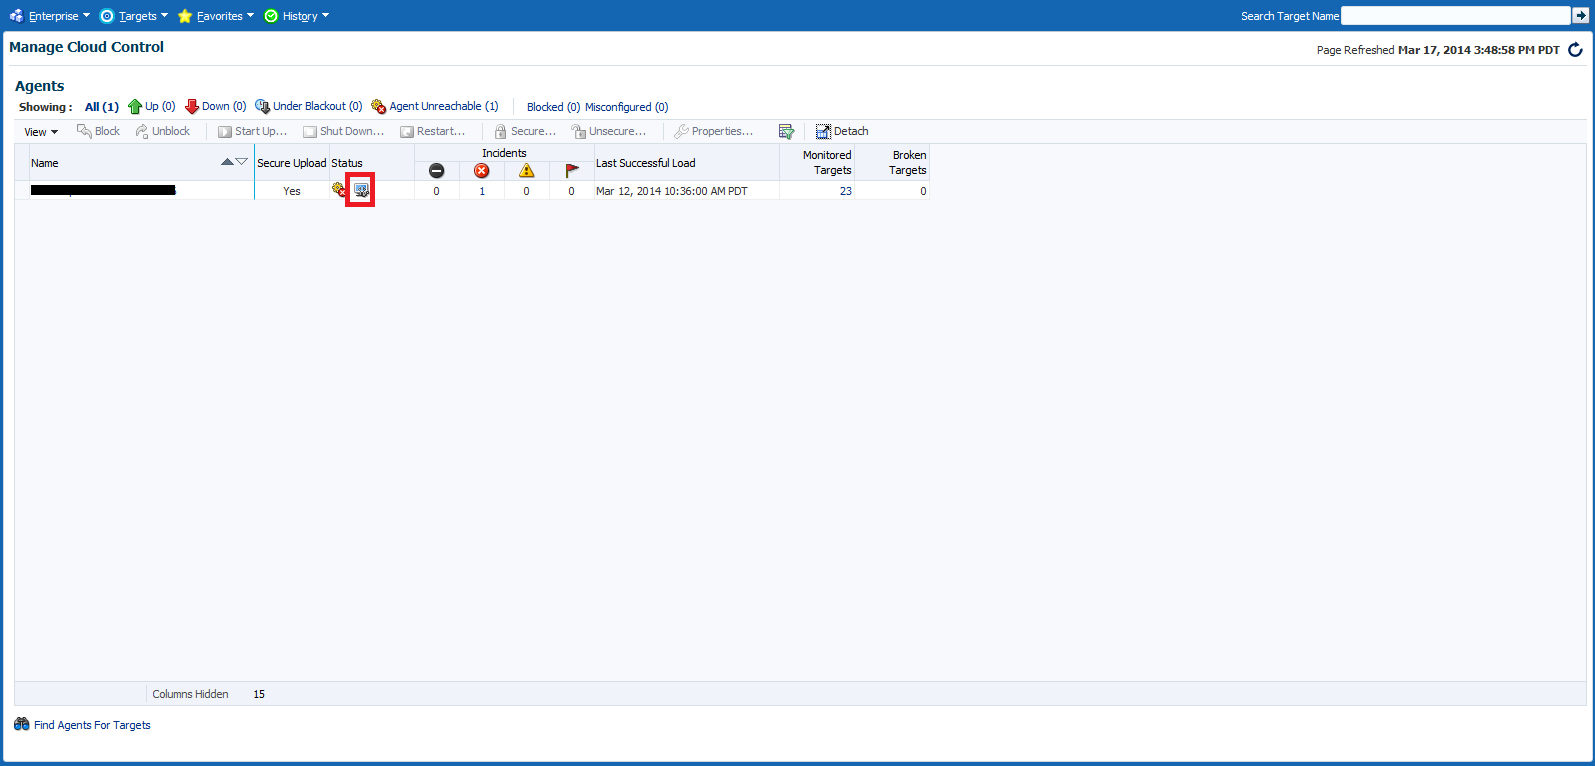
Symptom diagnosis can be performed on the availability of the Agent as well. The icon is displayed in the Agent List and Agent Home pages in the event that the Agent target is unreachable or in pending status.
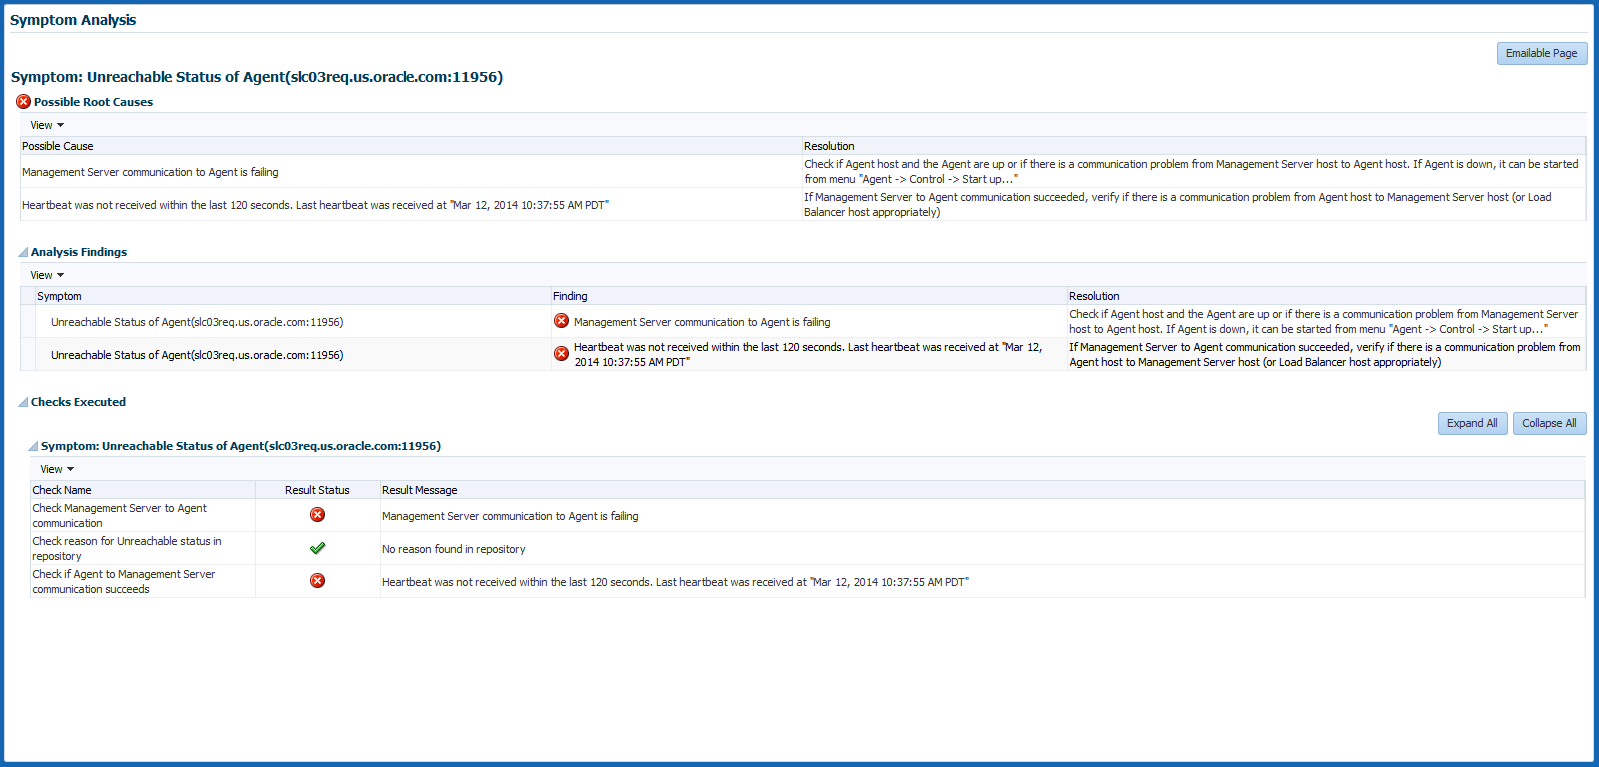
On clicking the icon, the user is navigated to another tab where the details of the diagnosis are presented. The diagnosis indicates the root cause for the Agent's unreachable/pending state, the findings that were deduced from the diagnosis and the checks that were performed to analyze the Agent availability issue.
The checks performed to diagnose the issue consist of the following:
-
if the communication between the Management Service and the Agent is successful
-
if the Agent has communicated with the Management Service
-
if reasons can be deduced from the Repository
-
if further reasons can be deduced by performing checks from the Agent side (whether communication between the OMS and the Agent exists).
Each check is analyzed and the checks that are identified as the top causes are reported as findings. The topmost finding is then reported as the root cause for the performance issue.
Note:
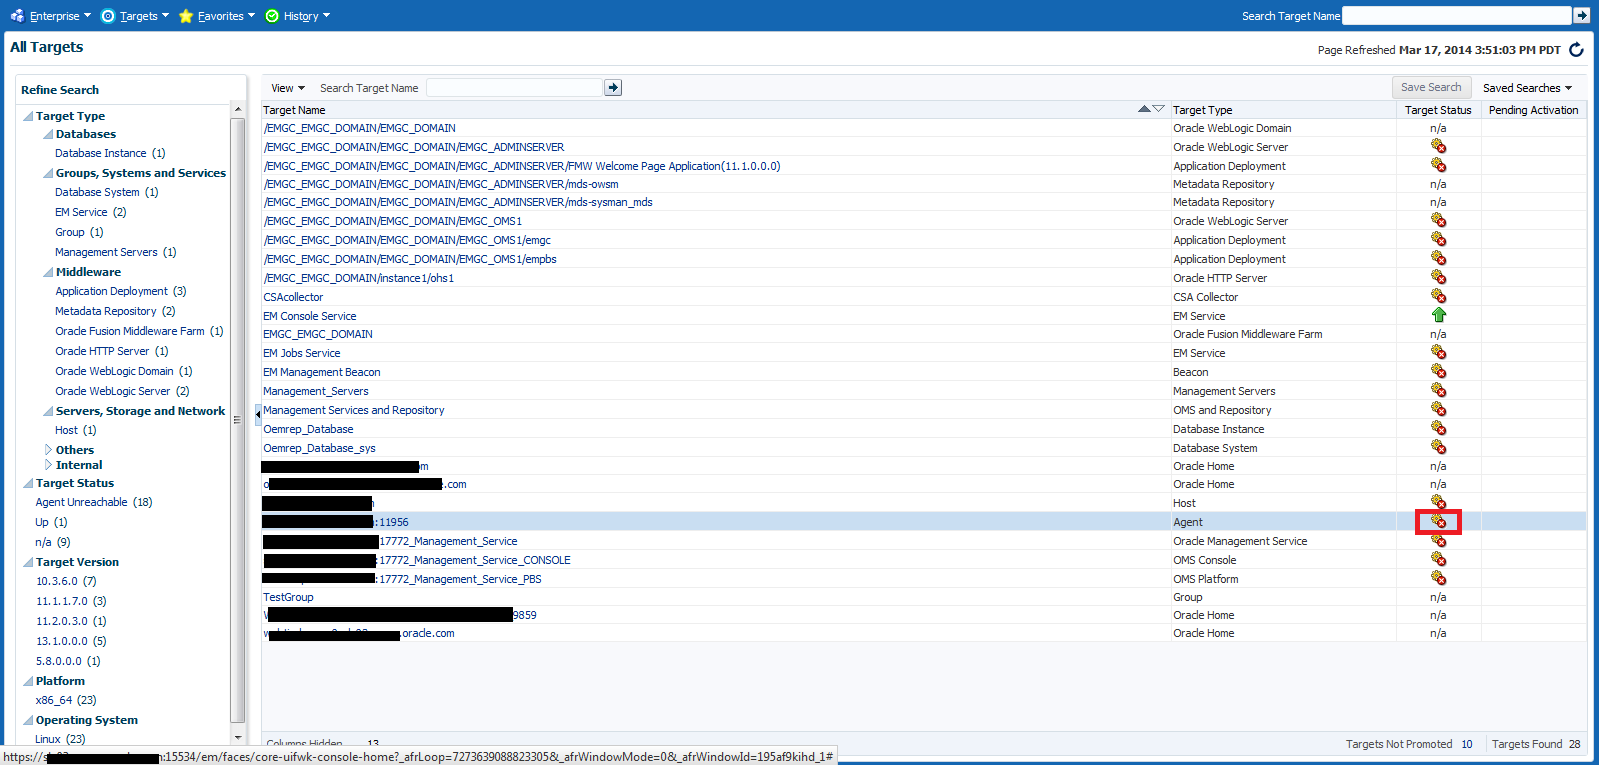
If communication between the OMS and Agent cannot be established, then the diagnosis will report findings based on the data available in Management Repository, which may not be the real cause for the issue.The symptom diagnosis feature is also available in the All Targets page for targets in unreachable or pending status by clicking on the status icon.
14.3 Repository
The Repository page provides you with an overview of the status and performance of the Repository DBMS Jobs that handle part of Enterprise Manager's maintenance and monitoring functionality. These DBMS jobs run within the Management Repository and require no user input. Charts showing the key Repository Details and Backlog in Repository Collection are provided The Scheduler Status region provides the status of the scheduler and the number of Job Queue Processes.
Accessing Repository Information
From the Setup menu, select Manage Cloud Control and then Repository.
Three tabs are displayed providing a comprehensive view of repository attributes, performance, as well as access to requisite operational parameters.
14.3.1 Repository Tab
As shown in Figure 14-10, the Repository tab provides a comprehensive snapshot of repository-specific monitoring.
The Repository Details region provides high-level database information for the Enterprise Manager repository. From this region, you can click on the number Management Service Repository Sessions details to view the exact number of repository connections per individual Enterprise Manager subcomponent such as the event system, console, job system, or connector framework.
The Incidents and Problems region displays all incidents an problems associated with the repository database. For more detailed incident or problem information, you can click on the Summary link to access the issue in Incident Manager.
Initialization Parameter Compliance for Instance
This region displays the currents initialization parameter settings, recommended standards, and whether the current parameter values comply with those standard values.
If you are running the repository in a RAC environment, this region also lets you select individual database instances in order to view initialization parameter compliance for that specific instance.
Repository Scheduler Job Status
The Repository Scheduler Jobs Status region provides details of the DBMS Jobs regarding their status, duration, and the next scheduled run time.
If the Status of a job is down, you can run the job again by clicking Restart Job.
For high-cost jobs requiring greater resources that, when run, can reduce repository performance, an edit icon (pencil) appears in the Edit column. Clicking on the icon displays a dialog allowing you to reschedule the next run time.
Repository Collection Performance
The Repository Collection Performance region provides information on the performance of repository collections. They are collected by background DBMS jobs in the repository database called collection workers.
Repository metrics are sub-divided into long and short running metrics. These are called task classes (short task class and long task class). Some collection workers process the short task class and some process long task class. Repository collection performance metrics measure the performance data for repository metric collections for each task class. This metric is a repository metric and hence collected by the collection workers.
You can select between Short Running and Long Running collection workers. When viewing Short Running workers, you can click Configure to change short worker settings.
Clicking Save submits a job to change the worker configuration. For this reason, the change will not be instantaneous and may require a minute or so in order to take effect.
Clicking on an item in the legend allows you to drill down into Problem Analysis, Metric Details, or the Target Home.
Metric Data Rollup Performance
This region displays the rollup performance by graphically displaying the quantity of data being rolled up (Number of Records Rolled Up) and speed (Throughput per Minute) over time.
The graphs for Number of Records Rolled Up and Throughput per Minute may increase over time as more targets are added, but on a daily basis should remain about the fairly level. Large spikes could indicate that agents are not communicating properly to the OMS
Clicking Configure allows you to change the number of rollup worker threads that will be started.
14.3.2 Metrics Tab
The Metrics tab provides a graphical rollup of key repository performance measurements. Information includes:
-
Top 25 Metric Data Loading Target Types In Last 30 Days
-
Top 10 Data Loading Metrics In Last 30 Days
-
Metric Alerts Per Day In Last 30 Days
-
Top 10 Metric Collection Errors By Target Type In Last 30 Days

The graphs allow you to drill down to access information in greater detail.
Top 25 Metric Data Loading Target Types In Last 30 Days
If you wish to view only metrics for a specific target type, click on a specific metric target type area within the graph. A new graph displays showing only metrics for that specific target type. You have the option grouping the results by metric or target.
Click Clear to return to the original graph containing all target types.
Top 10 Data Loading Metrics In Last 30 Days
Top 10 Metric Collection Errors By Target Type In Last 30 Days
Metric Alerts Per Day In Last 30 Days
The Metric Alerts Per Day In Last 30 Days graphically displays the number of open, closed, and backlogged metric alerts over time. If you wish to focus on a narrower time span, click Zoom.
14.3.3 Schema Tab
The Schema tab provides physical attribute and performance data pertaining to the repository database schema. Information includes:
-
Tablespace Growth Rate
You can select the specific tablespace: MGMT_TABLESPACE, MGMT_ECM_DEPOT_TS, or MGMT_AD4J_TS. Top 20 Large Tables/Indexes are also displayed.
-
Top 20 Tables with Unused Space in Repository
-
Purge Policies
-
Partition Retention
14.4 Controlling and Configuring Management Agents
Beginning with Enterprise Manager Cloud Control 12c, controlling Management Agents can be performed directly from the Enterprise Manager console. This provides a central point where all Management Agents within your monitored environment can be compared, configured and controlled.
14.4.1 Manage Cloud Control Agents Page
The Agents page lists all Management Agents within your monitored environment. This page also includes misconfigured, blocked and both upgradable and non- upgradable Agents.
From the Setup menu, select Manage Cloud Control and then Agents.
Misconfigured and Blocked Agents
A misconfigured Agent is an Agent that is not able to perform a heartbeat or upload data to the Oracle Management Service (OMS) due to invalid configuration or invalid data. Agent misconfiguration alerts are triggered by the following metrics:
-
Consecutive metadata upload failure count
-
Consecutive ping failure count
-
Consecutive severity upload failure count
-
OMS Agent time skew
If the Agent heartbeat or upload requests are failing consistently, and the problem cannot be resolved in a timely manner, you can manually block the Agent to prevent excessive load on the OMS. When you block an Agent, the OMS rejects all heartbeat or upload requests from the blocked Agent. However, even though blocked Agents continue to collect monitoring data, it will not be able to upload any alerts or metric data to the OMS. Once the Agent configuration problem is resolved, you must manually unblock the Agent to resume normal operation.
Note:
Before unblocking the Agent, ensure that all issues related to Agent misconfiguration have been resolved.From this page, you can also initiate the Agent upgrade process. For more information about upgrading Agents see "Upgrading Multiple Management Agents".
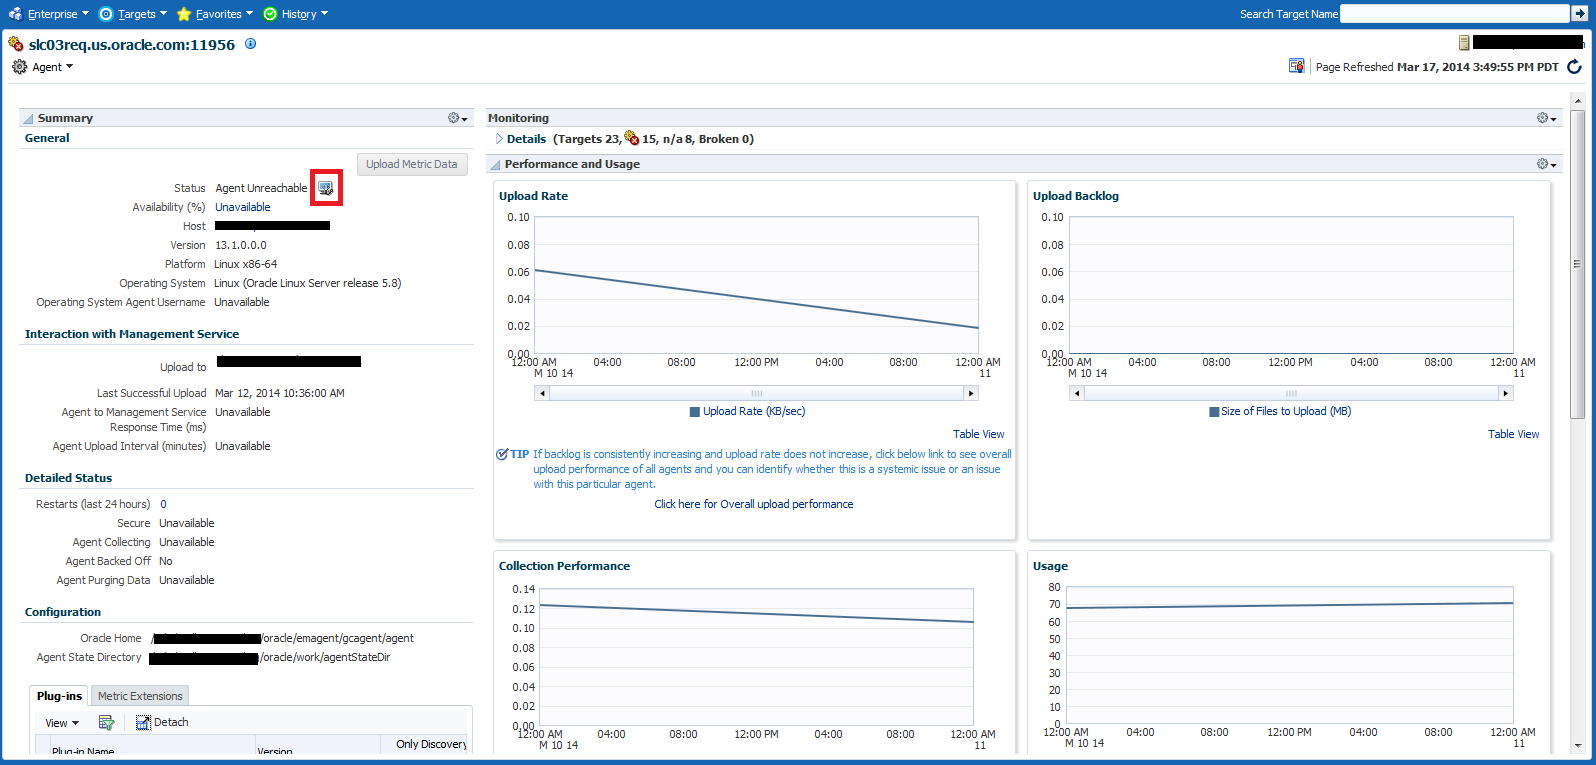
14.4.2 Agent Home Page
The Agent home page provides details for a single Agent. This page also lets you drill down for more detailed information. You can access an Agent home page by clicking on a specific Agent from in the Agent list page or by selecting it from the All Targets page.
-
The Summary region provides primary details of the Agent such as its status and availability. The Interaction with Management Service region provides details on the communication between the OMS and the Agent and metric extensions and management plug-ins deployed in the Agent.
-
The Status region provides further details on the Agent status such as the number of restarts, the action that the Agent is performing currently.
-
The Performance, Usage and Resource Consumption charts provide further details on the Agent in graphical format.
-
The Incidents region lists the incidents recorded for the Agent.
-
The Monitoring region provides details on the targets that are being monitored by the Agent. You can filter targets in this region by All, Broken, and Not Uploading. Separate tabs within the Monitoring section display Metric Issues and Top Collections.
14.4.3 Controlling a Single Agent
Control operations for a single Agent can be performed on the Agent home page for that Agent.
-
Navigate to the desired Agent home page.
-
From the Agent drop-down menu, choose Control and then one of the control operations (Start Up/Shut Down, or Restart)
Note:
You must have at least operator privileges in order to perform Agent control operations.
Upon choosing any of the above control menu options, a pop-up dialog requesting the credentials of the user displays. These operations require the credentials of the OS user who owns the Agent, or credentials of a user who has SUDO or PowerBroker privilege of the Agent owner. At this point, you can either choose from a previously stored username/password, preferred or named credential. You also have the option of choosing a new set of credentials which could also be saved as the preferred credential or as a named credential for future use.
Once you are authenticated, the chosen control operation begins and continues even if the pop-up dialog is closed. Any message of failure/success of the task is displayed in the pop-up dialog.
When choosing the Secure/Resecure/Unsecure options, you must provide the requisite Registration Password.
Agent Control When Using a Server Load Balancer
When choosing the Agent Secure/Resecure options in a multi-OMS environment with a server load balancer (SLB), the Agent will be secured/resecured against the SLB automatically without administrator intervention.
14.4.4 Configuring Single Management Agents
Configuration operations for a single Agent can be performed from the Agent home page. To access the Agent properties page:
-
Navigate to the desired Agent home page.
-
From the Agent drop-down menu, select Properties.
Note:
You must have at least Configure privileges in order to perform Agent configuration operations.
The properties on this page can be filtered to show All Properties, Basic Properties, or Advanced Properties. The Basic Properties are a simple name, value combination of a property and its value. Advanced Properties are also a combination of name and value but can also be grouped into categories. You must have at least configure privileges in order to modify the existing properties and set custom properties.
14.4.5 Controlling Multiple Management Agents
In order to perform control operations on multiple Management Agents, Enterprise Manager makes use of the Job system to automate repetitive tasks. Therefore, you must have Job privileges for controlling multiple Management Agents through a single action. To access
-
From the Setup menu, select Manage Cloud Control and then Agents. The Agent page displays.
-
Select multiple Management Agents from the list.
-
Click one of the control operation buttons (Start Up/Shut Down/Restart/Secure/Resecure/Unsecure).
When you click on any of the control operations, you are taken to the Job creation wizard where you schedule a new job to perform the action on the selected Agents.
In the Jobs page, you can view the chosen Management Agents in Target section in the General tab. You can add more Management Agents by clicking the Add button. You then provide the parameters for the operation in the Parameters tab, if needed. The credentials must be specified in the Credentials tab where you can either choose from a previously stored username/password, preferred, or named credential. You also have the option of choosing a new set of credentials which could also be saved as the preferred credential or as a named credential for future use.You are given the option to start the job immediately or schedule the job for a later time. At this point, you can also create a repeating job by specifying the job start time, the frequency, and the end time.
The Access tab displays the Administrator details and the access levels they have to the job. You can then add a new administrator or modify the access level to View or Full, if you have the requisite privileges.
Note:
Administrators with insufficient privileges can also schedule jobs for these control operations, but in this situation, the jobs will not complete successfully.14.4.6 Configuring Multiple Agents
As with multi-Agent control operations, you can also perform Agent configuration on multiple Agents in the same way. This greatly simplifies standardizing Agent configurations across your enterprise. To access Agent properties:
-
From the Setup menu, select Manage Cloud Control and then Agents. The Agent page displays.
-
Select multiple Management Agents from the list.
-
Click Properties. As with any multi-Agent operation, configuration is implemented using the Job system.
In the Jobs page, you can view the chosen Management Agents in the Target section of the General tab. You can add more Management Agents by clicking the Add button if necessary. In the Parameters tab, you provide the modified value for a particular set of properties that you want to change. You can also set a custom property for the chosen agents. No credentials are required for modifying Agent properties.
The Access tab displays the administrator details and the access levels they have to the job. You can then add a new administrator or modify the access level to View or Full if you have the requisite privileges.
14.4.7 Upgrading Multiple Management Agents
When you upgrade to the current Enterprise Manager Cloud Control 12c release, you upgrade your Oracle Management Services (OMS) to the current release, but not your target Oracle Management Agents (Management Agents). To mass-upgrade your Management Agents, access the Upgrade Agents page. To access this page:
-
From the Setup menu, select Manage Cloud Control, then select Agents.
-
Click Upgradable, then select the Management Agents you want to upgrade.
-
Click Upgrade.
Alternatively, to access the Upgrade Agents page, from the Setup menu, select Manage Cloud Control, then select Upgrade Agent. For more information on upgrading Management Agents, refer Upgrading Oracle Management Agents.
14.5 Management Servers
A Management Server is a composite target consisting of multiple Enterprise Manager Management Services.
The Management Servers page displays the list of Management Services, their status, incidents, the loader throughput, CPU usage, and the JVM memory usage metrics. In addition, the Management Services displayed can be filtered by Normal Mode, Console Only, PBS only and Standby Management Services.
Accessing the Management Servers Page
From the Setup menu, select Manage Cloud Control and then Management Services.
This page consists of the following sections:
-
Summary: Displays the high-level information about WebLogic administration server and Load balancer.
-
Job System: Displays information about the status of jobs over past time periods (such as the last 30 minutes, 1 hour, or 2 hours).
-
Servers: Displays information about individual Management Services of the Management Server.
-
Loader: Displays information that provides insight into the Loader subsystem performance as a whole.
There are primarily 3 graphs as follows.
-
Throughtput (Rows processed per second): Indicates the rate (rows processed per second) at which the Loader is processing files.
-
Files Processed vs Backoff: Indicates the number of files processed versus backed off (rejected) by the Loader. Note: You should contact Oracle Support if consistent backoffs are being generated.
-
% Utilized Capacity: Sows the current Loader CPU utilization. If the Loader consistently runs at more than 85% capacity, contact Oracle Support to confirm whether your system capacity needs to be increased.
To view detailed IP reports of Loader statistics, click the Loader Statistics link located below the graphs.
-
-
Incidents: This displays the incidents and problems that have occurred against individual targets hosting Management Services.