28 Using the MWaaS Self Service Portal
This chapter provides Self Service Application users with instructions on using the MWaaS Self Service Portal to request and monitor middleware services. It contains the following sections:
28.1 Using the MWaaS Self Service Portal
The Middleware Self Service Portal allows self service users to view, monitor, and request middleware services. Users can request middleware services using any of the predefined service templates. They can deploy, undeploy applications, create data sources, scale up, and scale down services with minimal or zero intervention by the self service administrator.
Prerequisites
To view the Middleware Cloud Self Service Portal, log in to Enterprise Manager as a user with EM_SSA_USER role or an user with the EM_SSA_USER_BASE role. Users with these roles must be part of the Middleware Cloud Service Family and must have privileges for the Service Bus, SOA Infrastructure, and WebLogic service types.
To view the MWaaS Self Service Portal, follow these steps:
-
Log into Enterprise Manager as a user with the
EM_SSA_USERrole. -
Select Middleware from the Manage drop down list. The Middleware Cloud Self Service Portal appears.
-
This page contains the following tabs:
-
Home: The Home tab contains the following regions:
-
Notifications: This region shows the number of services that are due to expire in the next 7 days and the number of the services templates published within the last 7 days.
-
Usage: Click the Usage icon to view the total quota (servers and memory) used so far by the SSA user, including all the services that the user has created. This table shows the amount of quota being used by each of your service instances. Your quota includes both the total maximum heap memory and the total number of WebLogic servers you are allowed to use across all of your middleware service instances. This table shows the amount of quota being used by each of your service instances.
Note:
Any non Oracle JVMs that have been added will not be included in the Usage region. -
Services: This region shows the list of middleware services owned by the self service user. For each service, the name, status, service type (Weblogic, SOA Infrastructure, Service Bus, or Java Application Service), resource provider with which the service is associated, policies, date on which the service was created, the expiry date for the service, and non Oracle JVMs (if any) are displayed. You can also view services for which you have been granted privileges.
To request a service, click Request New Service. See Section 28.2, "Requesting a Middleware Service" for details.
You can view the service details by clicking on the Name link to drill down to the Middleware Service Home page.
You can delete a service by selecting a service from the table and clicking Delete.
You can select a service from the table and from the Actions menu, select Start. A request to start the service is submitted.
You can select a service from the table and from the Actions menu, select Stop. A request to stop the service is submitted.
You can grant view, manage, or full privileges over the service instance to other users and roles. You can also revoke privileges that you have granted to other users and roles. See Section 29.4.1, "Granting, Revoking, and Reassigning Privileges to Service Instances".
-
Requests: This region shows a list of all the requests. All requests owned by and shared with the current user are displayed. For each request, the status, type, start date, and submission date of the request is displayed. Click on the request name or the status icon to view the execution details of the request. These details are helpful in troubleshooting a failed request.
Select columns from the View menu to view more details about the request. You can select a scheduled request and click Reschedule to reschedule the request. You can select a scheduled request and click Delete to delete the request. If a request that is scheduled such as Create gets canceled, all other associated requests are also canceled.
-
-
Chargeback: This tab displays all the chargeback break-up data for the service. The charge incurred will be calculated from the service requested date to current date. This page contains the following regions:
-
Charge Trend: This graph show the usage and charge trends over time.
-
Details: You can aggregate the chargeback data for the service by resources of metrics. You can export this data to an external application such as a spreadsheet.
-
Charge Plans: The charge plans that have been assigned to each PaaS Infrastructure Zone are displayed. Select a zone to view the pricing. The rate for each metric in the zone for a specific time period is displayed.
For details on setting up the Chargeback Service, see Chapter 43, "Chargeback Administration".
-
-
Library: This tab displays a list of Java EE application components that are available to the SSA user. You can do the following:
-
Upload: You can upload a new Java EE application component to the Software Library. See Section 28.6, "Uploading a Java EE Component to the Software Library" for details.
-
Delete: Select a Java EE component from the list and click Delete to remove it from the library.
-
Share / Stop Sharing: You can share a component with one or more users and roles. Select the component and click Share. The Select and Share: Users and Roles window appears. From the Type drop list, select User or Role and click Search. The users or roles with which the component can be shared. Select one or more users or roles and click Share. The selected component is shared with the specified users and roles. To stop sharing the component, select the component and click Stop Sharing.
-
-
Policies: Click the Policies tab to view the list of policies that you have defined. You can create a new Performance or Schedule Based Policy or a Policy Group for one or more middleware services and define Scale Up or Scale Down on these policies. See Section 28.1.2, "Defining Dynamic Elasticity Policies for Middleware Services".
-
28.1.1 Setting the Preferences
Click the Preferences link in the top right hand corner of the page to set up your preferences such as the Default Service Type, Default Email Address for Notifications, Default Locale, Default PaaS Infrastructure Zone, and so on. To set the Middleware Cloud Self Service Portal as the default page that appears when you log in to the Self Service Portal, select Middleware in the Default Service Type drop down list and click Apply. For more details on setting the preferences, see Section 8.9, "Viewing Preferences".
28.1.2 Defining Dynamic Elasticity Policies for Middleware Services
Note:
These policies are applicable only for the WebLogic Service type.To define a policy, follow these steps:
-
Log into Enterprise Manager as a user the
EM_SSA_USERrole. -
Click the Policies tab.
-
To create a policy, from the Create menu, you can select either of the following:
-
Schedule Based Policy
-
Performance Based Policy
-
28.1.2.1 Creating a MWaaS Schedule Policy
For instance, if you want to create a schedule based policy that states that a middleware service must be scaled up every Monday, follow these steps:
-
From the Create menu, select Schedule Policy. The following page appears:
-
Enter a name and description for the policy.
-
In the Policy Action field, select Scale Up and enter 2 as the Value in the Action Parameters field.
-
In the Start field, specify the date from which this policy must be effective.
-
In the Repeat field, select Specify Days of the Week and in the Days of the Week field, select Monday. Thus the service will be scaled up by 2 every Monday.
-
Click OK to create the policy. You will return to the Policies page where the policy you have defined will appear in the Policies table. To apply these policy for a target, click Add in the Associations region and select a target with which this policy must be associated.
28.1.2.2 Defining a MWaaS Performance Policy
Performance policies are formed based on the performance metrics of a specific target type and its associated targets. You can create conditions and rules for the policy based on the metrics. To define a performance policy, follow these steps:
-
Click the Policies tab in the Middleware Self Service Portal. The Policy page appears.
-
Click Create and select the Performance Policy type.
-
In the General Information page, enter the name and description of the policy.
-
In the Rules and Relationships page, select a metric from the right panel and click Add to Definition. Specify the condition, value, and number of occurences.When these conditions are met, the policy is executed.
-
Click Next. The Create Performance Policy: Rules page appears. The policy rule is displayed.
-
Select Scale Up or Scale Down from the Action drop down list.
-
In the Action Parameters field, enter a value next to the Number of WebLogic Servers. The value specified here is used to either increment or decrement the Number of WebLogic Servers depending on the Action selected.
-
Click Next. The Create Performance Policy: Review page appears. Review the policy details and click Save the policy and return to the Middleware Service Portal: Policies page.
-
In the Associations region, click Add and select one or more targets to be associated with this policy. The associated targets are listed in the Associations region.
Click on the target link to view a list of policies associated with the target. Once the targets have been associated, the policy is activated. Click View History to view the policy action history.
28.2 Requesting a Middleware Service
You can use the Request New Service option to request a new middleware service. You can request the following types of middleware services:
-
WebLogic Service, see Section 28.2.1
-
SOA/OSB Service, see Section 28.2.2
28.2.1 Requesting a WebLogic Service
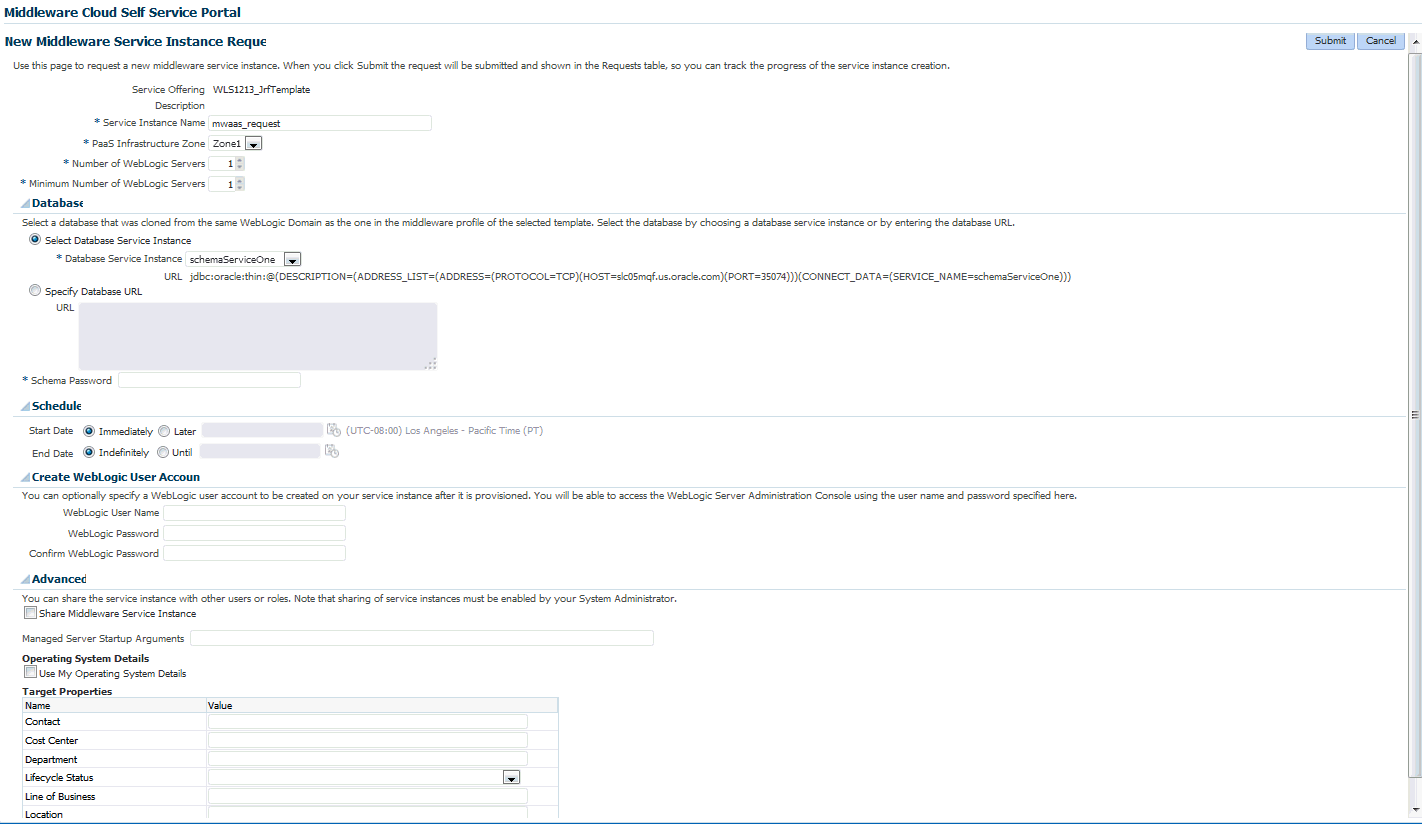
You can request a new WebLogic service on this page.
To request a service, follow these steps:
-
Click Request New Service in the Home page of the Middleware Cloud Self Service Portal.
-
The Request New Service window appears. A list of service templates available to the self service user is displayed. Choose a WebLogic service template and click Select to launch the New Service Request page.
-
Enter a name for the service and select the PaaS Infrastructure Zone in which the new service is to be deployed.
-
If the service template you have selected in based on a profile that contains a cluster with one or more WebLogic servers, in the Number of WebLogic servers field, specify the initial number of servers that can be present in the new service instance.
Note:
The Number of WebLogic servers you specify here cannot be less than the number of servers specified in the profile. -
In the Minimum Number of WebLogic Servers field, specify the minimum number of WebLogic servers that must be present in the middleware service instance. The value specified here must be less than or equal to the value specified in the Number of WebLogic Servers field.
-
In the Database region, select the database that was cloned from the same WebLogic domain as the one in the Middleware profile of the selected template.
Note:
The Database region is displayed only if the selected template is based on a JRF enabled profile (12.x or later versions).You can:
-
Select Database Service Instance: Select this option and choose a Database Service Instance from the drop down list.
-
Specify Database URL: Enter the URL for the database.
-
Schema Password: Enter the schema passwor.d
-
-
Specify the schedule for the service request.
-
Start Date: You can choose Immediately (request is executed immediately) or Later. If you select the Later option, specify the date from which the service is to be available.
-
End Date: Select Indefinitely to make the service available for a indefinite period of time. If you select Until, specify the date on which it will be deleted and no longer available.
-
-
In the Create WebLogic User Account (optional) region, you can optionally specify a WebLogic user account to be created on your service after it is provisioned. Enter the WebLogic User Name and WebLogic Password. You will be able to access the WebLogic Server Administration Console using the user name and password specified here.
Note:
The Create WebLogic User Account will appear only if the Expose WebLogic Admin Console and Fusion Middleware Control to SSA User field was set to Yes when the template was created. -
If the self service administrator has granted access to the Advanced Settings in the service template, you will see the Advanced region here. You can specify the following:
-
Share Middleware Service Instance: Select this checkbox to share the service instance with other users and roles. The Add region appears. Click Add and in the Grant Privilege window, select the user or role to which the privilege is to be granted. From the Privilege to Grant drop down list, select the privilege you want to grant which can be View, Manage, or Full and click Grant.
Note:
Privileges must be explicitly granted by the self service administrator through the Request Settings option. See Section 29.4.1, "Granting, Revoking, and Reassigning Privileges to Service Instances" for details. -
Managed Server Startup Arguments: Specify the memory and Java system property arguments that are to be used when starting all the managed servers in the middleware service instance. For example, you can specify:
-Xms1280m -Xmx1280m -XX:PermSize=128m -XX:MaxPermSize=256m -Dweblogic.security.SSL.ignoreHostnameVerification=trueThese parameters will override the value specified in the service template.
-
Operating System Details: Select this checkbox to specify custom operating system credentials. You need to specify the following:
-
Domain Home Base Directory: Specify the base directory in which the instance is to be created. The path specified here will override the path specified in the middleware pool.
-
User Name: The operating system user name with privileges to write to the specified base directory.
-
Password: The password for the operating system user.
Note:
Default values for the user name and password can be set using the Preferences option on the Middleware Self Service Portal page. If these values are set, they will be displayed here.
-
-
-
Specify the target properties for the service instance.
-
Click Submit to create the service request. This request will now appear in the Requests table in the Home page of the Middleware Self Service Portal. You can monitor the status of this request in this table. When the request has been completed, you can refresh the page to view the new service in the Services table.
28.2.2 Requesting an Oracle Service Bus or SOA Infrastructure Service
Log in with SSA_USER role to view, monitor, and request for SOA/OSB services using the Middleware Self Service portal.
Prerequisite
Oracle recommends that the database is cloned using DBaaS. If database is cloned using another SSA User account (for example, user1), then user1 needs to grant access on the database service instance to user2, assuming user2 is requesting for SOA / OSB instance.To request for a service, follow these steps:
-
On the Middleware Cloud Self Service Portal, click Request New Service.
-
The Request New Service dialog box appears. A list of service templates available in the zones that the SSA user can access, is displayed. Choose a service template and click Select to launch the Service Request page.
-
On the General page, enter a name for the service, and select the PaaS Infrastructure Zone in which the new service is to be deployed.
-
Specify the schedule for the service request.
-
Start Date: Choose Immediately (request is executed immediately) or Later. If you select Later, specify the date from which the service is to be available.
-
End Date: Select Indefinitely to make the service available for a indefinite period of time. If you select Until, specify the date on which the service will be deleted, and no longer available.
-
-
On the Configuration page, provide the following details:
-
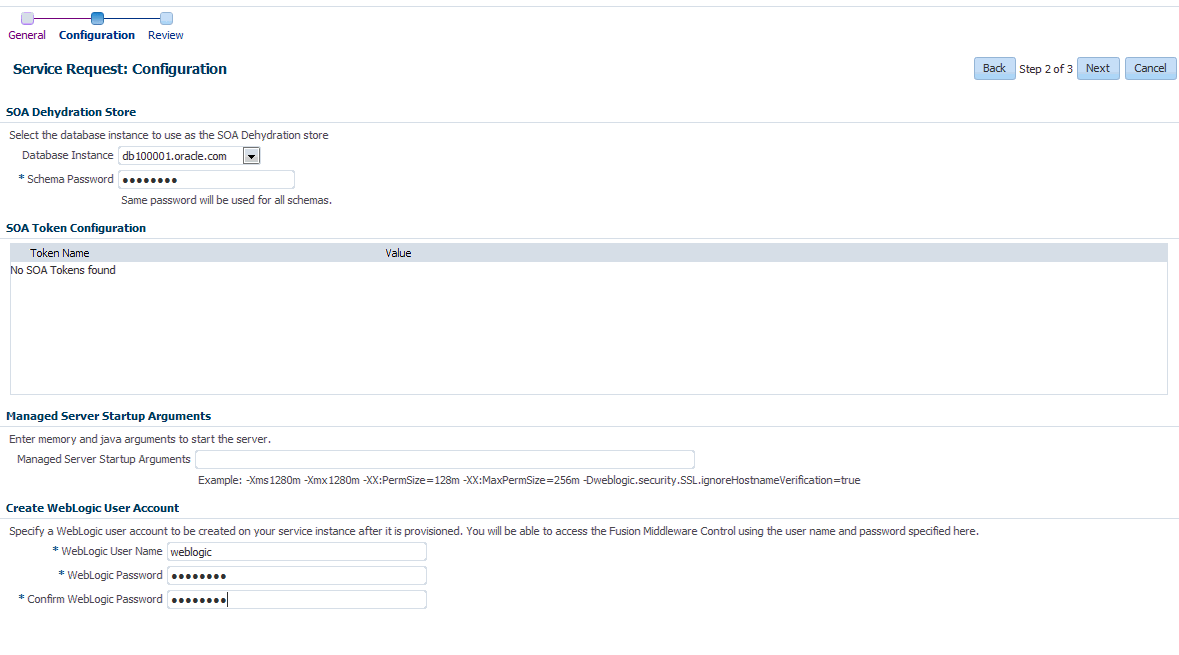
For a SOA Service Template
-
In the SOA Dehydration Store section, select a database that you want to use as SOA Dehydration Store, and provide the schema password.
The following options are possible: You can select a database which is cloned using DBaaS RMAN Backup option, or a database which is cloned outside DBaaS but discovered in Cloud Control. If you use the latter option, then after discovering the database, you must grant view privileges on the Database target to the SSA User.
-
In the SOA Token Configuration section, click the Value field to customize the SOA token values.
-
In the Managed Server Startup Arguments, enter the memory and java arguments to start the managed server.
-
-
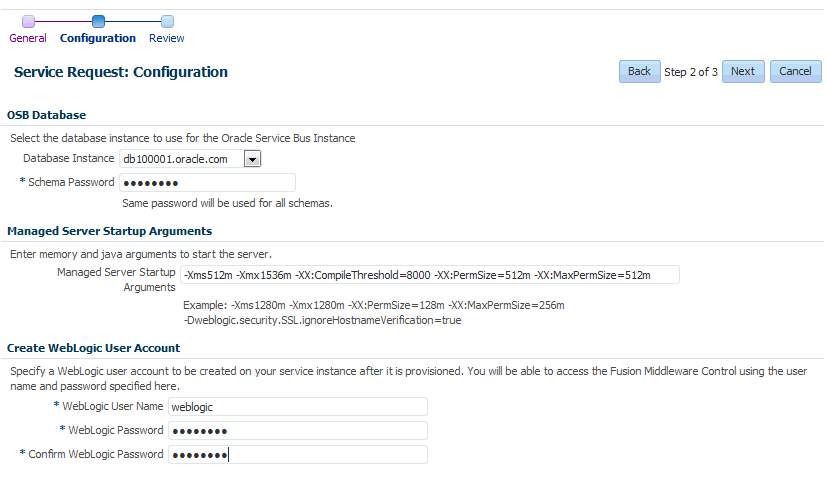
For an Oracle Service Bus Template:
-
Select the database instance and provide the OSB schema password.
-
-
-
In the Create WebLogic User Account region, specify a WebLogic user account to be created for your service after it is provisioned. Enter a WebLogic User Name and WebLogic Password. These credentials will be used to access the WebLogic Administration Server console and the Fusion Middleware Console.
In addition to this, for an OSB service instance, the credentials you have provided in this section, can you used to access the OSB Console.
Click Next.
-
On the Review page, review all the configuration details.
-
Click Submit to create the service request. This request will now appear in the Requests table in the Home page of the Middleware Self Service Portal. You can monitor the status of this request in this table.When the request has been completed, you can refresh the page to view the new service in the Services table.
28.3 Viewing the Middleware Service Home Page
The Middleware Service Home page provides detailed information about the services you have requested using the Request Service option. To view the Middleware Service Home page, click the Name link in the Middleware Services region in the Middleware Cloud Self Service Portal: Home tab. This page contains the following regions:
-
Performance Summary: Shows the availability status of the service, status summary of the WebLogic Servers, and the performance metrics for the underlying WebLogic cluster associated with this service. The following charts are displayed.
-
Availability: The availability status of the service.
-
Resource Usage: Shows the CPU and Heap Usage charts for all the servers in the cluster.
-
Response and Load: Shows the request processing time and number of requests per minute for the current service.
-
General: Shows charts for various performance metrics for the service.
-
-
Deployments: This region is displayed only for WebLogic services. It contains the following:
-
Applications: Lists all the applications deployed to this service. For each application, the name, status, and the key metrics such as Active Sessions, Request Processing Time, and Request per Minute are displayed. Click the Name link to drill down to the Application Home page. You can do the following:
-
Deploy: Click Deploy to deploy the application to the service. See Section 28.3.1, "Deploying and Redeploying an Application" for details.
-
Delete: Select an application and click Delete to undeploy an application.
-
Redeploy: If you have an updated Java EE application component, you can select the application and click Redeploy to redeploy the application. See Section 28.3.1, "Deploying and Redeploying an Application" for details.
-
Start / Stop: Select an application and click Start or Stop to start or stop the application.
-
Test: Select an application and click the Test icon. A list of URLs is displayed in the Application URLs dialog box. Click the URL to navigate to the associated page.
-
-
Libraries: If any applications have been deployed as libraries, they are listed here.You can do the following:
-
Deploy: Click Deploy to deploy the application to the service. See Deploying an Application for details.
-
Delete: Select an application and click Delete to undeploy an application.
-
Redeploy: If you have an updated Java EE application component, you can select the application and click Redeploy to redeploy the application.
Note:
If you select a library that is being referenced by an application, the Redeploy and Delete buttons are disabled and this library cannot be deleted or redeployed.
When deploying using the Self Service Portal you can create the deployment as a normal application or a library. Libraries are deployments that can be shared with other deployments. The Middleware Service home page shows normal applications in the Applications table and libraries in the Libraries table. Libraries may be deleted and redeployed, but only if they are not being referenced by any applications.
-
-
-
Data Sources: This region is displayed only for WebLogic services. It shows all the data sources that are available for this service. For each data source, the Name, Database Service Name, JNDI name and the URL for the database is displayed. If the data source has been created using a database service, the name is displayed in the Database Service column. Click on the name to drill down to the Database Service Home page. You can create new data sources, edit or delete existing data sources, and test the connection of any specified data source.
-
Requests: This table shows all the requests that have submitted for this service. These include requests such as Deploy, Undeploy, Redeploy, Scale Up, Scale Down, Start, Stop, Create, Edit, and Delete Data Source.
The following options are available from the Middleware Service Instance menu:
-
Set End Date: Select this option to specify an end date for the middleware service. You can set the end date for a service. Select a service from the table and click Set End Date. In the popup window that appears, you can specify a new End Date for the middleware service instance. If you do not want the service to expire, select Indefinitely and click OK.
-
Start and Stop: You can start or stop the service by selecting the appropriate option from the Middleware Service menu.
-
Scale Up and Scale Down: See Section 28.3.2, "Scaling Up and Scaling Down a Service".
-
Service Instance Settings: This shows the current value of the Minimum Number of WebLogic Servers and allows you to modify this value.
-
Select Metrics: Click Select Metrics to add new charts, remove existing ones, and drag and drop metrics to charts. In the Metric Palette window that appears, select a metric or drag and drop a metric into an existing chart or create a new chart. By default, all new charts are displayed in the General section but you can drag and drop them to a different section. You can remove a metric/chart by unchecking a box in the Metric Palette or by clicking the x on the drag bar on the right side of the chart. You can move charts within their section by dragging them by that bar.
-
Restore Default Charts: Click Restore Default Charts to restore the charts to the default settings. All chart additions, modifications and deletions are applicable to a specific service. An SSA user can have different charts for each service.
-
Log Messages: Click Log Messages to view a list of messages sorted by message type, date, and so on. Select the date range, message type, and specify other filters in the Message field. Click Add Fields, select other fields to be included in the message, and click Search. The first 1000 messages that meet the search criteria are displayed. Click Export Messages to File to export the messages to a log file in
.txt,.xml, or.csvformat. -
WebLogic Server Administration Console: Click this option to launch the WebLogic Administration Console.
-
Fusion Middleware Control: Click this option to launch the Fusion Middleware Control console.
Note:
The WebLogic Server Administration Console and the Fusion Middleware Control interfaces allow you to manage and monitor the Oracle Fusion Middleware components. The WebLogic Server Administration Console and Fusion Middleware Control options are available in the Middleware Service menu only if the Expose WebLogic and FMW Console URLs to SSA User field has been set to Yes in the Middleware Service Template. See Section 25.6, "Creating a WebLogic Service Template" for details.
-
28.3.1 Deploying and Redeploying an Application
You can deploy a preconfigured Java EE application to a Service Instance. To deploy an application, follow these steps:
-
Log into Enterprise Manager as a user with the
EM_SSA_USERrole and navigate to the Middleware Cloud Self Service Portal page. -
Click on a Name link in the Middleware Services region. The Middleware Service Home page appears.
-
Click Deploy in the Applications table. The Deploy Application page appears.
-
Enter the following details:
-
Application Name: Enter a name for the application that is to be deployed.
-
Application Component: You can choose to:
-
Select an application component from the Software Library: Click the Search icon and select a Java EE application component from the Software Library.
-
Select an application archive from your desktop. Click Browse and select an application archive from your desktop.
-
-
Deploy as an application: The deployment can be created as a normal application or as a library. If you select this option, click Browse in the Deployment Plan field and select a
.xmlfile that contains the deployment options. This file overrides the deployment plan (if any) specified with the application component. -
Deploy as a library: You can deploy the application as a library. Libraries are deployments that can be shared by other deployments. Libraries should be available on all of the targets running their referencing applications.
-
-
Specify when the deploy operation should occur and click Deploy. After the request to deploy the application has been created, you will return to the Middleware Service Home page where a confirmation message is displayed.
28.3.1.1 Redeploying an Application
You can redeploy an application that has been deployed to a Service Instance. To redeploy an application, select a deployed application from the Applications table and click Redeploy. In the Redeploy Application page, select the Application Component that is to be redeployed, the deployment plan if any, and click Redeploy. You will see a confirmation message indicating that the application has been redeployed.
28.3.2 Scaling Up and Scaling Down a Service
You can scale up or scale down a service.
Note:
The Scale Up and Scale Down options are available only if the service is based on a middleware service template that contains a middleware provisioning profile with one cluster. If the profile does not contain a cluster, these menu options will not be available.On the Middleware Service Home page, select the following options from the Middleware Service menu:
-
Scale Up: You can scale up a service by adding one more servers. The number of servers you can add is limited by your quota. Click Scale Up and enter the number of servers by which the service is to be scaled up. Click Submit to submit the scale up request and add more servers.
-
Scale Down: Click Scale Down and enter the number of servers by which the service is to be scaled down. Click Submit to submit the scale down request and reduce the number of servers.
28.3.3 Creating a Data Source
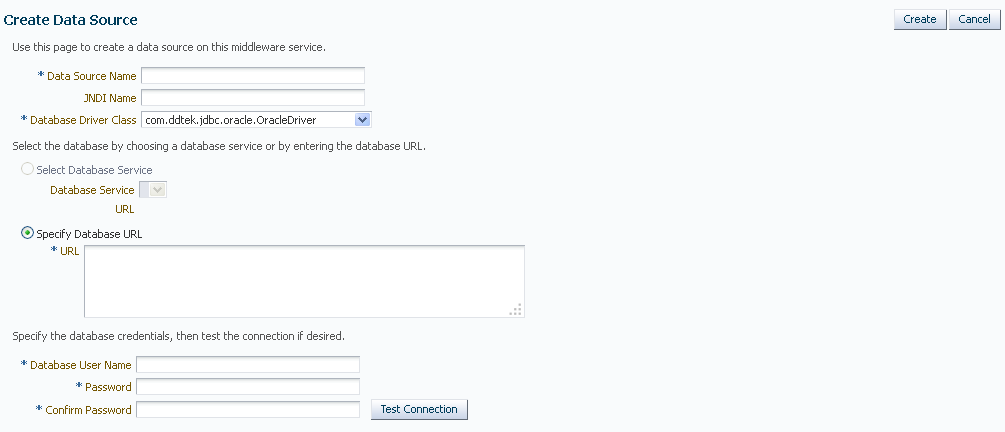
In a WebLogic Server, you configure database connectivity by adding data sources to your WebLogic domain. WebLogic JDBC data sources provide database access and database connection management. Before an application can access a database, it must be configured to use the JDBC data source.
To create a data source for a service, follow these steps:
-
Log into Enterprise Manager as a user with the
EM_SSA_USERrole and navigate to the Middleware Cloud Self Service Portal page. -
Click Create in the Data Sources table in the Middleware Service Home page. The Create Data Source page appears.
-
Enter the Data Source Name and the JNDI Name.
-
Select the Database Driver Class.
-
If you have a database service instance configured, you can select the Database Service and the corresponding URL is displayed. If not configured, you must manually enter the Database URL.
-
Specify the Database User Name and Password.
-
Click Create to create the data source.
28.3.3.1 Editing a Data Source
You can edit the properties of a data source. Click the Name link in the Data Sources table in the Middleware Service Home page. The Edit Data Source page appears. You can edit the properties of the data source. If some of the properties are changed, the data source needs to be redeployed and applications using this data source need to be restarted.
28.4 Viewing SOA/OSB Service Home Page
The SOA Home page provides detailed information about the services you have requested using the Requests option. To view the Middleware Service Home page, click the Name link in the Middleware Services region in the Middleware Cloud Self Service Portal: Home tab.
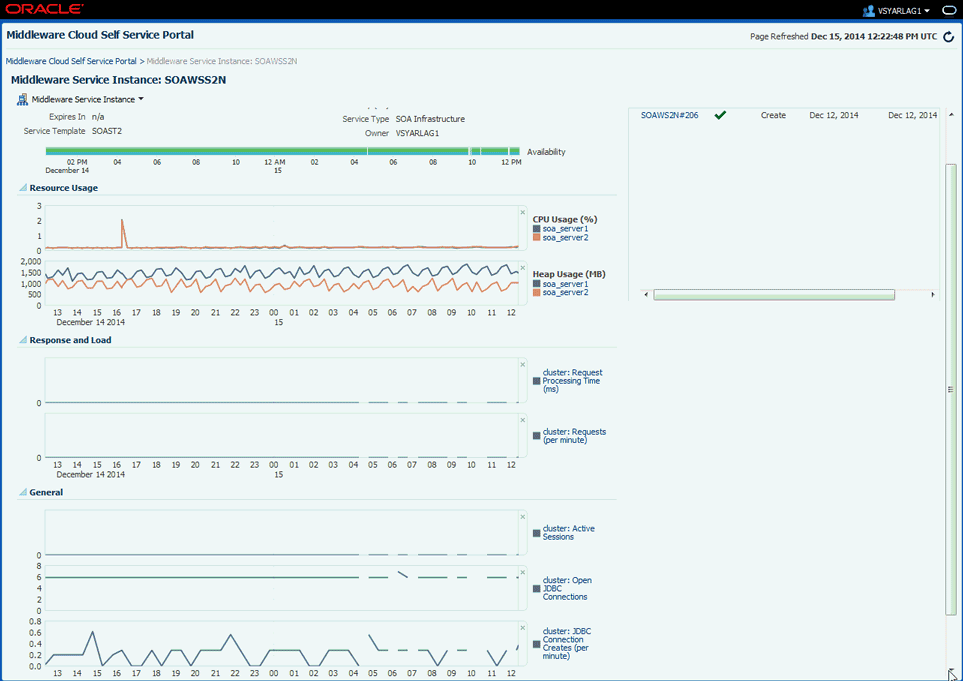
This page contains the following regions:
-
Performance Summary: Shows the availability status of the service, status summary of the WebLogic Servers, and the performance metrics for the underlying WebLogic cluster associated with this service. The following charts are displayed.
-
Availability: The availability status of the service.
-
Resource Usage: Shows the CPU and Heap Usage charts for all the servers in the cluster.
-
Response and Load: Shows the request processing time and number of requests per minute for the current service.
-
General: Shows charts for various performance metrics for the service.
-
-
Requests: This table shows all the requests that have submitted for this service.
The following options are available from the Middleware Service Instance menu:
-
Set End Date: Select this option to specify an end date for the middleware service.
-
Start and Stop: You can start or stop the service by selecting the appropriate option from the Middleware Service menu.
-
Scale Up and Scale Down: See Section 28.3.2, "Scaling Up and Scaling Down a Service".
-
Select Metrics: Click Select Metrics to add new charts, remove existing ones, and drag and drop metrics to charts. In the Metric Palette window that appears, select a metric or drag and drop a metric into an existing chart or create a new chart. By default, all new charts are displayed in the General section but you can drag and drop them to a different section. You can remove a metric/chart by unchecking a box in the Metric Palette or by clicking the x on the drag bar on the right side of the chart. You can move charts within their section by dragging them by that bar.
-
Restore Default Charts: Click Restore Default Charts to restore the charts to the default settings. All chart additions, modifications and deletions are applicable to a specific service. An SSA user can have different charts for each service.
-
Log Messages: Click Log Messages to view a list of messages sorted by message type, date, and so on. Select the date range, message type, and specify other filters in the Message field. Click Add Fields, select other fields to be included in the message, and click Search. The first 1000 messages that meet the search criteria are displayed. Click Export Messages to File to export the messages to a log file in
.txt,.xml, or.csvformat. -
WebLogic Server Administration Console: Click this option to launch the WebLogic Administration Console.
-
Fusion Middleware Control: Click this option to launch the Fusion Middleware Control console.
-
Note:
The WebLogic Server Administration Console and the Fusion Middleware Control interfaces allow you to manage and monitor the Oracle Fusion Middleware components. The WebLogic Server Administration Console and Fusion Middleware Control options are available in the Middleware Service menu only if the Expose WebLogic and FMW Console URLs to SSA User field has been set to 1 in the Middleware Service Template. .28.5 Viewing the Java Application Service Instance Home Page
The General section displays a URL that can be used to access your service. Click Download JVMD Agent to download the JVM Diagnostics Agent war file. Ensure that you deploy the war file on the WebApps folder of the Application Server that is to be monitored. This enables the JVM Diagnostics Agent to start monitoring the Java Application target in Cloud Control.
The Java Application Service History section provides a quick view of the event log for your application, along with the time stamp. Basically details like when a particular application starts or when it was created, is captured and logged in this section.
Parameters that are printed to the service.out file is displayed in the Service Details section. This is particularly useful, when you want to view the port numbers assigned to the JVM JMX port.
In addition to this, memory usage and performance summary details are also available on this page.
28.6 Uploading a Java EE Component to the Software Library
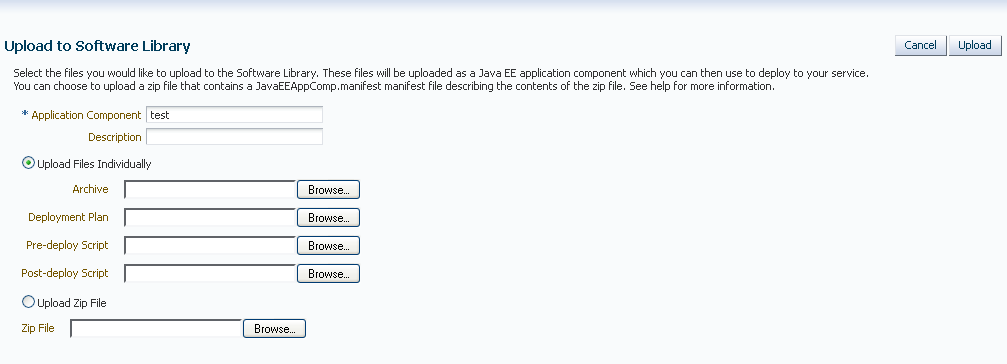
You can upload pre-configured ear, war, jar, or rar files to the Software Library. These files are uploaded to the Software Library as Java EE Application components, which are then deployed to your service. To upload a file to the Software Library, click the Library tab. The Upload to Software Library field appears.
Enter the name and description of the file being uploaded. You can then choose to upload files as follows:
-
Individual Files: If you choose the Upload Files Individually option, you need to specify the following:
-
Archive: Select the archive file to be uploaded to the Software Library. This can be an
ear,war,jar, orrarfile. You can also optionally specify the following:-
Deployment Plan: This is an
xmlfile containing the deployment options for the Java EE Application component. -
Pre Deploy Script: This is a script containing WLST commands. The Management Agent runs this script on the Administration Server associated with each instance before the application is deployed. You can use this script to create data sources, JMS end points, and any other resources that might be needed by the application that is being deployed.
-
Post Deploy Script: This is a WLST script that is executed by Management Agent on the Administration Server after the application is deployed. You can use this script to perform any post deployment configuration. For example, if you need to roll back and undo the changes made by the pre deploy script, you can select this option.
-
-
-
Zip File: If you select the Upload Zip File option, you must upload a zip file that contains the
JavaEEAppComp.manifestfile that describes the contents of the zip file.
Click Upload to upload the file to the Software Library.
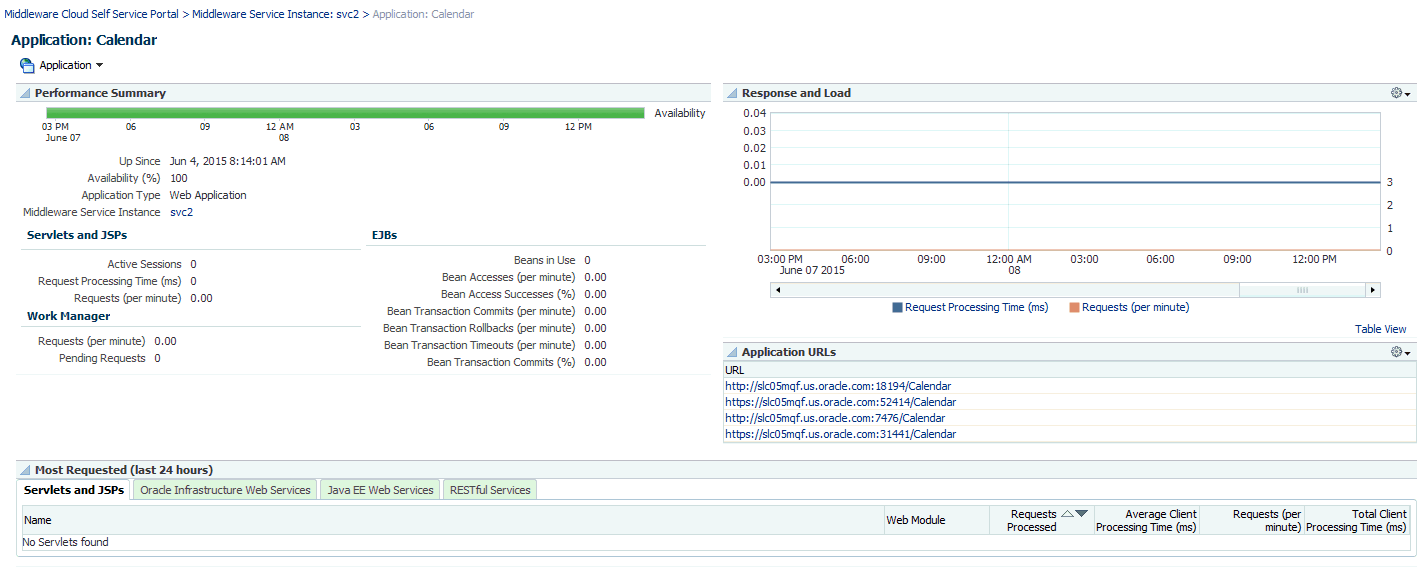
28.7 Viewing the Application Home Page
To view the Application Home page, select an application, and click the Name link in the Applications table on the Middleware Service Home page.
This page displays performance and availability for the application, along with a chart that shows response and load. You can redeploy, delete (undeploy), start, or stop the application using options from the Application menu.

