Getting to Know the Management Console
The Business Transaction Management console displays information about the objects known to the sphere and allows you to access tools for monitoring and managing these objects. The information is presented using different types of views; these include dashboards, charts, maps, graphs, and tables. This section introduces the main areas of the console: the Navigator, the main area, the tabs area, and the main menu.
When you first install Business Transaction Management, the console offers you a set of default views of the objects in the sphere. You can create additional views and save these views to make it easier to access the objects and instruments that interest you. In addition, you can use the custom data explorer to view any object in the system in relationship to any other object.
After you have read through this section, continue reading through the rest of this chapter to learn about the following:
-
controls used in each type of view
-
interpreting default views
-
modifying views
-
creating new views
In addition to using the console, you can also use the Business Transaction Management Command Line Interface (CLI) to issue management commands from the command line or through the use of scripts. You use CLI commands to configure the system, manage DNS aliases, resolve replication issues, register services, manage metadata, control monitoring, apply policies, migrate data, or generate data needed for reporting.
General Console Design
The figure below shows the main areas of the management console.
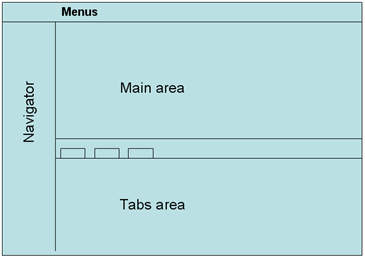
Description of the illustration audi_console_areas.gif
The following sections describe each area in some detail. Here is a brief summary:
-
The Navigator provides a list of views that are available by default. Selecting one of these items displays all objects of this type in the main area.
-
The main area displays the view selected in the navigator. Double clicking any item in the main area opens the tabs area if it is not already opened, and displays detailed information about that item. The main area includes controls at the top that you can use to filter the objects displayed.
-
The menus provide actions that you can perform on the item selected in the main area, or it provides actions unrelated to the selected item, like creating a new object, or performing some administrative action.
-
The tabs area provides additional information about the item selected in the main area.
The Navigator
The navigator is a facilitator that allows you to quickly get to the objects and relationships that interest you. The default navigator sections are the following (they are normally displayed in their expanded form):
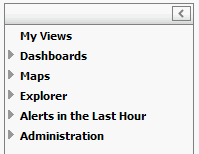
Description of the illustration navigator_abbrev_audi.gif
The navigator includes two kinds of controls:
-
A minimizing control (arrow) in the upper right hand corner. Click this control to collapse the Navigator, which allows more room for the main area.
-
Expansion controls (triangles) to the left of each view name that you can click to expand and view category contents.
Note that each item in the Explorer view contains a numeric value in parenthesis; this indicates the number of such objects known to the sphere. If you were to filter the corresponding main view to show fewer items, the number shown in the Navigator would remain unchanged.
The table below summarizes the contents of the default Navigator categories.
| Category | Description |
|---|---|
| My Views | A list of any views you have modified or created that you have saved. |
| Dashboards | A dashboard is a heterogeneous view comprised of smaller views, typically used to summarize information of interest. It provides a summary view of the state of the system and monitored objects.
By default, the console provides three dashboards: one that summarizes the operational health of the system, and two that provide summary information for the top ten services and transactions. |
| Maps | Graphical views of services and their dependencies, and of containers. |
| Explorer | Tabular views of monitored and non-monitored objects and their relationships. Also includes the custom data explorer, which allows you to view any object in the sphere in relation to other objects. |
| Alerts in the last hour | Tabular views of all alert types: SLA, condition, and system. |
| Administration | Tabular views of system service containers, system services, system policies, monitors, and unassigned endpoints. |
Main Area
For any item selected in the Navigator, except those in the Dashboards and Maps categories, the main area displays a tabular view and, just above the table, a series of controls that you can use to filter the columns and the number of items shown. Here is an example of what is shown in the main view when Containers is selected in the Navigator.
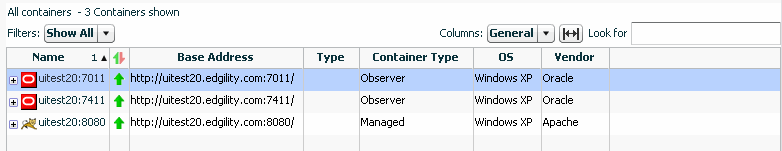
Description of the illustration main_view_example_audi.gif
Use the up/down control in the lower right hand corner of the main area to open and close the tabs area. You can control the size of the main area by moving the slider control bordering the main area and the tabs area.
Menus
Menu items relate directly to the item currently selected in the main area or the tabs area. You might think of the items in the main or tabs area as the nouns and of the menu items as the verbs. Thus, selecting a menu item will result in taking some action that affects the item selected in the main or tabs view.
Although menu items are never hidden, they might be disabled if the operation cannot be applied to the current selection, if the currently selected object is not in an appropriate state, or if the user is not authorized to operate on the target. Look here for additional information about user roles.
Tabs Area
The tabs area is organized into tabbed panels. The tabs shown vary with the item selected in the summary area.
Use the arrow control in the lower right hand corner of the main area to collapse the tabs area. You can expand it again either by double clicking an item in the main area or by clicking the up arrow at the bottom right hand corner of the summary pane.
Object Detail Window
The console provides access to an inspector window or a separate window that includes the tabs area for the selected object. This view is available for any object or area that shows a tear off control (magnifying glass). Clicking the control opens a separate window with additional detail information about the selected item. The information shown varies with the selected object.