12 Administration of Business Transaction Management
This chapter provides information to help you administer Business Transaction Management and includes the following sections:
12.1 Observers
This section provides information to help you administer Business Transaction Management observers and includes the following subsections:
12.1.1 About Observers
Observers are Business Transaction Management components that you install into the application server of business applications you want to monitor. The observers monitor messages and calls between the components of your business applications.
Observers contain one or more subcomponents called probes. Each probe provides the observer with the capability of monitoring a particular type of business component. The monitoring capabilities of an observer are, therefore, dependent on the collection of probes that it contains.
The following table lists the types of observers provided by Business Transaction Management, the probes contained within each observer, and the monitoring capabilities conferred on the observer by each of the probes.
Table 12-1 Available observers, the probes they contain, and the types of components they monitor.
| Observer | Probe | Components Monitored |
|---|---|---|
|
JavaEE |
EJB |
Enterprise JavaBean (EJB) |
|
- |
JAVA |
Java (monitors local Java method calls) |
|
- |
JAXRPC |
JAX-RPC (includes monitoring of JMS traffic that uses the JAX-RPC API) |
|
- |
JAX-RS |
JAX-RS (monitors RESTful applications, see JSR 339) |
|
- |
JAXWS |
JAX-WS (includes monitoring of JMS traffic that uses the JAX-WS API) |
|
- |
JDBC |
JDBC (monitors Java database calls) |
|
- |
JMS |
JMS (monitors traffic that uses the JMS API) |
|
- |
RMI |
Remote method invocation (RMI) |
|
- |
WEB_APP |
Java servlet application |
|
OSB |
OSB |
Oracle Service Bus Proxy and Business Services |
|
Oracle SOA Suite |
SOA_ADAPTER |
Oracle SOA Suite Adapter (this probe is provided only in the observer for Oracle Service Bus 10g) |
|
- |
SOA_BIZRULE |
Oracle SOA Suite Business Rule |
|
- |
SOA_BPEL |
Oracle SOA Suite Business Process Execution language (BPEL) |
|
- |
SOA_BPMN |
Oracle SOA Suite Business Process Modelling Notation (BPMN) |
|
- |
SOA_CALLBACK |
Callback requests of asynchronous calls |
|
- |
SOA_DIRECT |
Direct binding calls between SOA composites and between SOA and OSB |
|
- |
SOA_EDN |
Oracle SOA Suite Event Delivery Network |
|
- |
SOA_JCA |
JCA adapters including AQ, Database, File, FTP, JMS, MQ Series, Socket, and Oracle Applications |
|
- |
SOA_MEDIATOR |
Oracle SOA Suite Mediator |
|
- |
SOA_SPRING |
Oracle SOA Suite Spring Bean |
|
- |
SOA_WORKFLOW |
Oracle SOA Human Workflow components and notifications |
|
- |
SOA_WS |
Oracle SOA Suite web service (including Human Workflow web services) |
|
- |
SOA_WSA |
Oracle SOA Suite web service adapter |
|
- |
WEB_APP |
Java servlet application |
|
Oracle Fusion Applications (supports ADF-UI, ADF-BC and SOA deployments) |
ESS |
Oracle Enterprise Scheduling Service |
|
- |
All probes found in the JavaEE observer except for the JDBC probe |
Refer to the entry for the JavaEE observer |
|
- |
All probes found in the SOA Suite observer |
Refer to the entry for the SOA Suite observer |
|
Universal |
All probes found in the JavaEE, OSB, Oracle SOA Suite, and Oracle Fusion Applications observers |
Refer to the entries for the JavaEE, OSB, Oracle SOA Suite, and Oracle Fusion Applications observers. |
|
WCF |
WCF |
Microsoft WCF services |
|
Oracle Enterprise Gateway (OEG) |
OEG |
Web services fronted by an OEG Web Services Proxy |
Note:
For a complete and up-to-date list of the types of services and components that Business Transaction Management can discover and monitor, refer to the Business Transaction Management Certification Matrix. You can locate this document by searching for “BTM certification” online athttp://support.oracle.com.A single observer installation can monitor any number of components that are running in the application server, as long as the observer contains the appropriate probes.
Observers communicate with the Business Transaction Management sphere by way of another Business Transaction Management component called the monitor. One of the jobs of the monitor is to distribute configurations to the observers. When an observer starts up, it contacts the monitor and obtains a configuration. The observer periodically polls the monitor for updates to its configuration.
The observer configuration is generated from an Observer Communication policy. By default, a preconfigured Observer Communication policy is applied to all monitors (this default policy is named Observer Communication Policy - Default). This policy configures the monitors to which it is applied and also provides those monitors with an observer configuration that, by default, they distribute to all of their associated observers. You can edit this default policy and/or apply your own.
Once running, the observers measure various aspects of your business applications' message and/or call flow, such as throughput, fault count, and response time (for a complete list of measurements, see Chapter 6, "About Instruments"). The observers periodically send these measurements to the monitor for analysis and eventual storage in a database, as shown in the following diagram:
Figure 12-1 Example of deployed observer showing probes.
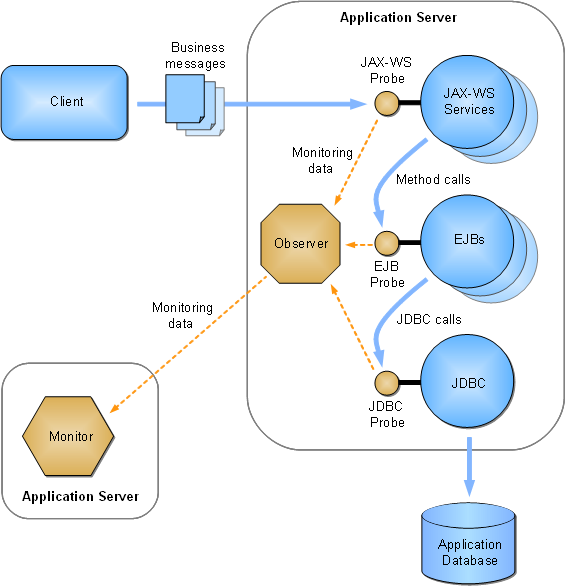
Description of "Figure 12-1 Example of deployed observer showing probes."
If configured to do so, the observers convert the various types of messages and calls into standardized XML-formatted messages for the purposes of message logging and further analysis. The observers forward these messages to the monitor. Note that these messages are copies, and that the original messages/calls are never altered or redirected.
Observers are installed into your business component's application server, and clients continue to access the business component in the same way as before the observer was installed. You can install any number of monitors and any number of associated observers per monitor, but observers are never installed in the application server hosting the Business Transaction Management central servers or monitors.
For an overview of the entire Business Transaction Management system, see Section 1.3, "Architectural Overview." For information about scaling up your monitoring system by replicating the monitors, refer to the Business Transaction Management Installation Guide.
12.1.2 Configuring the Observer and Monitor
The Observer Communication policy sets up communication between observers and a monitor or monitor group. By default, this policy configures both monitors and observers by:
-
setting up the observer-to-monitor communication channel
-
configuring the runtime settings for the observer
Prior to release 12.1.0.4, you could apply only a single Observer Communication policy to any one monitor, which meant that all observers associated with the same monitor would receive the same configuration. To provide greater flexibility in configuring observers, release 12.1.0.4 introduces the ability to apply multiple Observer Communication policies to a single monitor and to then target each of these policies at a different observer or set of observers. In such a scenario, you designate one (and only one) policy as being used for configuring the monitor, and you designate all of the remaining policies as being used only for configuring observers. The policy that configures the monitor can also be used for configuring observers, if you so desire. For more information on this topic, see Section 12.1.2.7, "Targeting Observers."
By default, a preconfigured Observer Communication policy is applied to all monitors registered in the system. This default policy is preconfigured to target all associated observers. If necessary, you can edit this default policy and/or create new policies.
To edit the default Observer Communication policy instance:
-
Select Administration > System Policies in the Navigator.
-
Select Observer Communication Policy - Default in the summary area (in previous releases, this policy is named Default Observer Communication Policy).
-
Choose Modify > Edit Definition for Observer Communication Policy - Default.
To create a new instance of an Observer Communication policy:
Choose Admin > Create System Policy > Observer Communication.
12.1.2.1 Common Tasks
The following are common configuration tasks you can perform using this policy:
-
Enabling/Disabling Drilldowns from Real User Experience Insight
-
Request Monitoring and Operation Modeling for the WEB_APP Probe
-
You can find information related to the following and other advanced tasks in the Advanced Settings Field Reference table in Section 12.1.2.11:
-
Logging observed messages and observer errors (see the Observer Troubleshooting entry)
-
Adjusting message size and queue behavior on the observer (see the Observer Message entry)
-
Adjusting message size and queue behavior on the monitor (see the Monitor Message Queue entry)
-
Controlling how SOA, OSB, JMS, and local EJB components are modeled (see the Model Configuration entry)
-
Enabling JDBC Summary Mode, in which observations of related JDBC calls are aggregated and sent to the monitor as a single observation message (see the JDBC Summary entry)
-
12.1.2.2 Activating and Deactivating Probes
Observers contain different types of probes for monitoring the various types of components that make up your business applications. You can use this policy to individually activate or deactivate probes that are installed on your system (any particular probe is considered to be installed if it is contained within an observer that is installed on your system). By default, all probes in a newly created policy except JAVA and RMI are activated.
Notes:
The JAVA probe monitors local Java calls, which in most cases is not needed and can be distracting because of the typically large number of local Java calls that occur. In order to use the JAVA probe, you must first deploy and configure it. For information about deploying and configuring the JAVA probe, enter a service request at My Oracle Support (support.oracle.com).In most situations, you should leave the RMI probe deactivated. Most applications utilize RMI by way of higher level APIs, such as JAX-RPC, JAX-WS, EJB, and JMS. In such cases, it is better to activate only the probes for these higher-level components. However, if your application makes RMI calls directly you might want to activate the RMI probe.
There is no need to explicitly deactivate probes that are not installed—neither for the sake of performance nor for any other reason (uninstalled probes are inherently not activated). The only reason to deactivate a probe is if: (1) the probe is installed, AND (2) you do not want to monitor the type of business component the probe monitors. Furthermore, you must deactivate (or activate) the SOA Suite probes as a group (the SOA Suite probes are SOA_ADAPTER, SOA_BIZRULE, SOA_BPEL, SOA_BPMN, SOA_CALLBACK, SOA_EDN, SOA_MEDIATOR, SOA_SPRING, SOA_WS, and SOA_WSA).
The Active Probes section of the policy provides an Enable Discovery and Monitor Upon Discovery checkbox for each type of probe.
Select the Enable Discovery checkbox to activate the discovery mechanism for the associated component type. Components of that type are then discovered and displayed in the Management Console the next time they receive a message or call.
Select the Monitor Upon Discovery checkbox for a component type if you want to immediately begin monitoring components of that type as they are discovered.
Note:
If you enable discovery but not monitoring and then later edit the policy and enable monitoring, the system will not begin monitoring previously discovered components. The system will begin monitoring only the components discovered after you enable monitoring. For information on enabling monitoring for previously discovered components, see Section 12.8.4, "Start and Stop Monitoring of Endpoints."12.1.2.3 Adding Probes
After upgrading Business Transaction Management, you might have new types of probes available for your monitoring purposes. However, the upgrade process does not automatically add these new probes to your existing Observer Communication policies. In order to use a new probe in an existing policy, you must manually add it to the policy as follows:
-
Select Administration > System Policies in the Navigator.
-
Select your policy in the summary area.
-
Choose Modify > Edit Definition for My_Policy, where My_Policy is the name of your policy.
-
Scroll to the bottom of the Active Probes section and click [add probe].
The cursor should now be inserted into an empty text field.
-
With the cursor already inserted into the empty text field, click into the text field.
A drop list opens that contains the names of all probe types.
-
Choose the probe type that you want to add.
-
Edit the settings of the Enable Discovery and Monitor Upon Discovery checkboxes as needed (refer to Section 12.1.2.2, "Activating and Deactivating Probes" for descriptions of these fields).
-
Click Apply.
12.1.2.4 Setting up the Observer-to-Monitor Communication Channel
The default Observer Communication policy sets up direct communication between the observer and monitor. Direct communication allows you to use multiple singleton monitors, with each monitor collecting observations from multiple observers.
If you intend to replicate the monitor by placing a load balancer in between the observers and a group of replicated monitors, you must set the values of the following fields in the Communication Channel section as indicated:
| Field Name | Value |
|---|---|
| Communication path | If your observers will communicate through a load balancer to a monitor group, choose Through router to monitor group. This choice displays the following fields in the policy |
| Router IP address | Specify the IP address of the load balancer that will receive the observation messages. |
| Router port number | Specify the port number on which the load balancer will receive the observation messages.
Note: You must also configure this port on your router. |
| Monitor port number | Specify the port number on which the monitors will receive the forwarded observation messages. |
For more information on this topic, refer to the Business Transaction Management Installation Guide.
12.1.2.5 Configuring SSL on the Observation Message Flow
The default Observer Communication policy sets up a secure socket connection that is used for sending observation messages from the observer to the monitor. If you prefer to use a nonsecured socket for this connection, disable the policy's Enable SSL checkbox.
With SSL enabled, the monitor is required to authenticate itself to the observer. By default, the SSL connection uses built-in, preconfigured security stores. If you want to use your own security stores, disable the Use Default Stores checkbox and fill in the additional fields using information from the following table:
Note:
If you are using .NET-based observers, you must deploy a certificate to the machines hosting the observers in order to use an SSL connection. If you are using the default stores, use the preconfigured certificate located at nanoagent\config\ssl\server.cer in the observer installation directory. Refer to the Business Transaction Management Installation Guide for more information on deploying the preconfigured certificate.| Field Name (boldface denotes a section name) | Description |
|---|---|
| Protocol | Required if displayed. Select the SSL protocol. Choices are TLSv1, SSLv3, or Any. SSLv3 is not supported by the .NET observers. This field configures both monitors and observers. |
| Use Default Stores | This checkbox is enabled by default.
Leave this checkbox enabled if you want to use the built-in, preconfigured security stores. In this case, you are finished if you are using Java-based observers only. If you are using .NET-based observers, you must also deploy a preconfigured certificate to the machines hosting the observers. You can find the preconfigured certificate at nanoagent\config\ssl\server.cer in the observer installation directory. Refer to the Business Transaction Management Installation Guide for more information on deploying the preconfigured certificate. Disabling this checkbox displays additional fields and permits you to specify your own security stores. |
| Monitor | ---------- This is a section label----------
The following five fields pertain to the monitor's key store. All of the following fields are displayed only if the Use Default Stores checkbox is disabled. |
| Key Store Location | Required if displayed. Specify the location of the monitor's SSL key store. You can specify this location as either an absolute path, if the key store file is local to your monitor, or as an HTTP(S) URL, if the file is accessible by HTTP GET.
The initial value when you open a new policy is AP-MONITOR-SSL:DefaultKeyStore.ks. This value points to the built-in, preconfigured key store located at WEB-INF/ssl/DefaultKeyStore.ks in the btmmonitor.war deployment. |
| Key Store Password | Required if displayed. Specify the password for accessing the SSL key store. |
| Key Store Type | Required if displayed. Specify the type of JCE (Java Cryptographic Extensions) key store for the monitor to use, for example, JKS, JCEKS, or PKCS12. The initial value is JKS. |
| Key Name | Required if displayed. Specify the certificate and private key. You can enter a key alias or a certificate attribute of the form CN=value, UID=value, etc. |
| Key Password | Required if displayed. Specify the password for accessing the certificate and private key. If unspecified, the password for the key store is used. |
| Auto-Dispatch Trust Store to Java Observers | If this checkbox is enabled, the monitor will serialize the trust store, and automatically send it to all associated Java observers. This option is ignored for .NET observers. This checkbox is disabled by default. |
| Auto-Dispatch Java Trust Store | ---------- This is a section label ----------
The following three fields pertain to the auto-dispatched trust store and are displayed only if the Auto-Dispatch Trust Store to Java Observers checkbox is enabled. |
| Trust Store Location | Required if displayed.
Specify the location of the SSL trust store that the monitor will dispatch to Java observers. You can specify this location as either an absolute path, if the trust store file is local to your monitor, or as an HTTP(S) URL, if the file is accessible by HTTP GET The initial value when you open a new policy is AP-MONITOR-SSL:DefaultTrustStore.ks. This value points to the built-in, preconfigured trust store located at WEB-INF/ssl/DefaultTrustStore.ks in the btmmonitor.war deployment. |
| Trust Store Password | Required if displayed. Specify the password for accessing the SSL trust store that the monitor will dispatch to Java observers. |
| Trust Store Type | Required if displayed. Specify the type of JCE (Java Cryptographic Extensions) trust store that the monitor will dispatch to Java observers, for example, JKS, JCEKS, or PKCS12. The initial value is JKS. |
| Java Observer | ---------- This is a section label ----------
The following three fields pertain to manually installed trust stores and are displayed only if the Auto-Dispatch Trust Store to Java Observers checkbox is disabled. |
| Trust Store Location | Required if displayed.
Specify the location of the SSL trust store to be used by observers deployed to Java execution environments. You can specify this location as either an absolute path, if the trust store file is local to your observer, or as an HTTP(S) URL, if the file is accessible by HTTP GET. The initial value when you open a new policy is AP-OBSERVER-SSL:DefaultTrustStore.ks. This value points to the built-in, preconfigured trust store located at nanoagent\config\ssl\DefaultTrustStore.ks in the observer installation directory. |
| Trust Store Password | Required if displayed. Specify the password for accessing the SSL trust store. |
| Trust Store Type | Required if displayed. Specify the type of JCE (Java Cryptographic Extensions) trust store that the monitor will dispatch to Java observers, for example, JKS, JCEKS, or PKCS12. The initial value is JKS. |
12.1.2.6 Configuring Observer Authentication
The default Observer Communication policy requires the observer to authenticate itself to the monitor each time it establishes a connection. You can adjust this setting by way of the Observer Authentication field. You can turn observer authentication off by setting the field to None.
You can also require the observer to authenticate itself each time it sends a message to the monitor by setting the field to Use Message Authentication. Note, however, that the use of message authentication can significantly degrade performance. You should use this setting only when necessary. For example, if your observer sends its messages to a monitor group whose load balancer is configured for per-message balancing (rather than per-connection), then you cannot use connection authentication. In this case, you must set this field to either None or Use Message Authentication.
Note:
The Observer Authentication field is displayed only if the Enable SSL field is enabled. Disabling the Enable SSL field disables observer authentication as well as the SSL connection.12.1.2.7 Targeting Observers
New functionality provided with release 12.1.0.4 gives you greater flexibility in configuring observers. In prior releases, you could apply only a single Observer Communication policy to any one monitor. The monitor then generated a single observer configuration from this policy and distributed it to all of its associated observers (you associate an observer to a monitor at installation time by providing the observer with the monitor's location).
As of release 12.1.0.4, you can apply multiple Observer Communication policies to a single monitor and then target each of these policies at a different observer or set of observers (the observers you target must be associated with the monitor). The following steps describe the procedure for targeting observers:
Note:
The order of these steps is intended to help you understand the concepts involved in targeting observers. However, when you actually perform the task, it is most efficient to complete all the steps in one policy and then move on to the next policy.-
Designate one policy as the source for generating the monitor's configuration by leaving the Generate Configuration for Observers Only checkbox disabled (we'll refer to this policy as the “monitor policy”).
The “monitor policy” generates the monitor configuration and also one observer configuration.
-
Apply as many additional policies to the monitor as you require for configuring your observers (we'll refer to these policies as “observer policies”).
-
Designate each “observer policy” as a source for generating only an observer configuration by enabling the Generate Configuration for Observers Only checkbox.
-
Ensure that the values of all the other fields in the Communication Channel section of each “observer policy” matches the values in the “monitor” policy.
-
-
Target your “observer policies” at specific observers.
-
Use the Configuration Label and/or Observer Base Address fields to specify which observers you want to target with the observer configuration (for more information about these and related fields, refer to Section 12.1.2.7.1, "Observer Configuration Labels" and Section 12.1.2.7.5, "Field Reference for Targeting Observers").
-
Ensure that labels and addresses specified in one “observer policy” are not specified in any other policy that is applied to the same monitor (for additional information, see Section 12.1.2.7.2, "Rejection of Observer Communication Policies").
-
Optional – Enable the Validate Addresses checkbox to ensure that all targeted observers are known to Business Transaction Management.
If you target an unknown observer and enable this field, the policy will be rejected. If you want to target an observer that is not currently known but will be later, you should disable this field.
-
Optional – (Do not enable this checkbox if you apply the policy to multiple monitors.) Enable the Enforce to Monitor field to validate that all the targeted observers are associated with the monitor to which you apply the policy.
-
-
Optional – Leave one policy untargeted to serve as the default observer configuration for all observers associated with the monitors to which the policy is applied.
An untargeted policy serves as the default configuration for observers that are not specifically targeted by another policy. You could, for example, leave the “monitor policy” untargeted and use it as a default observer configuration. If you attempt to create a second untargeted policy, the second policy will be rejected (for information about rejected policies, see Section 12.1.2.7.2, "Rejection of Observer Communication Policies").
Note:
If you configure different monitors (or groups of monitors) using different policies, you can define a different default observer configuration for each.
As in previous releases, you can use a single policy for configuring monitors and all of their associated observers, if you desire (in other words, you don't have to target specific observers). In such a scenario, you would use a “monitor policy” that is not targeted at specific observers. This policy will generate a default observer policy, and, since no specific observers are targeted, all observers associated with the monitors will receive this default configuration.
12.1.2.7.1 Observer Configuration Labels
An observer configuration label is a simple text string that conceptually identifies a set of observers (for example, CONFIG_LABEL_MY_OBSERVERS). You target an observer by specifying either a label or the absolute address of the application server in which the observer is deployed (for example, http://my_host.com:7011). You can specify any number of labels and/or addresses, and target any number of observers in a single policy.
Labels enable you to group observers logically rather than physically for configuration purposes. Applying a label is a two-step procedure that you can perform in either order:
-
In the application server that hosts the observer, create a system property named ap.nano.config.label and set its value to your label string (refer to the Business Transaction Management Installation Guide for details on how to do this).
-
Set the Configuration Label field of the Observer Communication policy that you will use to configure your observer to the same value as ap.nano.config.label.
12.1.2.7.2 Rejection of Observer Communication Policies
There are a numbers of ways, related to the targeting of observers, in which you might inadvertently cause an Observer Communication policy to be rejected. All of the following scenarios will cause a policy to be rejected:
-
Attempting to apply more than one untargeted policy (default observer configuration) to the same monitor
-
Attempting to specify the same observer configuration label in two different policies that are applied to the same monitor
-
Attempting to specify the same observer base address in two different policies that are applied to the same monitor
Labels are scoped to the monitor to which a policy is applied. This means that you can reuse a particular label name across policies if the policies are applied to different monitors, but you cannot reuse a label name across policies applied to the same monitor. This scoping principle also pertains to untargeted policies.
If a policy is rejected, select the policy in the work area of the console and display the Targets tab. This tab provides information about the cause of a rejected policy.
12.1.2.7.3 Order of Precedence
The order of precedence that determines which configuration an observer will receive is as follows:
-
Observer base address
If a policy specifies the observer's base address, then the observer will receive the configuration generated by that policy.
-
Observer configuration label
If a policy specifies the observer's configuration label and no policy specifies the base address, then the observer will receive the configuration generated by the policy that specifies the configuration label.
-
Untargeted policy
If a an untargeted policy exists and no policy specifies the observer's base address or configuration label, then the observer will receive the configuration generated by the untargeted policy.
12.1.2.7.4 Preconfigured Observer Communication Policies
Business Transaction Management provides a number of Observer Communication policies that are preconfigured for monitoring particular types of applications. You can edit any of these policies and tailor them to your monitoring needs. The name of each policy is displayed in bold, followed by a description:
-
Observer Communication Policy - Default
This policy generates both a monitor configuration and an untargeted (default) observer configuration. By default, this policy is applied to all monitors in the system. The observer configuration is distributed to all associated observers that are not specifically targeted by a different policy.
-
Observer Communication Policy - Fusion Applications
This policy generates only an observer configuration. By default, this policy is applied to all monitors in the system. The observer configuration is targeted at observers tagged with the label CONFIG_LABEL_FAPPS. This configuration activates probes and adjusts observer runtime settings for monitoring Oracle Fusion Application components.
-
Observer Communication Policy - JavaEE
This policy generates only an observer configuration. By default, this policy is applied to all monitors in the system. The observer configuration is targeted at observers tagged with the label CONFIG_LABEL_JAVAEE. This configuration activates probes and adjusts observer runtime settings for monitoring JavaEE components.
-
Observer Communication Policy - OSB
This policy generates only an observer configuration. By default, this policy is applied to all monitors in the system. The observer configuration is targeted at observers tagged with the label CONFIG_LABEL_OSB. This configuration activates probes and adjusts observer runtime settings for monitoring Oracle Service Bus components.
-
Observer Communication Policy - SOA
This policy generates only an observer configuration. By default, this policy is applied to all monitors in the system. The observer configuration is targeted at observers tagged with the label CONFIG_LABEL_SOA. This configuration activates probes and adjusts observer runtime settings for monitoring Oracle SOA components.
12.1.2.7.5 Field Reference for Targeting Observers
12.1.2.8 Enabling/Disabling Drilldowns from Real User Experience Insight
You can control the ability of users to perform user-interface drilldowns from Oracle Enterprise Manager Real User Experience Insight into Business Transaction Management. By default, drilldown capability is enabled. To disable or re-enable drilldown capability, set the WEB_APP probe's rueiPresent attribute as described in Section 12.1.2.9.
12.1.2.9 Request Monitoring and Operation Modeling for the WEB_APP Probe
The WEB_APP probe lets you monitor web applications that are implemented as Java servlets. This probe provides a generic form of processing that can be used with all types of Java servlets and a specialized form of processing optimized for use with Oracle Application Development Framework (ADF) applications. This section refers to these different types of processing as rulesets. The generic type of processing is referred to as the URL ruleset, and the type of processing used for ADF applications is referred to as the ADF ruleset. The probe defaults to the URL ruleset.
Unless configured otherwise, the WEB_APP probe monitors all requests to the web applications in the monitored application server. In many cases, however, you might not want to monitor all requests. For example, you might not want to monitor requests for static resources such as image and HTML files. For this reason, the default Observer Communication policy is configured not to monitor requests for resources that have the following file extensions: jpg, jpeg, html, htm, css, gif, png, ico, js, swf, cur. This selective monitoring is specified by way of a snippet of XML configuration code that appears in the default policy's WEB_APP probe configuration field.
You can edit this default XML configuration code in order to control the types of requests that are monitored. You can also add XML elements to control how your application's operation names are abbreviated for display in the Management Console (operation names are derived from request URLs). The following table describes the XML elements and attributes that you can use in your configuration code. Usage examples are provided after the table.
Note:
Ordering of the XML elements is critical. The required ordering of the elements is described in the table. Incorrect ordering will cause the policy to be rejected.| Element | Attribute | Description | Supported rulesets |
|---|---|---|---|
| servletObserver | - | Encompassing tag containing configuration information for all applications monitored by the WEB_APP probe. There is only one <servletObserver> element. | ADF URL |
| - | rueiPresent | Indicates that Oracle Enterprise Manager Real User Experience Insight is installed in front of the monitored applications. This attribute controls the ability of users to perform user-interface drilldowns from Real User Experience Insight into Business Transaction Management.
Valid values: true or false. The default setting is true. When this attribute is set to true, Business Transaction Management adds headers to the HttpResponse, thereby enabling drilldown capability. To disable drilldown capability, set this attribute to false. |
ADF URL |
| - | rueiMatches | Indicates that the Real User Experience Insight naming scheme matches the Business Transaction Management naming scheme. Valid values: true or false. | ADF URL |
| globalExcludeList | - | Use this element to globally exclude specified URLs from monitoring. You can specify URLs to exclude by file type, context root, pattern matching, or length.
Element ordering: If used, you must place this element as the first child of the <servletObserver> element. There can be only one per <servletObserver>. |
ADF URL |
| - | ext | Contains a comma-delimited list of file extensions, for example, ext="html, htm, jpg, css". Files of the specified types are excluded from monitoring. | ADF URL |
| - | contextRoot | Contains a comma-delimited list of context roots, for example, contextRoot="console, medrec, bookmart". URLs containing any of the specified context roots are excluded from monitoring.
To specify a blank context root, use "/", for example, contextRoot="console, /, bookmart". |
ADF URL |
| - | pathPattern | Contains a comma-delimited list of URL patterns. URLs that match any of the specified patterns are excluded from monitoring. Wild cards are allowed and denoted using “*”.
Notes on pattern matching (applies to both the pathPattern and pattern attributes):
|
ADF URL |
| - | pathLength | Positive integer. URLs that exceed this number of characters are excluded from monitoring.
Characters in the protocol, host name, port number, and query string are not included in the count. The section of the URL that this attribute operates on is the same as for the pathPattern attribute. |
ADF URL |
| application | - | Denotes an application to be monitored.
Element ordering: This element is a child of the <servletObserver> element. It must not precede the <globalExcludeList> or <globalAdfOptions> elements. There can be any number per <servletObserver> element. |
ADF URL |
| - | contextRoot | The context root of the monitored application. The value of this attribute is used as the service name. To specify a blank context root, use “/”, for example contextRoot=”/”. | ADF URL |
| framework | - | This element is used to specify which URLs should be handled by which ruleset by way of the <include> child element.
Element ordering: If used, you must place this element as the first child of the <application> element. There can be one for each ruleset type per <application> element. |
ADF URL |
| - | type | Specifies the ruleset that should handle the <include> URL patterns. Valid values are ADF and URL. For ADF web applications, set this attribute to ADF. For other web applications, set this attribute to URL. The requests processed by each ruleset are mutually exclusive.
If no <framework> tag is specified, the probe defaults to the URL ruleset. If a <framework> tag is specified, then there is no default value. |
ADF URL |
| include | - | This element allows you to exclude all requests except those that match the given wild card expression when mapping a request to a ruleset.
You cannot use this element to include previously excluded URLs. For example, if you used <globalExcludeList> to exclude the “png” extension, you cannot override that exclusion by specifying “*.png” in the <include> element. Element ordering: This element is a child of the <framework> element. There can be many per <framework> element. |
ADF URL |
| - | pattern | The URL pattern to match. Wild cards are allowed and denoted using “*”.
This attribute follows the same pattern matching rules as the pathPattern attribute. Refer to the <globalExcludeList> element's pathPattern attribute for information on these rules. |
ADF URL |
| excludeList | - | Use this element to specify file types within a particular application that you want to exclude from monitoring. This element overrides the <globalExcludeList> element for a specific application.
Element ordering: This element is a child of the <application> element. It must not precede any <framework> elements and must precede all <adfOptions> and <operationRule> elements. There can be only one per <application> element. |
ADF URL |
| - | ext | Contains a comma-delimited list of file extensions, for example, "html, htm, jpg, css". Files of the specified types (within the parent application) are excluded from monitoring.
If the you want to monitor all file types in the application but the ext attribute of the <globalExcludeList> element is set, then set this ext attribute to the null string (for example: ext=""). |
ADF URL |
| adfOptions | - | Use this element to partition operations within a particular application by appending property values contained in the ADF UI request parameter oracle.adf.view.rich.monitoring.UserActivityInfo to the operation name. In order to use this feature, the UserActivityInfo request parameter must be enabled (see Section 12.1.2.9.1, "Enabling the UserActivityInfo Request Parameter"). The attributes of this element correspond to properties in the UserActivityInfo request parameter. The attributes control whether the property values are appended to the operation name. The property values are appended only if they exist in the request parameter.
Element ordering: This element is a child of the <application> element. It must not precede any <framework> or <excludeList> elements and must precede all <operationRule> elements. There can be only one per <application> element. |
ADF URL |
| - | appendRegionViewId | Set this attribute to true to append the value of the regionViewId property to the operation name using the format __regionViewId. The default setting is false. | ADF URL |
| operationRule | - | This element specifies the parts of the URL for which a unique combination of values will constitute an operation. Use this element to abbreviate the operation name that is derived from the URL.
Element ordering: This element is a child of the <application> element. It must not precede any <framework>, <excludeList>, or <adfOptions> elements. There can be only one per <application> element. |
ADF URL |
| - | excludeDirectories | Contains a comma-separated list of directory levels to exclude from the operation name. For example, you could exclude “/faces” or the session ID. Note that the context-root is not considered a directory level. Also, the excludeDirectories count starts with “1”, not “0”. | ADF URL |
| paramGroup | - | Use this element to partition operations by multiple request parameters. You specify the request parameters by adding <partitionByParam> elements as children of this element. Partitioning occurs only if all specified parameters exist in the request. The parameter names and values are appended to the operation name in this format:
_name1_value1__name2_value2__name3_value3
Notice that there are two underscore characters between each name-value pair. This element can contain a maximum of three <partitionByParam> elements. Note: Using this element to partition an operation that is used in an existing transaction definition changes the semantics of the transaction. For example, requests that contain the specified parameter will not be counted as requests for the original operation and, therefore, will not be counted as belonging to the transaction. You might need to update the definition of your transaction accordingly. Element ordering: If used, you must place this element as the first child of the <operationRule> element. There can be multiple <paramGroup> elements. This element must precede all stand-alone <partitionByParam> elements (that is, those that are not children of a <paramGroup> element). |
ADF URL |
| partitionByParam | - | This element partitions an operation based on the value of the specified request parameter. Each unique parameter value is modeled as a separate operation. The parameter can be either a URL parameter or a POST parameter.
For example, assume we have an orderApplication.jsp that takes a parameter named action. Normally, requests to orderApplication.jsp would be modeled as requests to a single operation named orderApplication.jsp. However, if we use <partitionByParam> and partition by the action parameter, all requests to orderApplication.jsp that contain an action parameter will be modeled as requests to an operation named orderApplication.jsp_action_paramValue, where paramValue is the value of the action parameter. And, importantly, requests containing an action parameter will not be counted as requests to the operation orderApplication.jsp. (See also, "Example 2 – Adding a parameter name/value pair to an operation name".) Note: Using this element to partition an operation that is used in an existing transaction definition changes the semantics of the transaction. For example, requests that contain the specified parameter will not be counted as requests for the original operation and, therefore, will not be counted as belonging to the transaction. You might need to update the definition of your transaction accordingly. Element ordering: If used, you can place this element in two positions:
There can be any number per <operationRule> element. If you want to use a single <partitionByParam> element before a <paramGroup>, place it inside of its own <paramGroup> element. Note: This element does not support ADF page input parameters. |
ADF URL |
| - | name | The name of the parameter to use for partitioning requests. Each distinct value of the given parameter corresponds to its own operation. The parameter is appended to the operation name as “_name_value”, where name is the name of the parameter and value is its value. | ADF URL |
| secureParam | - | This element represents a URL or POST parameter whose value should be kept hidden or not get stored at all (for example, a password), both in operation names and in Business Transaction Management messages.
Element ordering: This element is a child of the <operationRule> element. It must not precede any <paramGroup> or <partitionByParam> elements. There can be any number per <operationRule> element. |
ADF URL |
| - | name | The name of the parameter whose value should be hidden or not stored at all. | ADF URL |
Notes:
(1) Service and operation names are derived from the request URL. In order to conform to XML standards, the probe substitutes an underscore symbol (“_”) in place of special characters such as slashes, question marks, and equal signs (“/”, “?”, “=”).
(2) Service and operation names are shortened if they exceed 255 bytes. This shortening is performed by truncating the name to 252 bytes, and then appending “…” to it.
(3) Processing for the pathLength attribute occurs before the processing for the pathPattern attribute. Service and operation name shortening occurs at the end of processing. The complete order of execution is as follows:
-
The pathLength attribute of the <globalExcludeList> element
-
The contextRoot attribute of the <globalExcludeList> element
-
The pathPattern attribute of the <globalExcludeList> element
-
The ext attribute of the <excludeList> element if it exists
Otherwise:
The ext attribute of the <globalExcludeList> element
-
The include elements within the <framework> element
-
Service and operation name shortening
Example 1 – Abbreviating an operation name
<ap:servletObserver xmlns:ap="http://namespace.amberpoint.com/amf">
 <ap:application contextRoot="/mywebshop">
  <ap:operationRule excludeDirectories="1, 2" />
 </ap:application>
</ap:servletObserver>
The preceding configuration code applied to this request URL:
http://secure.banking.de:7001/mywebshop/shopping/s28373/basket/checkout.jsp
produces the following objects in Business Transaction Management:
| Object | Value | Explanation |
|---|---|---|
| Service | mywebshop | The service name is the value of the contextRoot attribute. |
| Endpoint | http://secure.banking.de:7001/mywebshop | The endpoint is the physical location of the monitored web application plus the service name (the value of the contextRoot attribute). |
| Operation | basket_checkout.jsp | By default, the operation name consists of the directories and filename from the request URL. In this case, the default operation name would be shopping/s28373/basket/checkout.jsp. However, because the <operationRule> element's excludeDirectories attribute is set to "1, 2", the first and second directories (shopping/s28373/) are excluded. |
Example 2 – Adding a parameter name/value pair to an operation name
<ap:servletObserver xmlns:ap="http://namespace.amberpoint.com/amf">
 <ap:application contextRoot="/physician">
  <ap:operationRule>
   <ap:partitionByParam name="lastName"/>
  </ap:operationRule>
 </ap:application>
</ap:servletObserver>
The preceding configuration code applied to this request URL:
http://stbdm02:7011/physician/physicianSection/viewRecordSummary.action
with a POST parameter of "lastName=Einstein", produces the following objects in Business Transaction Management:
| Object | Value | Explanation |
|---|---|---|
| Service | physician | The service name is the value of the contextRoot attribute. |
| Endpoint | http://stbdm02:7011/physician | The endpoint is the physical location of the monitored web application plus the service name (the value of the contextRoot attribute). |
| Operation | physicianSection_viewRecordSummary.action_lastName_Einstein | The name and value of the parameter specified by the <partitionByParam> element is appended to the default operation name. |
Example 3 – Filtering requests and applying rulesets
<ap:servletObserver xmlns:ap="http://namespace.amberpoint.com/amf">
 <ap:application contextRoot="/em">
  <ap:framework type="ADF">
   <ap:include pattern="*/faces*"/>
  </ap:framework>
  <ap:framework type="URL">
   <ap:include pattern="*/console*" />
  </ap:framework>
  <ap:operationRule excludeDirectories="1, 2" />
 </ap:application>
</ap:servletObserver>
The preceding configuration code applied to these request URLs:
 http://myhost:17861/em/faces/ocamm/managers/ocammHome
 http://myhost:17861/em/console/all/targets/search
 http://myhost:17861/em/em2go/about.jsp
produces the following objects in Business Transaction Management:
| Object | Value | Explanation |
|---|---|---|
| Service | em | The service name is the value of the contextRoot attribute. |
| Endpoint | http://myhost:17861/em | The endpoint is the physical location of the monitored web application plus the service name (the value of the contextRoot attribute). |
| Operation | managers_ocammHome | (This pertains to the first example URL)
Because the <framework> element's type is set to ADF, the ADF ruleset is used. Therefore, by default, the operation name consists of the directories and filename from the request URL. In this case, the default operation name would be faces/ocamm/managers/ocammHome. However, because the <operationRule> element's excludeDirectories attribute is set to “1, 2", the first and second directories (faces/ocamm/) are excluded. |
| Operation | targets_search | (This pertains to the second example URL)
Because the <framework> element's type is set to URL, the URL ruleset is used. Therefore, by default, the operation name consists of the directories and filename from the request URL. In this case, the default operation name would be console/all/targets/search. However, because the <operationRule> element's excludeDirectories attribute is set to "1, 2", the first and second directories (console/all/) are excluded. |
| N/A | N/A | (This pertains to the third example URL)
A <framework> element of type URL was specified with only the pattern "*/console*". This request does not fit that pattern. It also does not fit the pattern specified in the ADF <framework> element. Thus it is excluded from monitoring. |
Example 4 – Adding multiple parameter name-value pairs to an operation name
<ap:servletObserver xmlns:ap="http://namespace.amberpoint.com/amf">
 <ap:application contextRoot="/physician">
  <ap:operationRule>
   <ap:paramGroup>
    <ap:partitionByParam name="firstName"/>
    <ap:partitionByParam name="lastName"/>
   </ap:paramGroup>
  </ap:operationRule>
 </ap:application>
</ap:servletObserver>
The preceding configuration code applied to this request URL:
http://st02:7011/physician/physicianSection/viewRecordSummary.action
with POST parameters of "firstName=John" and "lastName=Doe" produces the following objects in Business Transaction Management:
| Object | Value | Explanation |
|---|---|---|
| Service | physician | The service name is the value of the contextRoot attribute. |
| Endpoint | http://st02:7011/physician | The endpoint is the physical location of the monitored web application plus the service name (the value of the contextRoot attribute). |
| Operation | physicianSection_viewRecordSummary.action_firstName_John__lastName_Doe | The name and value of the parameters specified within the <paramGroup> element are appended to the default operation name in the order they are listed. If either the firstName or lastName parameters were not available, then this <paramGroup> element would have been ignored, resulting in a value of “physicianSection_viewRecordSummary.action”. |
Example 5 – Parameter priority handling
<ap:servletObserver xmlns:ap="http://namespace.amberpoint.com/amf">
 <ap:application contextRoot="/physician">
  <ap:operationRule>
   <ap:paramGroup>
    <ap:partitionByParam name="firstName"/>
    <ap:partitionByParam name="lastName"/>
   </ap:paramGroup>
   <ap:partitionByParam name="lastName"/>
   <ap:partitionByParam name="middleName"/>
  </ap:operationRule>
 </ap:application>
</ap:servletObserver>
The preceding configuration code applied to this request URL:
http://st02:7011/physician/physicianSection/viewRecordSummary.action
with POST parameters of "lastName=Smith" and "middleName=Rodney" produces the following objects in Business Transaction Management:
| Object | Value | Explanation |
|---|---|---|
| Service | physician | The service name is the value of the contextRoot attribute. |
| Endpoint | http://st02:7011/physician | The endpoint is the physical location of the monitored web application plus the service name (the value of the contextRoot attribute). |
| Operation | physicianSection_viewRecordSummary.action_lastName_Smith | The probe first checks whether the parameters specified in the <paramGroup> element are provided in the request. Because the firstName parameter is not provided, that entire <paramGroup> element is skipped. The probe then checks the next <paramGroup> or stand-alone <partitionByParam> element. Because the next element specifies a “lastName” parameter and that parameter is provided in the request, the parameter name and value is appended to the operation name (_lastName_Smith). After finding this match, the probe stops checking for parameters, meaning that the “middleName” parameter is not appended to the operation name. |
12.1.2.9.1 Enabling the UserActivityInfo Request Parameter
If you want to use the operation partitioning features provided by the <adfOptions> and <globalAdfOptions> elements, then you must ensure that the UserActivityInfo request parameter is enabled for your application. Oracle Fusion Applications environments should have this enabled by default as well as environments using the ADF support in Oracle Enterprise Manager Real User Experience Insight.
To enable the UserActivityInfo request parameter in your ADF application, set the following property in the application's web.xml file:
<context-param>
  <description>
    This parameter notifies ADF Faces that the ExecutionContextProvider
    service provider is enabled. When enabled, this will start
    monitoring and aggregating user activity information for the client
    initiated requests. By default, this param is not set or is false.
  </description>
  <param-name>
    oracle.adf.view.faces.context.ENABLE_ADF_EXECUTION_CONTEXT_PROVIDER
  </param-name>
  <param-value>true</param-value>
</context-param>
12.1.2.10 Info Settings Field Reference
| Field Name | Description |
|---|---|
| Name | Required. Specifies the name of your policy. You can set this field to any unique string. |
| Version | Optional. This field is descriptive only and is provided for you to enter any pertinent information about the policy. |
| Notes | Optional. This field is descriptive only and is provided for you to enter any pertinent information about the policy. |
12.1.2.11 Advanced Settings Field Reference
| Field Name (boldface denotes a section name) | Description |
|---|---|
| Observer Behavior | - |
| Configuration polling interval | Required. Use this field to specify, in seconds, how often the observer checks for a new configuration. |
| Instrument update interval | Required. Use this field to specify, in seconds, how often the observer sends measurement data to the monitor. |
| Number of connections | Use this field to specify the number of socket connections that the observer opens. Using multiple connections improves throughput of observations. |
| Mapping Algorithm | Specifies the algorithm used to modify the host name-port number portion of the request and WSDL URLs. Choose from these values:
As sent - The observer does not rewrite the URL and forwards it unchanged to the monitor. Use hostname - The observer replaces the host name portion of the URL with the fully qualified name of the server's host. It replaces the port number portion of the URL with the port number on which the server is listening. The host name and port number are obtained from the deployment environment. This algorithm is useful for clustered servers fronted by a load balancer. In this scenario, the original request URL is that of the load balancer, with the load balancer's host name and port number. If the observer passes the original request URL to the monitor, the entire cluster of servers is modelled as a single server. With the algorithm set to useHostname, each server is modelled separately. Use IP address - The observer converts the URL's host name into an IP address and leaves the port number unchanged. The IP address is obtained from the deployment environment. This algorithm can be useful if the monitor cannot resolve hostnames to valid IP addresses. You should not use this algorithm if the server has multiple IP addresses. Use fully qualified name (FQN) - The observer converts the URL's host name into a fully qualified name and leaves the port number unchanged. This algorithm can be useful for a server that has multiple IP addresses. Use alternate - This algorithm lets you provide specific values for the host name, port number, and protocol. Use the following three fields to input the values. If you do not specify a value in any one of the fields, the corresponding portion of the URL is left unchanged. Note: In the case of the OSB observer, the target service URL is always set to FQN in the observer configuration, but this setting is not visible in this policy. |
| Alternate host | The value to use as the host portion of the URL. |
| Alternate port | The value to use as the port number portion of the URL. |
| Alternate protocol | The value to use as the protocol portion of the URL. |
| Discovery processing interval | Specifies the regular interval (in minutes) at which the observer attempts to discover new components. The default value is 3 minutes. Any value over 1440 minutes (one day) is interpreted as 1440 minutes. Any negative value is interpreted as 3 minutes. |
| Observer Troubleshooting | - |
| Enable trace logging | Trace logging is always enabled and is set to Info by default. Use this checkbox to enable the Trace logging level field so that you can edit the setting.
For information on other types of observer error logging, location of error log files, and configuring the location of error logs, see Section 12.1.3, "Logging Observer Errors and Debugging Information". |
| Trace logging level | Use this field to specify the level of information you want written to the log file. The possible values, in order from least to most information, are:
Info, Fine, Finer, Finest |
| Trace file size | This field specifies, in kilobytes, the size of the trace log files. |
| Trace files count (rotation) | This field specifies the maximum number of trace log files. When the maximum number of trace log files are full, rotation occurs, whereby the oldest file is overwritten with a new file.
In general, you will change this setting only when asked to do so by the Oracle support team. |
| Log observed messages to file | Enable this checkbox if you want observed messages written to a file. |
| Observation log directory | The path to the directory containing the observation log files. For WebLogic, OC4J, WebSphere, and JBoss servers, you can specify an absolute path or a relative path. For other servers, you can specify only an absolute path. Relative paths are relative to the default location. The default locations are:
Note: The default log location for WCF and ASP.NET is not a true default. It is simply the default setting of the AmberPoint:NanoLogBaseDir key. If you set this key to null, log files will not be created. |
| Observer Message Queue | The fields in this section affect the behavior of the observer's observation queue. The observer copies observed, service-bound messages to this outgoing queue. These observations are then pulled off the queue and sent to the monitor. |
| Queue size | Required. This field specifies the maximum number of messages the observer's observation queue can hold. A larger number allocates more memory for the queue. |
| Maximum message size | Optional. This field specifies, in kilobytes, the maximum size of a message that can be placed on the observer's observation queue. Messages larger than the specified size are first truncated and then placed on the queue.
You can use this field to reduce the load on the network and monitor. The truncation applies only to the body of the message. The message envelope is left intact. Note: If your service is a client to other services, you must set this setting to the same value for the observers monitoring those services. Failure to do so will disrupt the dependency tracking mechanism and cause the appearance of nonexistent clients in dependency diagrams. |
| If queue is full | Caution: Leave this field at its default setting unless you are instructed by the Oracle support team to edit it. The default setting for this field is Forward service-bound messages without copying them onto queue.
The If queue is full field specifies the behavior of the observer's observation queue if it fills up. Choose between these options: Delay service-bound messages until there is room to copy them onto queue - If the queue is full, the observer waits until the queue frees up enough space to hold the observation before forwarding the original message on to the service. This setting ensures that copies of all messages are forwarded to the monitor. Choosing this option together with the Delay receipt of observed messages over socket until queue has room option in the Monitor Configuration section of the policy ensures that all observations are logged. However, in high-traffic situations, such a setting might result in the slowing down of message processing by the monitored application. Forward service-bound messages without copying them onto queue - If the queue is full, the observer forwards the original message on to the service without copying it to the queue. Choosing this option ensures that the observer does not slow down the monitored application's message processing in order to log observations. However, in high-traffic situations, this setting might result in a loss of observations. Note: In no case, does the observer discard the original service-bound messages. |
| Monitor Message Queue | The fields in this section affect the behavior of the monitor's observation queue. As observations arrive at the monitor, they are placed on this incoming queue. The monitor then pulls the observations off the queue and processes them in order to gather data on performance, transactions, and so forth. |
| Queue size | Required. This field specifies the maximum number of messages the monitor's observation queue can hold. A larger number allocates more memory for the queue. |
| Maximum message size | Optional. This field specifies, in kilobytes, the maximum size of messages that are accepted on the monitor's observation queue. You can use this field to reduce the load on the monitor by constraining the processing of large messages.
By specifying a value in this field, you instruct Business Transaction Management to drop both the request and response message (or fault message, in case of a fault) if either message in the pair is larger than the specified value. Oversized messages are dropped without being processed and are not used in calculating performance measurements such as throughput or average response time. |
| Idle socket timeout | Required. This field specifies the maximum number of milliseconds that the socket on which the monitor receives observations remains open in the absence of traffic. |
| Retain request messages for a maximum of | Optional. This setting specifies the number of seconds the monitor holds on to a request message before assuming that no response will arrive. Once this time has been exceeded, the request is processed as if the response message timed out. The default value of 60 seconds is used if you leave this field blank or set it to 0. |
| Number processing threads handling messages | Optional. This field specifies the number of threads the monitor allocates for processing observation messages. The default value of 5 is used if you leave the field blank or set it to 0. |
| Number processing threads handling endpoint discovery | Optional. This field specifies the number of threads the monitor allocates for processing endpoint discovery messages. The default value of 2 is used if you leave the field blank or set it to 0. |
| If queue is full | Required. This field specifies the behavior of the monitor's observation queue if it fills up. Choose between these options:
Delay receipt of observed messages over socket until queue has room - If full, the queue rejects incoming observations (message copies) until it has freed up space for them. In this case, the observer resends observations until they are successfully placed on the queue. Choosing this option together with the Delay service-bound messages until there is room to copy them onto queue option in the Observer Configuration section of the policy ensures that all observations are logged. However, in high-traffic situations, such a setting might result in the slowing down of message processing by the monitored application. Discard incoming observed messages - If full, the queue discards incoming observations. Choosing this option together with the Forward service-bound messages without copying them onto queue option in the Observer Configuration section of the policy ensures that the observer does not slow down the monitored application's message processing. However, in high-traffic situations, this setting might result in a loss of observations. Note: In no case, does the monitor discard the original application messages. |
| Servlet Observer Configuration | - |
| Specify WEB_APP probe configuration | This checkbox pertains to the WEB_APP probe and allows you to configure the selective monitoring of requests and modeling of operations. Enable this checkbox to display the WEB_APP probe configuration field, where you can input configuration code for these options. This field is enabled by default.
Note: If you provide a custom observer configuration in the Custom observer configuration field, do not enable this checkbox. Instead, you must add your filtering/modeling code to your custom observer configuration in the Custom observer configuration field. This code must be contained in a <servletObserver> element and added as the last child of the custom configuration's <nanoAgentConfigurations> element (the root element in the custom configuration.) |
| WEB_APP probe configuration | This field is displayed only if the Specify WEB_APP probe configuration checkbox is enabled.
Use this field to input a <servletObserver> element into the configuration for the WEB_APP probe. This element provides control over the selective monitoring of requests and the modeling of operations. By default, this field contains the following code, which instructs the probe not to monitor requests for files with the specified extensions. <ap:servletObserver rueiPresent="true" rueiMatches="false" xmlns:ap="http://namespace.amberpoint.com/amf"> <ap:globalExcludeList ext="jpg, jpeg, html, htm, css, gif, png, ico, js, swf, cur"/> </ap:servletObserver> For information on coding the <servletObserver> element, see Section 12.1.2.9, "Request Monitoring and Operation Modeling for the WEB_APP Probe." |
| Custom Observer Configuration | - |
| Use custom configuration | If you require observer configuration options that are not available in this policy, enable this checkbox and input your observer configuration in the following field. With this checkbox enabled, your custom configuration overrides all other fields in this policy. |
| Custom observer configuration | Use this field to input a custom observer configuration. This field is displayed only if the Use custom configuration checkbox is enabled. |
| Model Configuration | The fields in this section control how Business Transaction Management models particular types of components.
Warning: You should adjust these fields to the proper setting before the observer is installed and discovers components. If you edit these settings for components that have already been discovered, you might have to modify your existing transaction definitions or reset your model (see Section 10.11, "deleteAll" for information on how to reset your model). |
| SOA | This field controls how SOA components are modeled. Choose between these options:
Model All - Model all SOA components. Model Edge of Flow - Model only the first component of each SOA composite application, for example, a web service interface. This is the default setting. |
| Local EJB | This field controls how local EJB components are modeled. It does not affect the modeling of remote EJB components (all remote EJBs are always monitored). Choose between these options:
Model All - Model all local EJB components. Model None - Do not model local EJB components. This is the default setting. Model Edge of Flow - Model only the first local EJB component of each local request flow. Model ORA-WS - Model only those local EJB components that implement business logic for Oracle Web Services (ORA-WS) web services based on the presence of any of the following annotations on their EJB implementation classes:
This option is designed specifically for ORA-WS, which is primarily used in Oracle packaged applications like Fusion Applications. |
| OSB | This field controls how Oracle Service Bus components are modeled. Choose between these options:
Model All - Model all Oracle Service Bus components, including OSB business services, proxy services, split-join tasks, and the parallel flow of messages issuing from split-joint tasks. Model Edge of Flow - Model only proxy services. This is the default setting. |
| JMS | This field controls how JMS topics, queues, and message listeners are modeled. Choose between these options:
Model All - Model all JMS topics, JMS queues, and their associated message listeners. Model Edge of Flow - Model only the message listeners associated with JMS topics. This is the default setting. |
| JDBC Summary | The fields in this section control JDBC Summary Mode. When JDBC Summary Mode is enabled, observations of related JDBC calls are aggregated and sent to the monitor as a single summary observation message. Enabling Summary Mode can improve your BTM system's performance and reduce its database disk space requirements, particularly if your monitored services make heavy use of JDBC calls and you have enabled message logging on these operations. These gains are achieved both by reducing the volume of observation messaging and by constraining the number of JDBC calls written to the message log database. Options are provided that allow you to control the constraints on message logging.
Note: JDBC Summary Mode does not affect the collection, recording, or display of performance measurements, such as response time. |
| Enable Summary Mode | Use this field to enable or disable JDBC Summary Mode. This setting is enabled by default. |
| Number of Slowest JDBC Calls to Log | Specify how many of the slowest JDBC calls should be logged. For example, if you specify 2, only the two slowest calls will be included in the summary observation message and then logged to the message log database (assuming that message logging is enabled for the operation). The default value is 3 calls. |
| Time Limit for JDBC Calls | Deprecated. In future releases this feature will only send system alerts when the specified time limit is reached. Oracle Corporation recommends that you set this time limit to be greater than the longest time expected SQL query time. Specify in seconds the longest period of time you think any JDBC call should require for completion. If any JDBC call surpasses the time limit, the summary observation message is sent immediately. This incomplete summary observation message serves as a warning that queries are taking longer to complete than you expected (the uncompleted JDBC call is indicated by a value of time out as its response time). If an incomplete JDBC call later completes, or other related calls are observed, then a follow-up summary observation message is sent that combines the information from the previous summary message with the information from the now completed and/or newly observed call or calls. The default value is 10 seconds. |
| Number of Fault Messages to Log | Specify how many fault messages should be logged. For example, if you specify 1, only the first fault message received will be included in the summary observation message and then logged to the message log database (assuming that message logging is enabled for the operation). If you specify 2, the first and last will be logged. If you specify 3, the first, second, and last will be logged (and so on). The default value is 2 faults. |
| Only capture summaries when the caller is configured to capture content | Normally, when an endpoint is included in a transaction and logging is enabled, messages are captured even for invocations of the endpoint from outside the transaction.
Check this box to log message content (for fault and slowest messages) only if logging is enabled for JDBC and for operations calling JDBC. (Logging is enabled for operations calling JDBC either because instance logging is turned on for the transaction as a whole or because logging is turned on for the calling operation.) If you do not check this box, all messages sent to the JDBC endpoint will be counted even if the caller is not included in the transaction. Content will be logged for fault messages and slowest messages. |
12.1.3 Logging Observer Errors and Debugging Information
The observer writes error and debugging information to the following log files:
-
NanoAgentErrorTrace.log – contains single occurrences of all errors and warnings logged to the other log files. Each error and warning entry is referenced by a unique identifier within a <Ref> element, for example:
<Ref: Dq/QGNWqOmbdXPigC+vsO40eXgs=>
You can use this identifier to search for all occurrences of the error or warning in the other log files, typically within NanoAgent.log. This is generally the first log file you should check when a problem occurs.
The default size of this log file is 10M and it is recreated on each restart of the server. However, because its default rotation is set to 2, the previous log file is retained after a server restart.
-
NanoAgent.log – contains runtime errors, configuration-related errors, and debugging information (you can adjust this logger's settings using the Enable trace logging option in the Observer Communication policy.)
-
NanoAgentPreprocessTrace.log – contains information about bytecode instrumentation errors and debugging, class-loading, and preprocessing. This file is regenerated on each restart of the server. The maximum size of this log file is 10 MB.
This file was renamed for release 12.1.0.2.2. For observers of previous releases, the file was named AWTrace.log.
Note:
You can also configure the observer to log observed messages. For information on this topic, refer to the Log observed messages to file entry in Section 12.1.2.11, "Advanced Settings Field Reference."The default location of the log files is as follows:
-
WebLogic – the domain_root_directory/nanoagent/logs/server_name directory (if that directory cannot be determined, then it defaults to the domain root directory)
-
OC4J – the j2ee\home directory inside your SOA Suite installation directory
-
Enterprise Gateway – the home directory (top-level installation directory) of the Enterprise Gateway server.
-
WebSphere – the profile directory
-
JBoss – the JBOSS_HOME/bin directory
-
WCF and ASP.NET – the C:/temp/NanoAgentBaseDir directory
Note:
The default log location for WCF and ASP.NET is not a true default. It is simply the default setting of the AmberPoint:NanoLogBaseDir key. If you set this key to null, log files will not be created.If you want the log files generated in a different directory, set the AP_NANO_LOG_BASEDIR Java property or AmberPoint:NanoLogBaseDir Windows key. For Java application servers, you can set the property to either an absolute path or a path that is relative to the default log directory. For Enterprise Gateway, WCF and ASP.NET, you must set the property or key to an absolute path. The following examples illustrate how to set this property or key:
-
On WebLogic, if you configure your server by editing local scripts, edit the nanoEnvWeblogic script located in WL_HOME/nanoagent/bin directory. In the options section of the file, add -DAP_NANO_LOG_BASEDIR="my_log_dir" to the end of the NANOAGENT_JAVA_OPTIONS. This relative path would generate the log files in the directory my_log_dir under your domain directory.
If you configure you WebLogic server using the Node Manager, open the WebLogic Administration Console, select your server, and display the Configuration / Server Start tab. Then add -DAP_NANO_LOG_BASEDIR=my_log_dir to the Arguments field. This relative path would generate the log files in the directory my_log_dir under your domain directory.
-
On OC4J, add -DAP_NANO_LOG_BASEDIR=my_log_dir to the Java startup options. This relative path would generate the log files in the directory my_log_dir under the j2ee\home directory inside your SOA Suite installation directory.
-
On Enterprise Gateway, open OEG_HOME/system/conf/jvm.xml in a text editor and add <SystemProperty name="AP_NANO_LOG_BASEDIR" value="C:\OEG\my_log_dir"/> as a child of the <JVMSettings> element. This absolute path would generate the log files in the directory C:\OEG\my_log_dir.
-
On WebSphere, in the WebSphere Administrative Console, navigate to Servers > Application servers > server1 > Server Infrastructure > Java and Process Management > Process Definition > Java Virtual Machine > Custom Properties (you might have to substitute a different server name for server1). Create a custom property named AP_NANO_LOG_BASEDIR and set it's value to my_log_dir. This relative path would generate the log files in the directory my_log_dir under your profile directory.
-
On JBoss, edit your server startup script JBOSS_HOME/bin/run. In the options section of the file, add set JAVA_OPTS=-DAP_NANO_LOG_BASEDIR="my_log_dir". This relative path would generate the log files in the directory JBOSS_HOME/bin/my_log_dir.
-
For WCF or ASP.NET, edit the application configuration file (for example, Web.config) and set the value for the AmberPoint:NanoLogBaseDir key to C:/Inetpub/wwwroot/my_log_dir. This absolute path would generate the log files in the directory my_log_dir under your default web site directory, for example:
<configuration>
 <configSections>
  ...
 </configSections>
 <AmberPoint>
  <NanoAgentDataSection>
   <add key="AmberPoint:NanoConfig" value="c:/temp/NanoAgentLogBaseDir/nanoagentDiscovery.CONFIGURATION"/>
   <add key="AmberPoint:NanoLogBaseDir" value="c:/Inetpub/wwwroot/my_log_dir"/>
   <add key="AmberPoint:NanoCreateLogBaseDir" value="false"/>
  </NanoAgentDataSection>
 </AmberPoint>
 <system.web>
  ...
 </system.web>
</configuration>
In order for the observer to generate the log files, ensure that the user under which the observer is running has permission to write to the log directory. For Java observers, the user is the user that is running the application server. For IIS observers (WCF and ASP.NET), the user is as follows:
-
IIS 5.x – the observer user is ASPNET
-
IIS 6.x and 7.x – the observer user is NETWORK SERVICE
By default, the directory specified by the AP_NANO_LOG_BASEDIR property is automatically created if it does not exist. If you do not want this directory to be automatically created, set the property AP_NANO_CREATE_LOG_BASEDIR to false. In this case, you must create the directory yourself. Set this property in the same way you set AP_NANO_LOG_BASEDIR.
Notes:
For Java application servers – If the log directory does not exist and AP_NANO_CREATE_LOG_BASEDIR is set to false, runtime errors might occur and the observer might not initialize.For IIS – If the NanoLogBaseDir Windows key is set to null, log files are not created.
12.2 Persistent Data
This section provides information to help you administer Business Transaction Management persistent data and includes the following subsections:
-
Configuring the Business Transaction Management Database Credentials
-
Relocating Business Transaction Management Persistent Storage Directories
12.2.1 Configuring the Business Transaction Management Database Credentials
When you installed Business Transaction Management, you configured it to use an Oracle database. If the credentials used for accessing the database change, you must modify the associated setting in Business Transaction Management accordingly.
To modify the database credentials setting:
-
Choose Admin > Edit Database Settings.
The Edit Database Settings tool opens. This tool lets you set the user name and password used by the Business Transaction Management central services to access the Business Transaction Management databases.
Note:
Do not select the Embedded Database option. All three databases should have the External Database option selected. -
Edit the user name and password as appropriate for each database.
-
Click Apply.
12.2.2 Setting up the Message Log Database
If you enable message logging on a transaction, then you must ensure that a database is set up for the monitors to log messages to. During installation and initial configuration of Business Transaction Management, you should have created a message log database (messageLogDB) and provided connection settings for this database. These connection settings were automatically stored in the Default Message Log Database policy and applied to all monitors.
However, you are not restricted to using a single database for message logging. You can create additional databases and configure some monitors to use one database and other monitors another database. You do this by first editing the Criteria section of the default policy so that the policy no longer applies to the monitors that will log to a different database. You then create a new policy for each new database, and use each policy's Criteria section to apply the policy to the appropriate monitors. You must take care that each monitor has only one policy applied to it. For information about creating a message log database, refer to the Business Transaction Management Installation Guide.
If you change the location or the logon credentials of any of your message log databases, then you must reconfigure the settings your monitors use to connect to it. You do this by editing the appropriate message log database policy.
To view the monitors to which an existing message log policy is applied:
-
Select Administration > System Policies in the Navigator.
-
Select the policy in the main area.
-
Click the Targets tab.
To edit or apply a new message log database:
-
Create or identify the Oracle database instance that you want to use for your message log database.
-
Open the message log database policy you will use for configuring the database connection:
If you want to edit the default message log database policy:
-
Select Administration > System Policies in the Navigator.
-
Select the Default Message Logging Database Policy in the main area.
-
Choose Modify > Edit Definition for Default Message Logging Database Policy.
If you want to apply a new message log database policy, choose Admin > Create System Policy > Message Log Database.
The Create Message Log Database policy opens.
-
-
Ensure that the Database Type is set to Use External Oracle Database.
-
If you want to allow Business Transaction Management central services to directly access the message log database, ensure that the Allow Central Access option is enabled.
If this option is disabled, the central services can access the message log database only by way of the monitor.
Some central services (such as the transaction monitoring component) require access to message content stored in the message log database. These central services can access the database either by way of the monitor or by a direct connection. Using a direct connection improves the performance of message log queries. You should enable this communication channel whenever possible.
In some deployment scenarios, you might not want the central services querying the database directly and would prefer that the monitor do so on their behalf. One such case is when the monitor and database are firewalled off from the central services. In such a scenario, the central services could communicate with the monitor, but presumably not with the database.
-
Provide a connection string and user credentials for accessing the database.
The user whose credentials you provide must have privileges to create and drop tables and indexes.
-
Adjust the Maximum Transaction Metrics Rows, if necessary.
In the beginning, you should probably leave this at the default setting.
This field specifies the maximum number of rows recorded in the temporary tables used for tracking individual transaction start and end messages prior to the computation of aggregated transaction measurements. Increasing the value allows the performance server to process transaction measurements more efficiently at the expense of more disk usage by the message log database.
-
You can edit advanced options by enabling the Show Advanced Options checkbox.
The following table describes the advanced options:
Advanced Options UI Default Setting Description Indexer Tuning Parameters - - Use Auto Statistics enabled Boolean If this parameter is enabled, the monitor gathers database statistics from the database on a regular basis. It is essential that up-to-date database statistics are maintained to allow message log queries to run efficiently. The statistics are gathered based on the number of inserts to the database that have occurred.
Log Bundle Read Batch Size 300 Integer Determines how many messages are processed by the indexer in a single database transaction.
Indexer Wakeup Interval 10 Integer - time (in seconds) Determines how often the indexer should wake up to check for any impending work.
Clean Database Check Interval 120 Integer - time (in seconds) Determines the interval at which the indexer performs various maintenance tasks. When performing maintenance, the indexer:
-
Deletes expired information from the database.
-
Cleans the summary statistics table.
-
Removes database tables which hold the result from expired cursors.
Clean Cursors Check Interval 3600 Integer - time (in seconds) Determines the interval at which the indexer will remove expired query results from the database.
Although this task is part of the indexer's normal maintenance, this may need to be done more often than other tasks.
Stop Indexing disabled Boolean If set to true, this option tells the indexer to suspend all activity. Content to be indexed will still be captured by active logging policies, but will not be transferred from on-disk storage into the database until indexing is resumed.
This option is especially useful during times of heavy message traffic, when optimization of resources and a steady flow of traffic is more important than being able to inspect indexed messages. You can later set the Stop Indexing value to false to allow Business Transaction Management to index the messages and enter them into your database.
Note: Be aware that during the time the indexer is suspended, Business Transaction Management does nothing to manage the disk space being used. It is up to you to make sure that there is enough empty disk space to capture messages being logged by logging policies.
Database Error Min Delay 10 Integer - time (in seconds) Specifies the minimum amount of time the indexer will wait before retrying logging-related database operations when a database error occurs. On each successive failure, the delay will be adjusted upward by multiplying the current delay by the value of the Database Error Delay Expansion Factor parameter. The maximum wait time between retries is bounded by Database Error Max Delay.
An example of a database error that this parameter applies to would be the monitor being unable to contact the database. For example, at the default settings, if the monitor loses its connection to the database, it will attempt to reconnect after 10 seconds. If it cannot reconnect, it will wait 20 seconds and try again, and so on. The longest it will wait between attempts is 3600 seconds (1 hour).
Database Error Max Delay 3600 Integer - time (in seconds) See description for Database Error Min Delay.
Database Error Delay Expansion Factor 2.0 See description for Database Error Min Delay. Max Messages Indexed per Bundle Run 5000 Integer Limits the maximum number of messages indexed for a particular endpoint on each indexer run. All endpoints in a single monitor are indexed by a single worker.
Maximum Indexer Query Execution Time 300 Long - time (in seconds) Specifies an upper-bound time limit on the run time of any indexer-initiated query.
Maximum Query Execution Time 30 Long - time (in seconds) Specifies an upper-bound time limit on the run time of any user-initiated query. Users may initiate long-running queries against the message log. Once submitted, users do not have a way to cancel the query and must wait for it to complete.
The default value for this parameter is 30 seconds. Setting this value to 0 allows all queries to run to their completion regardless of their complexity. For this reason, this setting (0) is not recommended.
Num Indexer Worker Threads 3 Long Specifies the number of worker threads used by the log policy indexer. The indexer cycles through the endpoints with applied logging policies and indexes each endpoint in turn. Adding threads allows for more endpoints to be indexed concurrently.
Metadata Insert Batch Size 300 Long Controls metadata insert statements. This parameter specifies the number of rows of a particular type to batch together before running a SQL statement. The actual batch size is also influenced by the Log Bundle Read Batch Size parameter because it sets the maximum transaction size.
Message Insert Batch Size 30 Long Controls message insert statements. This parameter specifies the number of rows of a particular type to batch together before running a SQL statement. The actual batch size is also influenced by the Log Bundle Read Batch Size parameter because it sets the maximum transaction size.
Num User Query Connections 5 Long Specifies the number of connections to the message log database that should be created for the purpose of user queries. The pool is a shared pool and consists of connections created for system processing (controlled by Num Indexer Worker Threads) and connections for user queries (controlled by Num User Query Connections).
Reuse Tables disabled Boolean The Rotation Interval setting in the Message History policy controls how long messages are retained in the database. By default, messages are deleted by deleting tables and added by adding tables. Enable this setting if you want to reuse tables rather than delete and create new tables. The tables are cleared before being reused. In most scenarios, it is more efficient to leave this setting disabled.
Min Entries per Fragment 0 Long Messages are stored in sets of tables, called fragments. This setting specifies a minimum number of messages a fragment must have before being rotated. This constraint is in addition to that of the Rotation Interval setting in the Message History policy. Note: a request/response pair is considered to be two messages.
Indexer Setup Data Version - - label.IndexerSetupData.generateEndpointStatistics disabled In general, you should enable this field only if requested to do so by the Oracle support team. If a monitor is managing an endpoint that participates in a transaction, then the monitor will be running the message indexer (the out-of-band indexer) for the purpose logging. When the message indexer is running in a monitor, the monitor's Status tab includes information about the performance of the message indexer. By default, the tab displays summary indexer statistics for all the endpoints for which message indexing is active. If you enable this setting, the tab's indexer statistics include detailed performance information for each endpoint participating in message indexing.
-
-
In the Criteria section, choose the monitors that will log to the database.
Note:
Take care that you do not apply more than one message log database policy to any single monitor. This means that if you are applying a new message log database policy, you must first edit the Criteria section of your existing policies so that they don't apply to the same monitors as your new policy. If you apply more than one message log database policy to a single monitor, Business Transaction Management generates a system alert.All monitors in a monitor group must log to the same message log database.
-
Click Apply.
12.2.3 About Persistent Storage Directories
At initial startup, Business Transaction Management creates a set of persistent storage directories to collect system output log entries and store user preferences for the system deployments. By default, the persistent storage directories are created within the application server's installation directory at WL_install_dir/user_projects/domains/domain_name/servers/server_name/btmstorage/*.
Your company's in-house procedures and rules for persistent storage might require you to place the persistent storage directories in a different location. In such a case, you can reconfigure the location of the persistent storage directories.
An installed Business Transaction Management system is composed of a set of deployments (EAR files), which are themselves composed of subdeployments (WAR files). Each subdeployment has an associated persistent storage directory of the same name, minus the “.war”. The following table lists the names of the deployments, subdeployments, and persistent storage directories.
Table 12-2 Business Transaction Management deployments, subdeployments, and persistent storage directories
| Deployments (EARs) | Subdeployments (WARs) | Persistent storage directories |
|---|---|---|
|
btmMain |
btmui btmcentral btmcontainer |
btmui btmcentral btmcontainer |
|
btmPerformanceServer |
btmcontainer btmperformance |
btmcontainer btmperformance |
|
btmTransactionServer |
btmcontainer btmtransaction |
btmcontainer btmtransaction |
|
btmMonitor |
btmmonitor |
btmmonitor |
12.2.4 Relocating Business Transaction Management Persistent Storage Directories
This topic explains how to change the default location of the persistent storage directories for Business Transaction Management deployments to a location outside of the container that hosts these deployments.
This topic contains the following subsections to guide you through the steps required to relocate persistent storage directories:
-
General Instructions for Relocating Persistent Storage Directories
-
Detailed Instructions for Relocating Persistent Storage Directories
12.2.4.1 Backup Before Relocating Persistent Storage Directories
Before following the procedure for relocating persistent storage directory locations, it is very important that you backup any persistent storage directories that already exist in the default location in your container. These default persistent storage directories are created the first time you start up your Business Transaction Management deployments, and are listed in the sections below for each container. You will later need to copy the contents of these directories to the new location you have defined for each deployment's persistent storage directory.
If you do not backup and remove the existing persistent storage directories, the settings in your new persistent storage directories might not be loaded and used the next time you restart Business Transaction Management. By default, Business Transaction Management references the default locations for the deployments' persistent storage directories. If the default directories still exist after you have set their new location, the new location might not be recognized. User preferences are also contained within these storage directories. Business Transaction Management reads these user preference files on each restart.
The default location of the persistent storage directories is WAS_install_dir/profiles/profile_name_name/btmstorage/node_name/server_name/*.
You should document where you relocate your persistent storage directories because you will have to define their location again if you redeploy Business Transaction Management applications (for example, during an upgrade). It is also important to document your new persistent storage directory locations if you want to use the LogMerger tool to collect and merge output of system log messages from these locations. It is easiest to create a configuration file for the LogMerger tool, as that will also act as a documentation source for your new persistent storage directory locations. For more about the LogMerger tool and creating a configuration file for the tool, see Section 11.3, "logMerger utility."
12.2.4.2 General Instructions for Relocating Persistent Storage Directories
The following steps outline the general instructions to relocate the persistent storage directories.
-
Shutdown your Business Transaction Management deployments.
-
Backup your persistent storage directories and place them in a safe location.
-
Modify persistent storage directory locations in each deployment's web.xml file.
-
Move backup copies of the persistent storage directories to the new persistent storage directory locations.
Note:
If you do not plan to use the information already collected in the persistent storage directory in the new location, you must create an empty persistent storage directory in the new location using the same name as the original storage directory. -
Package and redeploy, if required, each deployment whose persistent storage directories you want to relocate.
-
Restart your deployments.
-
Confirm new system output log (logdir) entries in the new locations.
12.2.4.3 Detailed Instructions for Relocating Persistent Storage Directories
The Business Transaction Management deployments can be found in the following directory locations. You will need to locate these deployments in order to edit the location of the persistent storage directory in each deployment's web.xml file:
WL_install_dir/user_projects/domains/domain_name/server_name/ .wlnotdelete/extract/server_name_n_n/public/btmstorage/*
For example, the btmcentral deployment is located in this directory:
WL_install_dir/user_projects/domains/domain_name/server_name/ .wlnotdelete/extract/server_name_btmcentral_btmcentral/public/btmstorage/btmcentral
To relocate persistent storage directories:
-
Shut down your Business Transaction Management deployments.
-
Backup the contents of the current default persistent storage directories and place them in a safe place.
-
Modify persistent storage directory locations in each deployment's web.xmlfile:
-
Locate the exploded war file for the deployment whose storage directory you want to change.
-
From the exploded war file, open the deployment's WEB-INF/web.xml file in a text or XML editor.
-
Set the new location for the persistent storage directory by setting the
storageDirectoryparameter value for that deployment as follows:Edit the AmberPointDefault value in the following lines and set it to the location of the new storage directory:
<!-- PERSISTENT STORAGE DIRECTORY To set the persistent storage area to some value, change the value of param-value to some EXISTING directory where you want things stored. -->
<context-param>
<param-name>com.amberpoint.storageDirectory</param-name>
<param-value>AmberPointDefault</param-value> </context-param>
Note:
You must not change the names of the persistent storage directories. You may change only the path to the directories.
Examples:
-
On Windows systems – if you want the persistent storage directory for btmcentral to be in
C:\btm_data\btmcentral, change the default entry within your btmcentral web.xml file to the following:<context-param> <param-name>com.amberpoint.storageDirectory</param-name> <param-value>C:\btm_data\btmcentral</param-value> </context-param>
-
On Unix-like systems – if you want the persistent storage directory for btmcentral to be in opt/webserviceapplogs/btm_data/btmcentral, change the default entry within your btmcentral web.xml file to the following:
<context-param>
<param-name>com.amberpoint.storageDirectory</param-name>
<param-value>/opt/webserviceapplogs/btm_data/btmcentral</param-value>
</context-param>
-
-
Create the new empty persistent storage directory in the new location (if you want to start from scratch), or move the backup copy of the original persistent storage directory to the new directory location.
-
If required, undeploy and redeploy each deployment whose persistent storage directories you want to relocate as follows:
Note:
When repackaging system deployments, make sure to include the manifest file associated with the deployment, as this file contains important information required for deployment.-
Package the new deployment that includes the edited web.xmlfile into a new application war file.
-
Undeploy the existing deployment using the WebLogic Console.
-
Shut down the WebLogic server and delete the original persistent storage directory.
Note:
You must delete the persistent storage directories from their default locations. If the deployments find persistent storage directories in their default locations, they will ignore the new directory locations. -
Restart WebLogic and redeploy the new system deployment using the WebLogic Console.
-
-
Restart your deployments.
-
Confirm new system output log (logdir) entries in the new locations.
Data should now be written to the persistent storage directory locations you defined in each deployment's web.xml file. Check to make sure new system service log files (logdir) and other directories have been created in the new location upon container startup.
If you use the
logMergertool to merge system service logs, make sure that you refer to the new persistent storage directory locations when merging log files.
12.3 Business Transaction Management System Security
This section provides information to help you administer Business Transaction Management system security and includes the following subsections:
12.3.1 Authentication and Role Mapping
Business Transaction Management relies on the WebLogic server in which it is deployed for authentication and association of roles with users. By default, authentication is enabled for the Management Console. To disable authentication, use whatever tool or procedure is appropriate for the application server you are using.
Note:
In order to log into the Management Console, you must use credentials that are mapped to at least one of these Business Transaction Management user roles: btmAdmin, btmUser, or btmObserver.If you disable authentication, users of the Management Console must still log in. However, they can log in using any user name and are not required to provide a password. Note that all UI personalizations, such as edits to the Navigator, filters, and column sets are stored as preferences and associated with the user name.
This topic describes how the supported application servers authenticate users and map them to Business Transaction Management application roles.
12.3.1.1 Summary of Initial Application Role Mapping
Note:
The role btmInspector is, by default, mapped to a group named btmInspectors, but the application server administrator must create a group named btmInspectors and assign it to the appropriate users.12.3.2 Business Transaction Management Application User Roles
Business Transaction Management uses roles to authorize access to various parts of the user interface.
12.3.2.1 Primary Roles
Each user must be assigned at least one primary role. The primary roles are:
btmAdmin – users with this role are granted all privileges. These users can use all tools and facilities provided by the Business Transaction Management Console, including the ability to view and create sensitive properties and to view all message content.
btmUser – users with this role have most privileges needed to configure basic monitoring. For example, they can configure monitors; create, edit, and delete policies (does not include system policies); register services; set registry attributes on services and endpoints; and create and edit transactions and conditions. They also have all the privileges of btmObserver. This role does not grant the privilege to modify the Business Transaction Management environment, access message content, or view or edit sensitive properties.
btmObserver – users with this role have privileges to use most of the basic monitoring facilities. They can view summary, dependency, and administrative information about the monitoring system, but are not allowed to configure any of the policies or settings related to it. They can also view transactions and conditions, but are not allowed to create or edit them. This role does not allow users to modify the Business Transaction Management environment, access message content, or view or edit sensitive properties.
Note:
All navigation and views in the Management Console are available to all primary roles. However, some roles cannot access certain menus and menu items and the tools associated with them.12.3.2.2 Auxiliary Role
In addition to the primary roles, Business Transaction Management defines an auxiliary role. The auxiliary role provides additional privileges that you might want to assign certain users. For example, you might want to let a user access message content but not want to give that user full administrative privileges. You could do this by assigning the user a primary role of btmUser and an auxiliary role of btmInspector. The auxiliary role is:
btmInspector – users with this role can view message content and view and create properties, including sensitive properties.
Note:
The btmAdmin role has all of the privileges of btmInspector.12.4 Backing up and Restoring Business Transaction Management
The following sections explain how you back up and restore your system. The topics covered include the following:
12.4.1 About the Back up and Restore Process
Oracle Business Transaction Management stores a large amount of data. This data describes the system's configuration, what the system is monitoring, and the current and past states of monitored applications. All of this data is needed for the operation of the system; if something happens that causes this data to be lost or damaged, the system can no longer perform as you expect. This is why it is important to create a backup of the system's data and to be able to recover this data.
You might need to back up Business Transaction Management for different reasons:
-
on a regular basis to enable recovery from unforeseen events
-
before migrating to a new sphere
-
before upgrading an application server in the Business Transaction Management environment or adding an application server
-
before installing a new version of Business Transaction Management
This section offers general guidelines for backup and recovery, and suggests milestones for testing the process you have defined. How often you create a checkpoint by backing up your data depends entirely on the lifecycle stage of your application and on business requirements.
Backing up and restoring Business Transaction Management does not include the backup and recovery of the hosting application server and its configuration settings, some of which Business Transaction Management needs to function properly: JVM settings, Java System parameters, and so on. You should already have processes in place for backing up your application servers and their configurations.
12.4.1.1 Before You Back Up
Business Transaction Management operates in a complex environment. For this reason, before backing up, it is important to make sure that you can isolate Business Transaction Management components and that you can identify any other systems that might be affected by the backup and recovery process. Consider issues like the following:
-
Databases might be shared with components other than Business Transaction Management. Unless the problem is database failure itself, it is important to restore only those database instances that are used by Business Transaction Management.
-
Recovery might affect other systems. For example, if Business Transaction Management shares JDBC drivers with other applications, recovery might restore a driver to a previous version and cause other applications using the driver to fail.
12.4.1.2 Testing the Backup and Recovery process
You should test your backup process periodically by attempting a recovery and making sure the system can be brought up to the desired state with no side effects. Identifying and resolving problems with the backup process will ensure successful recovery when recovery matters. Your backup verification checklist should include things like the following:
-
database and file system structure, and permissions are as expected
-
Business Transaction Management is functional and in the expected state: the console shows everything is running, services are reachable, traffic flows normally, and so on.
-
no application sharing the same resources is adversely affected.
12.4.2 Backing up Business Transaction Management
This section describes how Business Transaction Management data is organized, explains how you back up each type of data, and discusses timing issues related to backups.
12.4.2.1 How Business Transaction Management Data Is Organized
The next figure shows the various kinds of Business Transaction Management data and the Business Transaction Management system services that rely on this data.
Description of the illustration btm_backup_data.gif
With reference to the figure, the basic principle of backing up data is as follows:
-
All data contained in databases is backed up by backing up the database.
-
All data contained in files or directories is backed up by backing up the
btmstoragedirectory, which can be found on every host where one of the Business Transaction Management system services or monitors is deployed. The location of this directory for your server is specified in Section 12.4.2.2, "Backing up Business Transaction Management Data."
The rest of this section provides more information about elements shown in the previous figure. You do not need to know this level of detail just to do backup and recovery. But this detail might be helpful in troubleshooting and in understanding the resources used by Business Transaction Management. If you want, you can skip ahead to Section 12.4.2.2, "Backing up Business Transaction Management Data."
As the figure shows, Business Transaction Management is composed of multiple system services:
-
The sphere, responsible for the overall operation of Business Transaction Management and coordination of its member services
-
The SLM service, responsible for gathering performance measurements
-
The ExM service, responsible for transaction management
-
Monitor agents, responsible for collecting data from observers
Each of these services depends upon data that specifies the system's configuration, describes what it is monitoring, and records the state of monitored applications. This data can be grouped into the three categories shown in the figure.
-
Definitional metadata is stored in two places and contains the following information:
The Sphere database contains data that describes Business Transaction Management as well as the monitored user systems. It includes a description of the users' applications, the policies used to monitor them, and transaction definitions.
Monitor agent configuration files contain data that describes whether and how each user endpoint is being monitored.
-
Operational data is the information Business Transaction Management gathers about user applications: performance and behavioral metrics, logged messages, transaction instances, and generated alerts. This information is stored in the Measurement, Transaction, and Agent Message log databases shown in the figure.
-
System configuration data controls the basic behavior of Business Transaction Management: what databases it connects to, the address a container should use to connect to the sphere, default GUI views and layout. This information is saved in various configuration files: initial configuration data, GUI customization, setup data, container registration, and miscellaneous configuration files.
12.4.2.2 Backing up Business Transaction Management Data
Backing up Business Transaction Management is fairly simple: you back up data contained in databases by backing up the respective database; you back up data contained in files or directories by backing up the btmstorage directory.
The btmstorage directory can be found on every host where one of the Business Transaction Management system services or monitors is deployed at this location:
WebLogic_InstllDir/user_projects/domains/MyDomain/servers/MyServer/btmstorage
Once you have backed up the databases and the btmstorage directory, you are done with the backup process.
In general it is best to back up and recover all data, even if only a subset of your data has been damaged or lost. However, if you would like a more detailed understanding of the individual components used by Business Transaction Management, see Section 12.4.4, "Data Storage Reference."
12.4.2.3 Timing Backups
The timing of backups is important: you should back up the databases and the btmstorage directory as close together in time as possible. If possible, follow these guidelines:
-
Quiesce the system if possible.
-
Back up the
btmstoragedirectories. -
Back up the databases, with the Sphere data last.
12.4.3 Restoring Business Transaction Management
The goal of restoring Business Transaction Management is to bring it back to the desired state with no side effects. Before you start this process, make sure that you have complete and accurate information about the Business Transaction Management system you are trying to restore.
It is assumed that you are restoring Business Transaction Management to the same environment from where it was backed up. If you need to recover to a different environment, for example, in the case of hardware failure; you will need to change the host name of the machine where you restore to (at the operating system level) to the host name of the machine that failed. You will also need to make sure that Business Transaction Management services hosted on the new machine can run on the same ports as on the old machine. It will then be possible to recover services to the new machine without disruption.
The restore procedure recovers the whole system to the last checkpoint created by the backup process.
Note:
After the restore, the database schema and the file system must reflect the state they were in at the time of the backup. To make sure this happens, before you restore, check that the existing database and storage directory is completely clean. Because the data in the two storage locations are connected in various ways, problems can arise if either holds data that is newer than the backed up data. Thus, you should never restore a backup on top of an existingbtmstorage directory. Most database restores take care of this issue; be sure yours does.The restore procedure consists of two steps:
-
Restore databases
-
Restore the
btmstoragedirectory on each server hosting a system service or monitor.
In the case where there is some damage to the Business Transaction Management software itself because something has damaged or corrupted the installed instance, we recommend that you do the following.
-
Reinstall the Business Transaction Management software.
-
Restore the
btmstoragedirectory on each server hosting a system service or monitor agent. -
Restore the databases.
Note:
If the damage affects only the EAR, WAR, or JAR files themselves, a simple re-installation of the Business Transaction Management software is all that is required12.4.4 Data Storage Reference
The following table offers some additional detail about the Business Transaction Management components. This detail might be helpful to understand the role of each component or to locate specific information.
12.5 Migrating Data
This section summarizes the steps required to migrate data from one environment to another. For example, you might need to do this when you migrate from a testing to a production environment.
To migrate data from one environment to another, do the following:
-
Always backup your system before you migrate data. For information about backing up your system, see Section 12.4, "Backing up and Restoring Business Transaction Management."
-
Use CLI commands to export your data as follows. It does not matter in which order you do the export:
-
Use the
exportProfilecommand to export property definitions. If you have no properties defined, you do not need to do this. -
Use the
exportTransactionDefnscommand to export transaction definitions. -
If you do not use autocreation of business objects, use the
exportBusinessObjectscommand to export consumer data. -
If you have created downtime schedules you plan to use in your new environment, use the
exportSchedulescommand to export these. -
Use the
exportPoliciescommand to export policy definitions.You only need to export user-defined policies. These are most likely to be SLA policies. You do not need to, and should not, export system policies or policies created for the transaction. System policies relate to the configuration of your environment, which is likely to differ in the new environment. System-generated policies for your transaction will be automatically re-created when you import the transaction definition.
-
-
Install and configure your new BTM environment.
Make sure that the new system has an opportunity to observe everything in the production environment that you used to create the transactions you exported. If you know what services your transactions include, you can use the BTM console to look for the services you need and to make sure that they have been observed.
-
Use CLI commands to import your data in the order shown:
-
Use the
importProfilecommand if you have exported any profiles. -
Use the
importTransactionsDefnscommand to import transaction definitions.If an import fails, this is most likely due to the fact that the system has not observed a service that is included in your transaction. You can run more traffic, and then try the import again.
-
Use the
importPoliciescommand to import policy definitions.
-
Your transactions should now be functional in your new environment. You should run some traffic to make sure that transaction monitoring is working as expected.
12.6 Setting up Load Balancers
Setting up load balancers allows Business Transaction Management to model the flow of traffic correctly and allows you to access the load balancer's administrative console from the Business Transaction Management console.
This section also explains how you set up an F5 device to load balance messages from one observer to multiple monitors. It includes the following sections:
12.6.1 Setting up a Load Balancer
If you deploy a service in more than one container, Business Transaction Management understands these replicated endpoints are part of the same service, and it can infer the existence of a load balancer that routes messages to these replicated endpoints. That is, Business Transaction Management can model the flow of traffic correctly in dependency diagrams even though it does not monitor the flow of traffic through the load balancer itself. However, without your help, Business Transaction Management cannot provide more detailed information about the inferred load balancer. Setting up a load balancer means giving Business Transaction Management information that allows it to do the following:
-
provide information about the load balancer in the management console; for example, the name you want displayed for it and the vendor associated with it
-
identify the device hosting the load balancer
-
give you easy access to the load balancer's administrative console
-
specify the lifecycle phase of the load balancer device and all the endpoints that are created within it
Setting up a load balancer starts with registering it, which you can do using either the CLI command registerDevice or using the management console. In some cases, you might also need to specify an entry point to the load balancer and define target entry points that correspond to the destinations where messages are being routed.
This section explains some basic terms related to load balancing, describes the devices that Business Transaction Management supports, and explains the following user tasks:
-
Registering a load balancer
-
Modifying information about a load balancer
-
Adding entry points to show routing relationships
-
Unregistering a load balancer
Business Transaction Management supports a variety of load-balancing devices. It provides the greatest support for F5 load balancers, but it can also recognize and model other hardware and software load balancers.
12.6.1.1 Basic Terms
The figure below illustrates the use of a load balancer to route messages A and B to three replicated endpoints (E1, E2, E3). Note the elements marked: routing entry point and target entry point. The load balancer receives messages at the routing entry point and forwards them to the target entry points. There are situations in which you might have to supply entry point information after registering the load balancer, as described in the next section.
12.6.1.2 Supported Devices
Business Transaction Management can work with three kinds of load balancers: F5 devices, other hardware devices, and software load balancers. The work you need to do to help Business Transaction Management model message traffic varies with each case:
-
Business Transaction Management knows the most about the F5 device and requires only a single registration step to derive the information it needs. Business Transaction Management might perform additional discovery passes to complete its picture of an F5's role in message routing.
-
For hardware load-balancers, Business Transaction Management can usually detect and model any routing entry points automatically, based on the information in the HTTP Host headers of the observed messages. However, explicitly registering the device (using the CLI command
registerDeviceor using the management console) allows Business Transaction Management to display information about the device's location and other attributes.If you do not register any device, Business Transaction Management automatically registers a default load balancer and is able to model the flow of messages through this device. In this case, you can still edit the Profile page for the default load balancer to specify a name, the base address, admin UI, and vendor.
If the observed messages do not carry information about their original recipient (the load balancer) in the HTTP Host headers, you will need to register the device and specify routing and target entry points in the same way as you do for software balancers, described next.
-
For load balancers implemented by software that make a separate HTTP connection to the back-end servers (rather than just forwarding HTTP messages), you need to describe the routing relationships in order for Business Transaction Management to model them correctly. To do this you must register the device, add an entry point for the load balancer, and specify target entry points that correspond to the destinations where messages are being routed.
12.6.1.3 Default Load Balancer
The default load balancer is either the first load balancer registered or the one you set to be the default using the setDefaultLoadBalancer command.
The calling service uses a routing entry point to communicate with the load balancer. Business Transaction Management discovers the routing entry point by observing messages. If no load balancer has yet been registered, Business Transaction Management creates a default load balancer and assigns the discovered routing entry port to it. Any newly discovered routing entry points will be modeled as part of the default device unless they belong to a registered F5 load balancer.
You can edit the profile of the default load balancer that was created for you, to provide additional details or, if you prefer, you can unregister it and register your actual load balancer explicitly.
12.6.1.4 Registering a Load Balancer Using the Management Console
You can register a hardware or software load balancer using the CLI command registerDevice or using the console.
After you complete the registration, the device is listed in the summary pane when you select Explorer > Devices in the navigator.
To register a hardware or software load balancer using the console:
-
Select Admin > Register > Device and then choose F5 Networks to register an F5 load balancer, or choose Other to register any other load balancer.
-
In the ensuing dialog, specify values as shown in the following table.
Field Description Vendor Not editable for F5; required for other load balancers. If you chose F5 Networks in Step 1, this field is set to the non-editable value of F5.
If you chose Other, specify the name of the vendor of your load balancer. This field is purely descriptive. You can specify any value (except F5). The specified value is displayed in the Management Console.
Device Name Required. Specify the friendly name for your load balancer. This name is displayed in the Management Console.
Notes Optional. Add any notes to remind you of the nature or purpose of this load balancer. Lifecycle phase Select the lifecycle phase from the drop-down list. Available values are deprecated,development,production,staging, andtest. These are case insensitive.Configuration URL Required and displayed only if you chose F5. Specify the URL of the F5 console in the following format:
https://managementPortIP/iControl/iControlPortal.cgi
Replace managementPortIP with the appropriate host name and port number. This URL normally ends with iControl/IControlPortal.cgi.
Username and Password This value is required and displayed only if you chose F5 Networks. Specify the user name and password of an account on your F5 load balancer. A user role of Guest provides sufficient privileges.
You can encrypt passwords using the
encryptPasswordCLI command, for example:btmcli encryptPassword -password "myPassword"Base Address Required and displayed only if you chose Other. Specify the base address of the URL for your load balancer, for example:
https://myLoadBalancer:443/
Administrator URL Optional and displayed only if you chose Other. Specify the URL of your load balancer's HTML administrative console. A link to this URL is displayed in the Business Transaction Management Management Console to provide easy access to your load balancer's console.
This flag is not needed for F5 load balancers because Business Transaction Management obtains the URL automatically.
-
Click Apply.
-
If needed, assign routing entry points and target entry points as described in the Section 12.6.1.6, "Adding Entry Points to Show Routing Relationships".
12.6.1.5 Modifying Information About a Load Balancer
You can modify information about a device you have already registered or about a default device.
To modify information about a device:
-
Select Explorer > Devices from the navigator.
-
In the summary area, select the device whose attributes you want to specify or edit.
-
Select Modify > Edit Profile for deviceName.
-
Modify the fields of interest (as described when registering the device) in the ensuing dialog.
-
Click Apply.
12.6.1.6 Adding Entry Points to Show Routing Relationships
In most cases, Business Transaction Management automatically detects and models routing relationships by observing message traffic and reading destination information from the message headers. However, if the observed messages do not carry information about their original recipient (the load balancer) in the HTTP Host header, you will need to manually create a routing entry point to the load balancer. You will also need to add target entry points to indicate where the messages are being routed.
If you do not specify routing relationships, Business Transaction Management will not be able to draw contiguous dependency flows. In the case of transactions, you could still connect these disjoint flows by linking related services using manual keys.
To add routing entry points and target entry points:
-
Select Explorer > Devices from the navigator.
-
In the summary area, select the device whose routing relationships you want to clarify.
-
Select Create > Entry Point for deviceName.
-
In the ensuing Create Entry Point tool, specify the following information: --In the Hosted on section, specify the IP address and port number where the load balancer is receiving observation messages (the HTTP port). -- Click the Add Target Entry Point and choose a destination from the drop down list. Each destination refers to a target entry point where the load balancer is routing messages. Do this for each potential destination.Note: There will be more entry points on the drop-down list than the router is using. Some of these might be addresses to which another load balancer is sending messages. (Basically, the drop down list shows every entry point known to the sphere.)
-
Click Apply.
12.6.1.7 Unregistering a Load Balancer
You can only use the management console to unregister a load balancer.
To unregister a load balancer:
-
Select Explorer > Devices from the navigator.
-
In the summary area, select the name of the device you want to unregister.
-
Select Modify > Delete deviceName Registration
-
Confirm deletion action by clicking Delete in the next dialog.
12.6.2 Registering an F5 Network Device
Registering an F5 network device allows Business Transaction Management to read F5 configuration information and to model that device (its entry points and the routing policies applied to them) in the management console. You can only register devices that are running iControl v9.x software.
Before you register the device, select Administration > System Services from the navigator, and check the services listed to make sure that the F5 Intermediary Adapter service is up and enabled.
To register an F5 Network Device
-
Select Admin > Register > Device > F5 Networks.
-
Specify a name for the device. This name will be used to identify the F5 device in the Explorer > Devices view that you can access from the navigator.
-
Add any notes to identify the device or what use you intend to make of it. These notes will appear in the Profile tab for the device after it has been registered with the Sphere.
-
Select the life cycle phase of your deployment from the drop list. Values include Deprecated, Development, Production, Staging, Test, and Unknown. These values are not checked or enforced in any way; they are available only to help you organize your work.
-
Specify the URL for the F5 console as illustrated in the following example
https://ManagementIP/iControl/iControlPortal.cgifor ManagementIP specify the IP address of the management port your BIG-IP Load Balancer is configured to listen on.
-
Enter the user name and password for the administrator's account of the F5 device.
-
CLick Apply.
-
To view device information, select Explorer > Devices in the navigator.
You can also use the CLI command registerDevice to register an F5 network device.
12.6.3 Configuring an F5 Device to Work with Replicated Monitors
Monitoring in Business Transaction Management relies on the communication that takes place between an observer that monitors message traffic through a given service and a monitor that analyzes and stores the data obtained by the observer.
To scale your system and make it fault tolerant, you can associate several replicated monitors (monitor group) with observers. Replicated monitors require a third-party load balancer that can route messages from observers to the monitors. This section explains how you set up an F5 device to load balance messages from an observer to two or more monitors.
In order to understand F5 setup, it is helpful to review the mechanism that allows an observer to communicate with a single monitor; this is illustrated in the following figure:
Description of the illustration single_monitor.gif
As shown in the figure, communication between the observer and the monitor proceeds by means of two paths:
-
The observer queries the monitor for configuration information and receives that information from the monitor's HTTP port. (Although configuration data is mostly flowing from the monitor to the observers, the connection is made by the observer.) This port is specified using the AP_NANO_CONFIG_URL Java system property or using the
AmberPoint:NanoConfigRLWindows key, depending on the platform. The sample URL shown in the figure isMyApSvr:8080/apmonitor/agent/agent. When the observer starts up, it sends a request to this URL to get configuration information, which tells it what it should measure and how often. In this way, the observer can be reconfigured dynamically as your need for different kinds of information changes. -
The observer sends measurement data to the monitor at the socket port specified in the Observer communication policy. By default, this port is 36963.
When you set up communication between your observers and replicated monitors by way of an F5 device, the device must be configured to include these same two (configuration and data) paths for every replicated monitor you add. The next figure shows how the F5 device connects an observer with the replicated monitors.
Description of the illustration replicated_monitors.gif
Creating a scheme like the one above involves configuring the F5 device, setting the Java system property or Windows key, and defining the observer communication policy for the replicated monitors.
When you set up the F5 device, you must use the admin console for that device to do the following:
-
Create an HTTP virtual server to be used by the observer to get configuration information. This is shown at port 5060 above.
Assign a pool to the HTTP virtual server with member port numbers that correspond to the HTTP ports of the monitors to which you are connecting. As illustrated, the pool for the HTTP virtual server includes ports 11080 and 11081.
-
Create a socket virtual server to be used by the observer to send data to the socket ports of the monitors. This is at port 5061 above. Assign a pool to the socket server with member port numbers that correspond to the socket (data) ports of the monitors to which you are connecting. As illustrated, the pool for the socket virtual server includes the ports at 36330 on each host machine.
When you set the AP_NANO_CONFIG_URL Java system property or the AmberPoint:NanoConfigURL Windows key, you must provide a value like the following:
http://10.147.46.152:5060/btmmonitor/agent/agent/
Note the bold portion of the URL: it is the IP address of the F5 device (host) and the virtual sever HTTP port. (Of course, these numbers will be different for your deployment.)
The values you specify for the observer communication policy correspond to the values defined for the F5 device as follows:
| Observer communication policy (Through router to monitor group) | F5 device values |
|---|---|
| Router IP address | The IP address of the F5 device. With reference to the figure, this would be 10.147.46.152. |
| Router port number | The virtual server socket number. With reference to the figure, this would be 5061. |
| Monitor port number | One of the pool member ports. With reference to the figure, this would be 36630.
If, for some reason, the replicated monitors are located on the same machine, the port numbers for each monitor would be different, and you would need a different observer communication policy for each monitor. |
It does not matter whether you define the observer communication policy first and the F5 second. What matters is that the socket ports assigned to the monitors correspond to those defined for the virtual server socket pool in the F5 device.
This section assumes that a certain amount of work has already been done to deploy and register the replicated monitors and to create the monitor group. Consult the Business Transaction Management Installation Guide for information on how to do this, and on how to define the observer communication policy.
12.7 Resolving Discovery Issues
Creating a useful discovery configuration can be an iterative process, particularly in the early stages of using Business Transaction Management. You might find that default settings for enabling probes are turning up too much information, or that changing your deployment or the observer-monitor topology results in redundant or erroneous information. To spare you the need to reinstall the system or to manually remove all observed entities and related artifacts, Business Transaction Management provides the deleteAll command. This command deletes objects already discovered along with related artifacts such as transactions, properties, registered services, devices, and containers.
Use this command judiciously to avoid unwanted loss of data, which includes historical data related to observed objects. The command is most appropriate when you start working with Business Transaction Management and are fine tuning your discovery scheme. It should never be used in a production environment. See Section 10.11, "deleteAll" for more information.
After you have fine-tuned your discovery configuration, and worked with Business Transaction Management for a while, problems might still arise. The simplest reasons for not being able to observe a service are the following:
-
Traffic has not run long enough or diversely enough for Business Transaction Management to see a service. The solution here is to run more traffic and attempt to traverse all possible branches.
-
The probe responsible for observing the service has not been activated. To check, select Administration > Observers from the Navigator and make sure that the probe appropriate for the type of service you are trying to discover is active. If it is not, edit the observer communication policy to activate it. By default all probes are activated except for the JAVA probe. To enable it, you must configure it with the names of the specific Java classes you want to observe.
More complicated issues arise in determining whether services are replicates. In the process of discovering and representing services and endpoints appropriately, Business Transaction Management needs to figure out whether a copy of a service represents a valid replicate and, conversely, whether services whose WSDL definitions are not identical actually implement the same interface. It makes these decisions by comparing the WSDLs it discovers and by following the criteria defined by the system service versioning policy. In addition, there might be cases where you might want to separate or merge different versions of a service because of ownership or accounting issues. Business Transaction Management provides commands and tools that you can use to resolve replication and duplication problems, and to resolve cases where it cannot guess your needs or intent.
This section summarizes some of these issues and introduces the commands you use to deal with them. You can also resolve some discovery problems by using the Disambiguate endpoints tool, which you access from the management console. This section includes the following topics:
12.7.1 Modifying the Service Versioning Policy
By default, the service versioning policy sets guidelines for how Business Transaction Management should deal with new or changed WSDLs:
-
It treats two endpoints as part of the same service version if their qualified service names, port type names, and port definitions match.
-
When it discovers a WSDL defining a distinct version of an existing service, it creates a new service version based on the host and port of the endpoint location being registered.
-
When it re-reads a WSDL, if the qualified name of a service changes, it replaces the previous endpoints, consequently losing all measurements.
It might be possible to forestall discovery problems by editing the default service versioning policy to make these criteria more or less restrictive. If modifying the policy does not suffice, there are a number of CLI commands as well as a tool you can access from the console that you can use to correct discovery results. For additional
To edit the default service versioning policy
-
In the Navigator, select Administration > System Policies.
-
Double click the Service Versioning Policy item in the summary area to display the current versioning policy in the detail area.
-
Select Edit Definition for Service Versioning Policy from the Modify menu.
-
Make the desired changes and click Apply.
12.7.2 Resolving Replication Issues
If you deploy a service in multiple containers, Business Transaction Management is able to understand that the same service is referenced by all the endpoints and that all endpoints share one interface. Consequently, it is able to aggregate statistics for the replicates at the service level and it allows you to define message properties on operations shared by all endpoints in the service.
For two endpoints to be treated as replicates of the same service, the following is required:
-
The WSDLs for the two services have the same qualified name (target name space and a simple name)
-
The endpoints implement the same interface
-
The service type of the endpoints is the same
To take an example, a user web service, an OSB business service, and the OSB Proxy service that have the same name would show up as three separate services because their service types are different.
There are cases however where this information is not sufficient to make a determination, and you might have to teach the system whether two endpoints are the same or different. In each of the following cases, you will be alerted to take some action:
-
In a development environment, multiple versions of the same service might be created that are incompatible. If Business Transaction Management sees a version that looks different from what it has seen before, it will treat it as a different version. If these differences are not important, you can run the
mergeServicescommand to merge two versions into one. -
Due to a rolling upgrade, parallel versions might need to coexist temporarily until all servers are upgraded. In this case, Business Transaction Management will not generate a new service version, but it will generate an alert and allow you to move upgraded endpoints to a new service version if needed. This might be the case if existing policies are not compatible with the upgraded version. You can use the
moveEndpointscommand to move upgraded endpoints to a new service version. By the time the upgrade is done, all endpoints will wind up in the new service version. -
Due to a failed or incomplete upgrade, a version skew arises that was not intended but results in two different versions of the services. You can choose to merge the two versions or separate them.
-
When a side-by-side upgrade results in the deployment of a new version of the application with an updated interface at new endpoint locations, Business Transaction Management will generate a new service version by default. You can accept this or merge the new version with the older version to retain the service history.
-
Two sets of WSDLs that identify the same service would normally be treated as replicates, but because different instances of the service are used by different departments in different ways, you might need to divide the endpoints between service versions manually (
moveEndpoints). In this case Business Transaction Management will generate an alert if new replicated endpoints are discovered, to allow you to determine which service version they belong to. -
There are cases where deploying an updated version of a service causes Business Transaction Management to delete the older version. If you wish to keep the measurements associated with the older version, you can use the
moveMeasurementscommand to move the measurements from the older to the newer version.
12.7.3 Resolving Duplication Issues
Business Transaction Management attempts to resolve issues that arise as the result of changes to a machine name or to a container's listening address, or the use of multiple aliases for the same host name, without assistance from you. If the system guesses incorrectly how to handle such conditions, the most common symptom is the discovery of duplicate services or endpoints where in reality only one exists. You can use the commands listed in the following table to help the system avoid or resolve duplication problems.
The parts to be used as WSDL, service, or endpoint identifiers are as follows (with respect to the following example):
http://jbujes-pc.edge.com:8080/Bookmart/Credit/CreditService?wsdl
The base address is http://jbujes-pc.edge.com
The node is jbujes-pc.edge.com
The path is Bookmart/Credit/CreditService?wsdl
Generally, using the removeDuplicateEndpoint (or addBaseAddressAlias) command accomplishes everything you need to do. That is, the duplicate item is removed and the appropriate alias is defined so that duplication does not recur. But note that otherwise, all alias corrections made using the commands listed below are forward looking: they do not delete duplicates that have already been mistakenly created.
Another apparent duplication might result when two endpoints share the same URL and are given the same port name in the WSDL that describes them. By default the port name is used as the friendly name. Although the system does not require friendly names to be unique, you will have to specify the endpoint URL (and possibly other characteristics) instead of its friendly name in any command that requires you to reference a unique endpoint. You can use the renameEndpoint command (or just pick the desired endpoint and modify its friendly name in its Profile tab) to distinguish the endpoints from one another.
12.7.4 Using the Console to Disambiguate Endpoints
You can use the Disambiguate Endpoints tool (from the console) to do the following:
-
Merge services: merge the source service into the specified target service
-
Move an endpoint: move the source endpoint to an existing or to a new service
-
Remove a duplicate endpoint: remove the source endpoint that is a duplicate of a target endpoint
To use the Disambiguate Endpoints tool:
-
Select the source service or endpoint and choose Admin > Disambiguate Endpoints. The Disambiguate Endpoints tool is displayed in the console. The tool consists of three main areas: an area that compares the source and target, an area that lists available actions, and an area that allows you to preview the effect of your actions before you choose to execute them.
The source drop list includes all possible sources, based on an internal evaluation of duplication in the system. The service or endpoint shown at the top is the one you selected when you opened the tool. You can choose another if you like.
The target drop list includes all possible targets, given the items you have chosen for source.
Below the drop lists is shown basic information for the selected source and target. Icons (equal/does not equal) indicate whether elements of the source and target are the same. To view differences in the WSDL's listed, click on the link to display WSDL contents.
-
Use the drop lists to select the source and target.
If you want to create a new service as the target service, click the New Service check box and specify the name and version of the service. You might do this if you want to move the source endpoint to a service that does not yet exist.
-
The action part of the Disambiguate Endpoints tool shows you the possible actions you can take based on the selected source and target.
Click the enabled action. If the desired action is not enabled, you might have to change your target or select Create New Service. For detailed information about the effect of each of these actions, please look up its command line equivalent:
mergeServices,removeDuplicateEndpoint, ormoveEndpoints. The use cases that require these actions are described above -
After you select an action, the effects of your action are shown in the Preview area.If the results shown are what you intended, click the OK button to execute the chosen action.
12.8 Miscellaneous Administration Topics
This section provides miscellaneous information to help you administer Business Transaction Management and includes the following subsections:
12.8.1 Unregistering a Service
Use the following procedure in the Management Console to unregister a service. You can also unregister a service using the unregister CLI command. For information on how to use this CLI command, refer to Chapter 10, "Commands and Scripts."
-
Select the service.
-
Choose Modify > Delete My_Service Registration, where My_Service is the name of your service.
The Delete Service Registration tool opens.
-
Click Delete.
12.8.2 Checking the Status of System Services
The following list describes the ways you can check the status of your system services. The list orders these tasks from high-level to low-level (top to bottom). Each listed task directs you to where you can perform the monitoring and provides a link to more detailed information:
To check:
-
Summary of system services and system alerts.
Navigate to Dashboards > Operational Health Summary
-
Detailed view of all system alerts
Navigate to Alerts in the Last Hour > System Alerts
-
Current status of a specific system service
Navigate to the specific system service and display the Status tab.
12.8.2.1 System Alerts
System alerts provide information about the health of the Business Transaction Management infrastructure. Business Transaction Management issues system alerts in situations such as the occurrence a fatal error, a container going down, the rejection of a policy, deletion of an attribute that is in use, and so forth.
12.8.2.2 Status Tab
Use the Status tab to check the status of the selected Business Transaction Management system service.
The table at the top of the Status tab provides the following information about the service:
-
Url: The location where Business Transaction Management expects to find the service uuid.
-
Id: The uuid assigned to the service.
-
Status: The service status can have one of the following values:
-
RUNNING - The system service is running and working correctly. For a system service to be RUNNING, all of its associated resources must be accessible and running.
-
DEGRADED - A resource may be unreachable, but that resource is not mandatory for the system service to operate. It is a good idea to investigate unreachable resources for a degraded service. A re-sync of the system may fix services that are in a degraded state. Degraded services do not trigger alerts to the system log.
-
FAULTED - A required resource cannot be reached. Typically, a faulted value appears when a database required by the service is down. When a service reaches the faulted state, it is considered unusable. Access is subsequently shut down to the service to prevent errors from cascading throughout the system. A faulted service triggers an alert to the system log. This alert should provide information about how to address the root cause of the problem. A re-sync of the system will not fix services that are in a faulted state. Instead, you need to first address the root cause of the problem, and then restart the Business Transaction Management deployment that contains the faulted service.
-
SETUP_REQUIRED - A required resource or piece of the system service has not been upgraded. For example, the transaction management component is not connected to a database.
-
INITIALIZING - A service is in this transient state at the very beginning of its lifetime.
-
Below the Service Status table is the Resources Status table, which provides status information about other components in the Business Transaction Management environment that are related to the selected service. For example, several system services use databases. The resources section will confirm whether the database is running and working correctly.
The Resources Status table provides the following types of information:
-
Status: The resource status can have one of the following values:
-
OK - The resource is running and working correctly.
-
FAULTED - A required resource cannot be reached.
-
SETUP_REQUIRED - A required resource has not been upgraded.
-
-
Last Access: Time-stamp of when the service last attempted to access the resource.
-
Last Successful Access: Time-stamp of when the service last accessed the resource. When diagnosing problems using the system log, the time-stamp of the Last Successful Access for a resource is a good starting point.
Another important piece of information included in the Resources Status table is the URL of the sphere service with which the selected system service is associated.
Note:
Resource URLs are displayed either with a dash "-", or with parentheses "()". URLs displayed with a dash represent a resource that can exist only once within an installation, such as the sphere service, whereas URLs displayed with parentheses represent a resource of which there can exist multiple instances, such as a monitor.12.8.3 Resynchronizing the System and Checking Aliveness
The sphere is synchronized about every fifteen minutes. You can manually resynchronize the sphere by choosing Admin > Resync System. Resynchronizing ensures that the sphere reflects the current state of your system. Resync System also performs an aliveness check at the same time.
By default, “aliveness” is checked every two minutes to determine whether services are up or down. You can change the time interval for the automatic aliveness check, as described below. (The CLI equivalent for checking aliveness is the configureAlivenessCheck command.
12.8.3.1 Changing the Time Interval for the Automatic "Aliveness" Check
To change the time interval for the automatic aliveness check:
-
In the Navigator, choose Administration > System Services.
-
Select AP_Sphere_Service and then choose Admin >Edit Setup Data for AP_Sphere_Service.
-
Click the Edit XML link.
-
Find the <AlivenessInterval> element and change its value to the appropriate number of seconds. The default value is 120, or two minutes.
-
Click Apply.
12.8.4 Start and Stop Monitoring of Endpoints
Business Transaction Management automatically discovers and monitors components, depending on how you have set up the Observer Communication policy. Once a component has been discovered, you can explicitly start and stop the monitoring of its endpoints.
When you start or stop monitoring an endpoint, both the monitor and the observer configurations are updated. Once monitoring stops, no performance measurements are recorded, no messages are logged, and no transactions are traced.
To stop monitoring of an endpoint
-
Select the endpoint (or the service).
-
Choose Admin > Stop Monitoring.
The Stop Monitoring tool then opens and lets you select additional endpoints to stop monitoring.
To start monitoring of an endpoint
-
Select the endpoint (or the service).
-
Choose Admin > Start Monitoring.
The Start Monitoring tool then opens and lets you select additional endpoints to start monitoring.
12.8.5 Working with Containers
Note:
Business Transaction Management can use dependency analysis to discover service endpoints running in unmonitored containers if those endpoints interact with services in monitored containers. You can use theregisterExternalContainer command to define containers for such endpoints.You can explore the registered containers by selecting Explorer > Containers in the Navigator. The summary area then lists all registered containers.
Select a container in the main area to display information about the container on the Profile tab. Open the container's administration console by clicking the URL in the Administration UI Console field. You can edit the container's profile by choosing Modify > Edit Profile for the_selected_container.
To view the services running in a container, select the container and display the Services tab. You can also drill down into the service endpoints running in a container by expanding the container in the main area.
12.8.5.1 Monitoring Containers
The following list describes the ways you can monitor the health of your containers. The list orders these monitoring tasks from high-level to low-level (top to bottom). Each listed task directs you to where you can perform the monitoring and provides a link to more detailed information:
To check:
-
Overall current health of all containers.
Navigate to Dashboards > Operational Health Summary
-
Recent history of all container-related problems (in addition to other system-related problems)
Navigate to Alerts in the Last Hour > System Alerts
-
Current health of a specific container
Navigate to specific container > the Up/Down Status icon in the summary area
12.8.5.2 Unregistering Containers
There might be times when you want to unregister a container (in other words, remove it from the sphere and the Management Console). For example, if any of the following statements are true, you can, and probably, should unregister the container:
-
You have registered the container with a different sphere
This situation results if you reconfigure an observer to send observations to a monitor that is registered in a different sphere. In this case, the container in which the observer is running is automatically registered with the other sphere as soon as traffic is observed.
-
You have uninstalled the observer from the container.
-
You have uninstalled or physically removed the container from your system.
If none of these statements are true, and you unregister a container, the container will be automatically reregistered as soon as message traffic is observed to or from the container.
-
Select the container you want to unregister.
-
Choose Modify > Delete selected_container Registration.
The Delete Registration tool opens.
-
Click Delete.
12.8.6 Working with System Policies
System policies are normally used by administrators. Most system policies are not editable. The ones that you can modify allow you do define custom attributes, to configure the connection to the message logging database, to configure discovery, to specify the interval at which measurements are aggregated and collected, and to tell the system what action to take in response to new or changed WSDLs.
This section describes available system policies and explains how you access them, how you view their definition, how you define them, and how you modify them.
12.8.6.1 Accessing System Policies
You can view system policies by selecting Administration > System Policies in the navigator. The following table lists and describes these policies.
| Name | Description |
|---|---|
| Baseline storage | Supports the derivation and storage of baseline values for endpoints, services, and transactions. |
| Callout Measurement | Supports the measurement and display of average response time, throughput, and fault count for a given link. You cannot edit this policy. |
| Condition measurement | Provides condition alert count and condition alert count rate measurements for a given transaction. You cannot edit this policy. |
| Core Measurement | Supports the calculation of the following counts for a given endpoint and service: average response time, maximum response time, throughput, fault count, traffic, fault percentage, throughput rate, and fault rate. You cannot edit this policy. |
| Data Model Attribute Definitions | Extends custom attributes for services, endpoints, operations, containers, agents, business objects, transactions, and type domains. |
| Default Message Logging Database | Configures the connection to a database used for logging messages. For more information, see Section 12.2.2, "Setting up the Message Log Database." |
| Default Observer Communication Policy | Determines which genres are to be observed and monitored, and specifies the monitor port number. |
| Event Generation Policy | Configures the generation of events based on the occurrence of event notifications. |
| Event Notification Measurement Policy | Used by the notifier service. You can only re-define criteria for this policy. |
| Measurement Interval Policy | Specifies the interval at which measurements are aggregated and collected throughout Business Transaction Management. |
| Service Versioning Policy | Directs the system in what action to take in response to new or changed WSDLs. For more information, see Section 12.7, "Resolving Discovery Issues." |
| Simple Transaction Measurement Policy | Supports measurement of average response time, maximum response time, completed transaction count, started transaction count, completed transaction rate, started transaction rate for a given transaction.
Business Transaction Management will use either this policy or the Transaction Measurement policy to measure transaction performance, depending on how the transaction is defined and what features are used. You cannot edit this policy. |
| System generated log policy for transaction | Specifies the location for storing transaction messages, the limits on time store, the rotation interval, and defines the scope of logging.
You cannot edit this policy. |
| Transaction measurement | Supports measurement of average response time, maximum response time, completed transaction count, started transaction count, completed transaction rate, started transaction rate for a given transaction.
Business Transaction Management will use either this policy or the Simple Transaction Measurement policy to measure transaction performance, depending on how the transaction is defined and what features are used. You cannot edit this policy. |
| Uptime Measurement | Supports the uptime measurement for a given endpoint and service. You cannot edit this policy. |
| Monitor Group Policy | Creates and configures a monitor agent group. |
12.8.6.2 Viewing a System Policy Definition
To view a system policy definition:
-
Select Administration > System Policies.
-
Double click the policy of interest in the main pane.
-
Click the Profile tab.
12.8.6.3 Defining and Modifying System Policies
To define a system policy:
-
Select Create System Policy from the Admin menu.
-
Choose one of the following: Message Log Database, Monitor Agent Group, or Observer Communication.
-
Specify the information required and click Apply.
When you define a policy, you must supply identifying information: the policy's name and whether it is enabled. You must also supply settings that determine what the policy will accomplish, and criteria that determine to which endpoints (targets) the policy is applied.
Some system policies can only be modified and must be accessed from Administration > System Policies in the navigator.
To modify a system policy
-
Select Administration > System Policies.
-
Select the policy of interest in the main area.
-
Select Modify > Edit definition for policy. If the menu item is not available, the policy cannot be modified.