8 Configuring and Viewing Alerts
Business Transaction Management alerts you when defined performance standards are violated or when conditions you specify are satisfied. This chapter explains how you define and work with service level agreements and conditions. These are powerful tools that enable you to evaluate performance at critical junctures.
This chapter contains the following sections:
8.1 About Alerts
In addition to ongoing monitoring of the performance of services, endpoints, and transactions, you can have Business Transaction Management alert you when specific events occur.
Business Transaction Management issues several types of alerts:
-
Service level agreement alerts (also called violation alerts and SLA alerts) are issued when a deviation occurs from the standards of performance you have defined for an endpoint, service, or transaction. These standards might be based on fixed values or historically determined baselines.
You define standards of performance using one or more service level agreement policies that you then apply to an endpoint, service operation, or transaction.
SLA violation alerts can be queried, filtered, and viewed on the Alerts tab of the related service, endpoint, operation, or transaction instance. SLA alerts in the last hour are displayed using the Alerts in the Last Hour > SLA Alerts view (from the Navigator). Alerts are also displayed on the operational summary dashboard.
In this case, when performance deviates from the Warning Value threshold set in an SLA policy, a warning alert is issued, and when it deviates from the Failure Value threshold set in an SLA policy, a failure alert is issued. The Warning Value is optional.
-
Condition alerts are issued when a condition is satisfied.
A condition is created on a transaction and is based on evaluating messages and message content per transaction instance.
Condition alerts can be queried, filtered, and viewed on the Alerts tab of the related transaction instance. Alerts issued in the last 24 hours can also be filtered and viewed using the Alerts in the Last Hour > Condition Alerts view (from the Navigator). The dashboards include various condition alert counts.
You might define conditions to enable fault monitoring on transactions, to test for specific property values, or to report a missing message.
-
System alerts provide information about the health of the monitoring infrastructure. Business Transaction Management issues system alerts in situations such as the occurrence of a fatal error, a container going down, the rejection of a policy, deletion of an attribute that is in use, and so forth.
To check for system alerts, do one of the following:
-
Select Alerts in the Last Hour > System Alerts in the Navigator.
-
Select Administration > System Policies in the Navigator and then click the Alerts tab.
-
8.2 About Service-Level Agreements
A service level agreement (SLA) policy lets you set standards of performance for your business applications and then monitor deviations from those standards. When deviations occur, an alert is issued and displayed in the Management Console.
Using SLA's you can get information about events like the following:
-
When the overall fault rate for a transaction is above 1%
-
When the response time for a service is 15% below its historic norm
-
When the maximum response time for the consumer of a transaction is greater than one second
You can apply SLA policies to many different objects: transactions, services, endpoints, individual operations, and consumers. You can also apply one SLA policy to any number of objects in your system, for example, to all transactions, or to any subset of the objects mentioned. Not all SLA policies are appropriate to all objects.
When you define an SLA you must specify the following information
-
Its type: fixed, baseline, or usage
-
What objectives the performance of a given object must meet
-
The period during which the SLA is enforced
-
The criteria to be used in selecting the objects to which the SLA is applied
If you need to shut down an endpoint without affecting the state of your SLAs, you can schedule a downtime for the endpoint before shutting it down. Instrument measurements continue to be collected and displayed during scheduled downtimes, but these measurements are not used for SLA evaluations.
8.2.1 Performance Objectives
When you create an SLA policy, you specify some number of performance objectives, where each objective is based on one of the monitoring instruments. For example, you might specify a performance objective based on the average response time instrument. You also specify a valid range, what would trigger a warning value, and what would trigger a failure value. The Warning Value is optional.
8.2.2 Evaluation Period
Business Transaction Management evaluates the performance of your system against your SLAs on a periodic basis. When you create an SLA, you specify:
-
length of the time period evaluated
-
whether the period is fixed or rolling
-
when the evaluation occurs
Fixed periods begin and end at defined times and the evaluation occurs only once, at the end of the period. You set the evaluation timing by specifying an exact time for the evaluation to occur, which is also the end of the period. For example, you can set the fixed period to be one month, and start the evaluation on the second day of the month at noon.
Consecutive fixed periods do not overlap.
Rolling periods begin and end relative to the evaluation timing. You set the evaluation timing by specifying an evaluation frequency. At each evaluation, the end of the period is the time of evaluation, and the beginning is the length-of-the-period earlier. For example, you can define a rolling ten minute period with evaluation occurring every two minutes.
Consecutive rolling periods do overlap.
8.3 Defining Service Level Agreements
You define a service level agreement (SLA) by creating an SLA policy. Depending on the type of SLA policy you choose, you might have to perform a set of tasks before applying the policy. The three types include the following:
-
Fixed Value - This is the most basic SLA. It evaluates performance across all transaction, service, endpoint, and/or operation usage. It cannot be used for consumer usage. It does not take historical performance into account.
-
Baseline - This SLA lets you specify performance objectives relative to historical performance measurements. It evaluates performance across all transaction, service, endpoint, and/or operation usage. It cannot be used for consumer usage.
-
Usage - This SLA evaluates performance on a per-consumer basis. Alerts are issued only for consumers for whom performance deviates from the performance objectives, and you can monitor performance for individual consumers. This type of SLA can be used with transactions.
8.3.1 Defining a Fixed-Value SLA
-
Decide whether you want to create an SLA for a service or for a transaction:
To create an SLA for services, choose Create > SLAPolicy > Service SLA, and then choose the fixed value type from the submenu.
To create an SLA for transactions, choose Create > SLAPolicy > Transaction SLA, and then choose the fixed value type from the submenu.
The SLA policy tool opens.
-
Specify the evaluation period.
-
Select the objectives: click Choose Instruments, and click the checkbox for each instrument you want to use for setting up performance objectives, and click OK.
-
Click Choose Operations, pick the operations on which you would like to set up performance objectives, and click OK.
The SLA policy tool should now display one performance objective for each instrument that you picked.
(In order to choose operations, you must open the tool by first selecting an object and then choosing Create > SLAPolicy for selected_object.)
-
Specify warning and failure values for your performance objectives.
If the objective is for an operation, the values pertain to only that operation. If the objective is for a service or endpoint, the values pertain to the total or average for all operations on the service or endpoint (total if the instrument is a counter, such as Traffic; average if the instrument is an averaging instrument, such as Average Response Time).
-
Use the Criteria section to choose the objects to which the policy should apply.
-
Preview the objects in the Criteria section.
-
Click Apply.
8.3.2 Defining a Baseline SLA
Before setting your baselines, you can delete previously set baselines by running retrieveObjectData with the -delete option set.
Before you can define a baseline SLA, you must do the following to set the baseline:
-
Run traffic and identify a time period that provides a good selection of baseline data.
-
Export the baseline data: Run the
retrieveObjectDataCLI command to retrieve the performance history that you want to use as a baseline for your SLA. -
Using the output file of the
retrieveObjectDataCLI command as an input file, run thesetBaseLinesCLI command to set the baselines for your SLA.
To define a baseline SLA
-
Decide whether you want to create an SLA for a service or for a transaction:
To create an SLA for transactions, choose Create > SLAPolicy > Transaction SLA, and then choose the baseline type from the submenu.
To create an SLA for services, choose Create > SLAPolicy > Service SLA, and then choose the baseline type from the submenu.
The SLA policy tool opens.
-
Specify the evaluation period.
-
Select the objectives: click Choose Instruments, and click the checkbox for each instrument you want to use for setting up performance objectives, and click OK
The SLA policy tool should now display one performance objective for each instrument that you picked.
-
Specify warning and failure values for your performance objectives.
If the objective is for an operation, the values pertain to only that operation. If the objective is for a service or endpoint, the values pertain to the total or average for all operations on the service or endpoint (total if the instrument is a counter, such as Traffic; average if the instrument is an averaging instrument, such as Average Response Time).
-
Use the Criteria section to choose the objects to which the policy should apply.
-
Preview the objects in the Criteria section.
-
Click Apply.
8.3.3 Defining a Usage SLA
Before you can define a usage SLA you must map messages to consumers and enable segmentation for the given transaction.
-
To create a usage SLA for transactions, choose Create > SLAPolicy > Transaction SLA, and then choose the usage type from the submenu.
The SLA policy tool opens.
-
Specify which consumers the policy should apply to:
-
By default, the policy applies to all consumers. To restrict the policy to a subset of consumers, click all consumers in the system and choose a subset of consumers.
-
Then click the Filter button that appears and use the Set Filters dialog box to specify your subset of consumers.
-
-
Specify the evaluation period.
-
Select the objectives: click Choose Instruments, and click the checkbox for each instrument you want to use for setting up performance objectives, and click OK.
The SLA policy tool should now display one performance objective for each instrument that you picked.
-
Click Choose Operations, pick the operations on which you would like to set up performance objectives, and click OK.
In order to choose operations, you must open the tool by first selecting an object and then choosing Create > SLAPolicy for selected_object.
If the objective is for an operation, the values pertain to only that operation. If the objective is for a service or endpoint, the values pertain to the total or average for all operations on the service or endpoint (total if the instrument is a counter, such as Traffic; average if the instrument is an averaging instrument, such as Average Response Time).
-
Specify warning and failure values for your performance objectives.
-
Use the Criteria section to choose the objects to which the policy should apply.
-
Preview the objects in the Criteria section.
-
Click Apply.
8.4 Working with SLA Policies
After you define an SLA policy, you might need to view it, modify it, disable it, duplicate it, or delete it. This section explains how you accomplish these tasks.
To View an SLA Policy Definition
-
Select Explorer > SLA Policies tab.
-
Select the Profile tab.
To View which Policies Are Applied to an Endpoint, Service, or Transaction
-
Select the object of interest in the main area.
-
Select the Policies tab.
To View All the Objects to which a Policy Is Applied
-
Select the policy of interest in the SLA Policies view.
-
Select the Targets tab.
To View the Status of a Policy
The status of a policy is either displayed in the upper right hand corner of its Profile tab, or it is displayed in the Policy Status column of the Policies tab if you select to view an individual target. Status values include applied, pending, rejected, disabled, or deleted.
-
Select the policy of interest in the main area.
-
Select Modify > Edit definition for <policy>.
-
Make the needed changes and click Apply.
You can disable policies in one of two ways; the second method is an abbreviated version of the first.
-
Modify the policy definition to disable the policy: Select Modify > Edit Definition.Uncheck the Enabled check box in the policy definition (and then click Apply).
-
Select the policy in the main pane and select Modify > Disable policyName.
Duplicating policies might be useful in those cases where you have defined criteria or settings that are complex and do not want to recreate the work to define a policy that is very similar to the one you have already defined.
-
Select the policy in the main pane.
-
Choose Duplicate Policy from the Modify menu.
-
By default the policy duplicate is given the name of the original with a _1 extension. You can provide your own name if you like.
-
Modify any settings or criteria.
To delete a policy, select the policy in the main pane and choose Delete <Policy> from the Modify menu.
8.5 Monitoring SLA compliance
This section lists the ways you can monitor compliance of SLAs. Monitoring tasks are ordered from high-level to low-level (top to bottom). Navigation directions are given for each task.
To monitor:
-
Overall current SLA compliance
Navigate to Dashboards > Operational Health Summary
-
Recent history of all SLA violation alerts. By default, data for the last hour is shown, but you can use the filter to see a longer period.
Navigate to Alerts in the Last Hour > SLA Alerts.
-
Overall current SLA compliance for a specific object (for example, a transaction named
PlaceOrder)Navigate to object type > the Compliance Status icon for the specific object in the main area.
For example, select Transactions in the Navigator and look at the Compliance Status icon for a transaction in the main area. The green circles indicate that the object is currently in compliance.
-
Detailed current SLA compliance for a specific object (for example, a transaction named
PlaceOrder)Navigate to specific object > SLA Compliance tab.
For example, select Transactions in the Navigator, select the transaction of interest in the main area, and click the SLA Compliance tab.
-
Recent history of SLA violation alerts for a specific object
Navigate to specific object > Alerts tab.
You can also use the Analysis tab for a particular object and look at the Violation Alerts panel to see violations triggered during a particular period.
8.6 SLA Compliance Tab
The SLA Compliance tab displays the current state of SLA compliance for the selected object, either a transaction, service, endpoint, operation, or consumer. Because some types of information are relevant to only certain types of objects, the layout of the Compliance tab can vary from object to object.
The SLA Compliance tab has two subtabs, Threshold Compliance and Baselines.
-
The Threshold Compliance subtab provides real-time monitoring of the selected object.
-
The Baselines subtab displays historical baseline values for the object that you can use as a reference point. Data is shown only if you have defined baselines for the selected object. (For more information, see Section 8.3.2, "Defining a Baseline SLA.")
There are no baselines for consumers. The information that is displayed on the Threshold Compliance subtab for other object types is displayed directly on the SLA Compliance tab for consumers. This information is described below.
The Threshold Compliance subtab uses a grid view. Each row represents one performance objective.
The columns provide various types of static information that identify and define the objectives. Also provided are two dynamic columns with real-time monitoring values. These are the Value and the Current Status columns.
The Current Status column can have three possible values:
-
A green circle indicates that the object is in SLA compliance.
-
A yellow triangle indicates that the warning threshold for the objective is currently in violation.
-
A red diamond indicates that the failure threshold for the objective is currently in violation.
The Value column displays the current value of the instrument on which the objective is based
Click the magnifying glass next to a value to pop up a chart showing the instrument's recent history, for example:
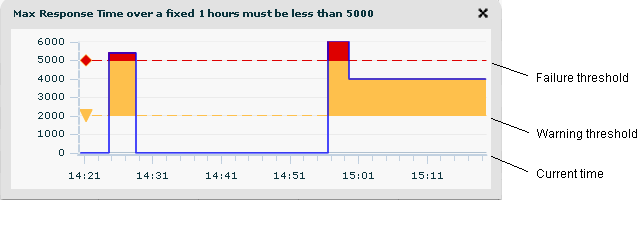
Description of the illustration pop-up_chart_with_callouts.gif
The chart displays a time period equal to the SLA's evaluation period. The right-hand edge is the current time. In this example, values above the yellow line have crossed the warning threshold. Those above the red line have crossed the failure threshold. (If you set up an objective whose value must remain above a specified threshold, then colored warning and failures areas are displayed below the threshold lines.)
Objectives are listed per consumer only if the objective is part of a usage SLA. For objectives that are not part of a usage SLA, the Consumer column is empty.
8.7 Scheduling Service or Endpoint Downtime
If you need to shut down a service without affecting the state of your SLAs, you should schedule a downtime for the service before shutting it down. Instrument measurements continue to be collected and displayed during scheduled downtimes, but these measurements are not used for SLA evaluations.
In order to schedule downtime of a service, you must first create a downtime schedule and then add the schedule to each of the service's endpoints.
This section also explains how to view a schedule, how to remove a schedule from and endpoint, and how to delete a downtime schedule from all endpoints.
-
Choose Create > Schedule to open the Create Schedule tool.
-
Give your schedule a descriptive name.
-
Set the Schedule Type to Custom.
-
Click the first drop list and choose the recurrence frequency for the downtime. For example, the following schedule chooses a weekly downtime, specifies the day, the starting time, the duration of the down period, and the starting date.
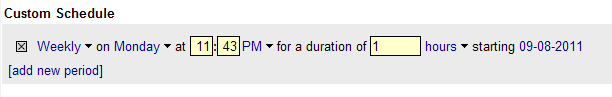
Description of the illustration down_schedule.gif
The pick a day of month options let you schedule by a numeric day of the month, for example, on the 1st day of each month.
The pick a day of week options let you schedule by the name of a day, for example, on the 1st Monday of each month.
-
Use the remaining fields and drop lists to specify the time the downtime begins, its duration, and the date of its first occurrence.
-
To schedule additional downtimes to the schedule, click add new period.
-
Click Apply.
To Add a Downtime Schedule to an Endpoint
-
Select the endpoint.
-
Choose Modify > Set Endpoint Downtime Schedule.
The Set Endpoint Downtime Schedule tool opens.
-
Choose your downtime schedule from the Choose schedule drop-list.
-
Click Apply.
To View Scheduled Downtimes for an Endpoint
-
Select the endpoint
-
Open the Downtimes tab.
The name of the schedule is shown, followed by a list of all events specified for that schedule.
-
Select Explorer > Schedules from the Navigator.
-
Currently defined schedules are listed in the main pane.
-
The Profile tab shows the definition of any schedule selected in the main pane.
To Remove a Downtime Schedule from one Endpoint
-
Select the endpoint.
-
Choose Modify > Set Endpoint Downtime Schedule.
The Set Endpoint Downtime Schedule tool opens.
-
Choose No Downtimes from the Choose schedule drop-list.
-
Click Apply.
To Delete a Downtime Schedule from All Endpoints
-
In the Navigator, select Schedules.
-
In the summary area, select the schedule you want to delete.
-
Choose Modify > Delete schedule_name.
-
Click Delete.
8.8 About Conditions
You can associate one or more conditions with a transaction. A condition is an expression that Business Transaction Management evaluates against a transaction instance. You might use conditions to have Business Transaction Management let you know about the following kinds of events:
-
An order larger than $10,000 is processed.
-
A customer's fault rate is greater than 1%.
-
A transaction instance has exceeded its expected completion time.
You can define three types of conditions for a transaction:
-
Content-based conditions, which issue an alert when the criteria you specify is met. The criteria might specify a property value and/or a fault for a particular operation.
-
Missing message conditions, which issue an alert if the message you specify is not seen by the system in the specified time period.
-
Fault monitoring conditions, which issue an alert when a fault occurs on any operation in a transaction. These type of conditions are the equivalent of defining a content-based condition for any fault on any operation in your transaction. Fault monitoring conditions are disabled by default.
When a condition evaluates to true, Business Transaction Management does the following:
-
Creates a condition alert based on the severity specified in the condition definition
-
Tracks the number of occurrences of the condition
-
Assembles and logs the instance of the transaction that evaluated to 'true'.
-
Keeps the logged transaction instance for the length of time specified for the transaction's "Retain archived condition instances" value in the Storage Settings tab. By default, this is 30 days.
Conditions are evaluated on a per-instance basis; therefore, instance logging must be enabled. If you define a condition for a transaction and you have not enabled instance logging, Business Transaction Management automatically turns it on for that transaction.
When you define a condition, you also assign a severity level to the alert that will be issued when the condition evaluates to true. Severity levels include info, warning, and failure.
Section 8.9, "Working with Conditions" explains how you define conditions, view condition information, modify a condition, and delete a condition.
8.8.1 Defining and Evaluating Conditions
You must observe the following limitations when defining content-based conditions.
-
Condition definitions can include multiple clauses, but all clauses must reference the same message (
operation.request,operation.replyoroperation.fault). -
A content-based condition can test for a property value, a fault value, or both. If both, the property must be defined on the fault phase of the operation.
-
Only message elements that are referenced by means of properties can be used in a condition definition, with the exception of fault codes.
The system evaluates a content-based condition when the message for which it is defined is seen. If the condition evaluates to true, Business Transaction Management will correlate back to the transaction's start message to make sure that the instance that has satisfied the condition has been called from within the transaction. If so, the resulting instance is assembled and saved for the time duration specified on the transaction's storage settings Retain archived condition instances.
The system begins to evaluate a missing-message condition when it sees the starting message for the transaction. It then looks for the message for the period specified in the condition definition. If it does not see the message in that period, the missing message condition evaluates to true.
Once you have defined a condition on a transaction, it is listed in the transaction's Conditions tab.
8.8.2 Interpreting Condition Alerts
Alerts are commonly thought to signal that something bad has happened, for example, that an error has occurred. However Business Transaction Management uses condition alerts to signal the occurrence of any kind of message pattern. So, depending on the condition definition, an alert could signal a positive event: a customer has doubled an order, a process has attained a certain level of efficiency, sales in a particular region have exceeded the norm, and so on. You can use severity settings to signal whether the alert denote a positive event (info level) or a negative one (warning or failure level).
Once an alert is issued, you have several ways to deal with the situation. You can:
-
view the logged instance
-
notify interested parties by email
Condition alerts that have occurred can be queried, filtered, and viewed on the Alerts tab of the related transaction instance. Alerts created in the last 24 hours for all objects can also be filtered and viewed using the Condition Alerts view (from the Navigator bar). The dashboards also include various alert counts.
8.9 Working with Conditions
This section explains how you complete the following tasks in working with conditions:
Section 8.10, "Viewing Condition Alert Information," provides information on viewing alert counts and alerts that are generated when a condition is met.
8.9.1 Enabling and Disabling Fault Monitoring
When you create a transaction, a fault monitoring condition is automatically created on the transaction and is disabled.
To Check Fault Monitoring Status
-
Select the transaction of interest.
-
Click the Conditions tab. Fault Monitoring state is shown.
-
You can click the Edit button to enable fault monitoring, or you can use the Modify menu as described next.
-
Select the transaction for which you want to enable fault monitoring.
-
Select Modify > Enable/Disable Fault Monitoring for TransactionName. Business Transaction Management displays the Edit Fault Monitoring tool for the selected object.
-
Use the Severity drop down list to select the severity level you want to associate with fault-generated alerts for this object. Business Transaction Management shows the fault monitoring is enabled for the service on the Conditions tab for the service, and also shows the severity status for fault monitoring.
-
To disable, you can click the Edit button in the Conditions tab and deselect the enable check box in the resulting dialog. (You can also use the Enable/Disable Monitoring item from the Modify menu.
8.9.2 Defining a Condition
How you define a condition differs, depending on whether it's a content-based condition or a missing message condition. Both options are described below.
To Define a Content-Based Condition
-
Select the transaction for which you want to define a condition.
-
Select Create > Transaction Condition > Content Condition for TransactionName. Business Transaction Management displays the Create Condition tool dialog.
-
Specify the name of the condition in the Name text box.
-
Select a value for the severity you want to associate with this condition from the Severity drop-down list.
Associating a severity level with a condition allows you to filter your views of alerts based on this attribute.
-
Use the Enabled check box to enable or disable the condition.
-
Optional: Use the Description text field to provide a description that helps you understand the nature or use of this condition without having to read through the boolean expression.
-
Use the buttons and the items in the Criteria area to create the boolean expression that will be used when the condition is evaluated. Three buttons are displayed from which you can select the elements that will compose your condition. (All clauses must belong to the same message (operation phase).
The Property button is displayed only if you have defined properties for the selected object.) The table below describes the use of the buttons. Once you click a button to select an element, a row is added to the Criteria used to define the condition. For each row, select an operator, and a value to test.
When you are done, click Apply.
Buttons Description New Property If you need to define a property to base the condition on and you have not done so already, you can use the New Property button to create one. Property Select an existing property. Fault Select the operation whose status interests you, and specify whether you are looking for a particular code or any fault in the Criteria section.
To Define a Missing-Message Condition
To define a missing message condition, you must specify the message whose arrival time interests you and how much time must elapse before its absence raises an alert. The absent message can be a request, a response, or any fault.
-
Select the transaction for which you want to define a condition.
-
Select Create > Transaction Condition > Missing Message Condition for TransactionName. Business Transaction Management displays the Create condition tool dialog.
-
Specify the name of the condition in the Name text box.
-
Select a value for the severity you want to associate with this condition from the Severity drop-down list. Associating a severity level with a condition allows you to filter your views of alerts based on this attribute.
-
Use the Enabled check box to enable or disable the condition.
-
Optional: Use the Description text field to provide a description that helps you understand the nature or use of this condition without having to read through the boolean expression.
-
Use the drop down lists in the Criteria area to create the boolean expression that Business Transaction Management will evaluate when the condition is evaluated. Three drop down lists are displayed from which you can select the elements that will compose your condition.
Drop-down list Description Operation name Select an operation from the drop down list. Operation phase Select request, response, or fault from the drop down list Evaluation period Select the period of evaluation: either before the transaction's maximum duration has expired or Use timer. If you select Use timer, you must specify the time period in milliseconds.
In either case, Business Transaction Management will start timing on a per instance basis when the transaction's start message arrives.
8.9.3 Enabling and Disabling Conditions
You can enable and disable conditions individually or multiple conditions at once.
To Enable or Disable an Individual Condition
-
Select the transaction for which this condition is defined.
-
Click the Conditions tab in the detail area.
-
Click the Edit button for the condition you want to enable or disable.
-
Select Modify from the drop down list.
-
In the ensuing dialog click the Enabled/Disabled check box to change the status of the condition.
-
Click Apply.
To Enable or Disable Selected Conditions
-
Select the transaction whose conditions you want to enable or disable.
-
Select Modify > Enable/Disable Conditions for TransactionName.
-
In the ensuing dialog click the Enable All or Disable All buttons to change the status of the conditions or use the radio buttons to select the conditions of interest.
-
Click Apply.
8.9.4 Viewing Condition Information
8.9.5 Modifying a Condition Definition
8.9.6 Duplicating a Condition Definition
8.10 Viewing Condition Alert Information
When a condition evaluates to true, the system tracks its occurrence and automatically creates a condition alert. This section explains the various ways Business Transaction Management displays count and condition alert information, and it explains how you can modify the amount of time that alerts are stored.
You cannot manually delete alerts.
8.10.1 Viewing Count Information
You can view count information condition alerts as follows:
-
In the Operational Health Summary dashboard (counts for each type of alert).
-
In the Top 10 Transactions dashboard.
-
In the Alerts tab of a transaction.
-
In the Performance pane of the Analysis tab for the transaction.
-
In the Conditions pane of the Analysis tab for the transaction.
You can also edit the summary view (for a transaction) to show a count of condition alerts and the current condition alert rate by using the column chooser and selecting the Condition alert and Condition alert rate instruments. The Condition alert instrument specifies the condition occurrences in the specified period. The Condition alert rate instrument specifies the number of condition occurrences per hour in the given period.
8.10.2 Viewing Alert and Detail information
You can view condition alerts in the following ways:
-
on the Alerts tab of the related service, endpoint, operation, or transaction instance. Detailed information for the selected alert is shown in a separate window if you click the looking glass icon or double click the alert
-
in the Condition Alerts view from the navigator for condition alerts that occurred in the last hour. Detailed information for the selected alert is shown in the Info tab in the tab area.
Condition alert detail includes the following information:
-
the name and severity of the condition and the expression whose evaluation triggered the alert.
-
summary information: The name of the transaction, the time it was captured (Start Time), its ID, the number of message exchanges and the total messages, the response time for the transaction, and any conditions alerts raised while the transaction executed (with severity flags shown).
-
a graph of the transaction, showing the operation for which the condition expression evaluated to true with a red broken arrow. To display the request and response message for each operation, click the inspector icon for the desired operation in the list below the graph.
8.10.3 Modifying Alert Expiration Time
By default logged information for alerts expires after 1 year (31536000 seconds).
You can change the alert expiration time as follows:
-
Select Administration > System Services from the Navigator.
-
Select the AP_Notifier_Service in the summary pane.
-
Select Edit Setup Data for AP_Notifier_Service from the Admin menu.
-
Modify the Logged notification expiration time field to the desired number (of seconds).
-
Click Apply.