2 IBM DB2 Database Metrics
This chapter provides descriptions for all IBM DB2 Database metric categories, and tables list and describe associated metrics for each category. The tables also provide user actions if any of the metrics for a particular category support user actions. Shaded rows represent key columns for a particular category.
2.1 Viewing Metrics
To view the configuration metrics within the plug-in, navigate to the Last Collected configuration metrics page by selecting Configuration, then Last Collected from IBM DB2.
Figure 2-1 Last Collected Page for IBM DB2 Plug-in
Description of "Figure 2-1 Last Collected Page for IBM DB2 Plug-in"
To view the performance and status metrics within the plug-in, navigate to the plug-in's All Metrics page by selecting Monitoring, then All Metrics from IBM DB2.
Figure 2-2 All Metrics Page for the IBM DB2 Plug-in
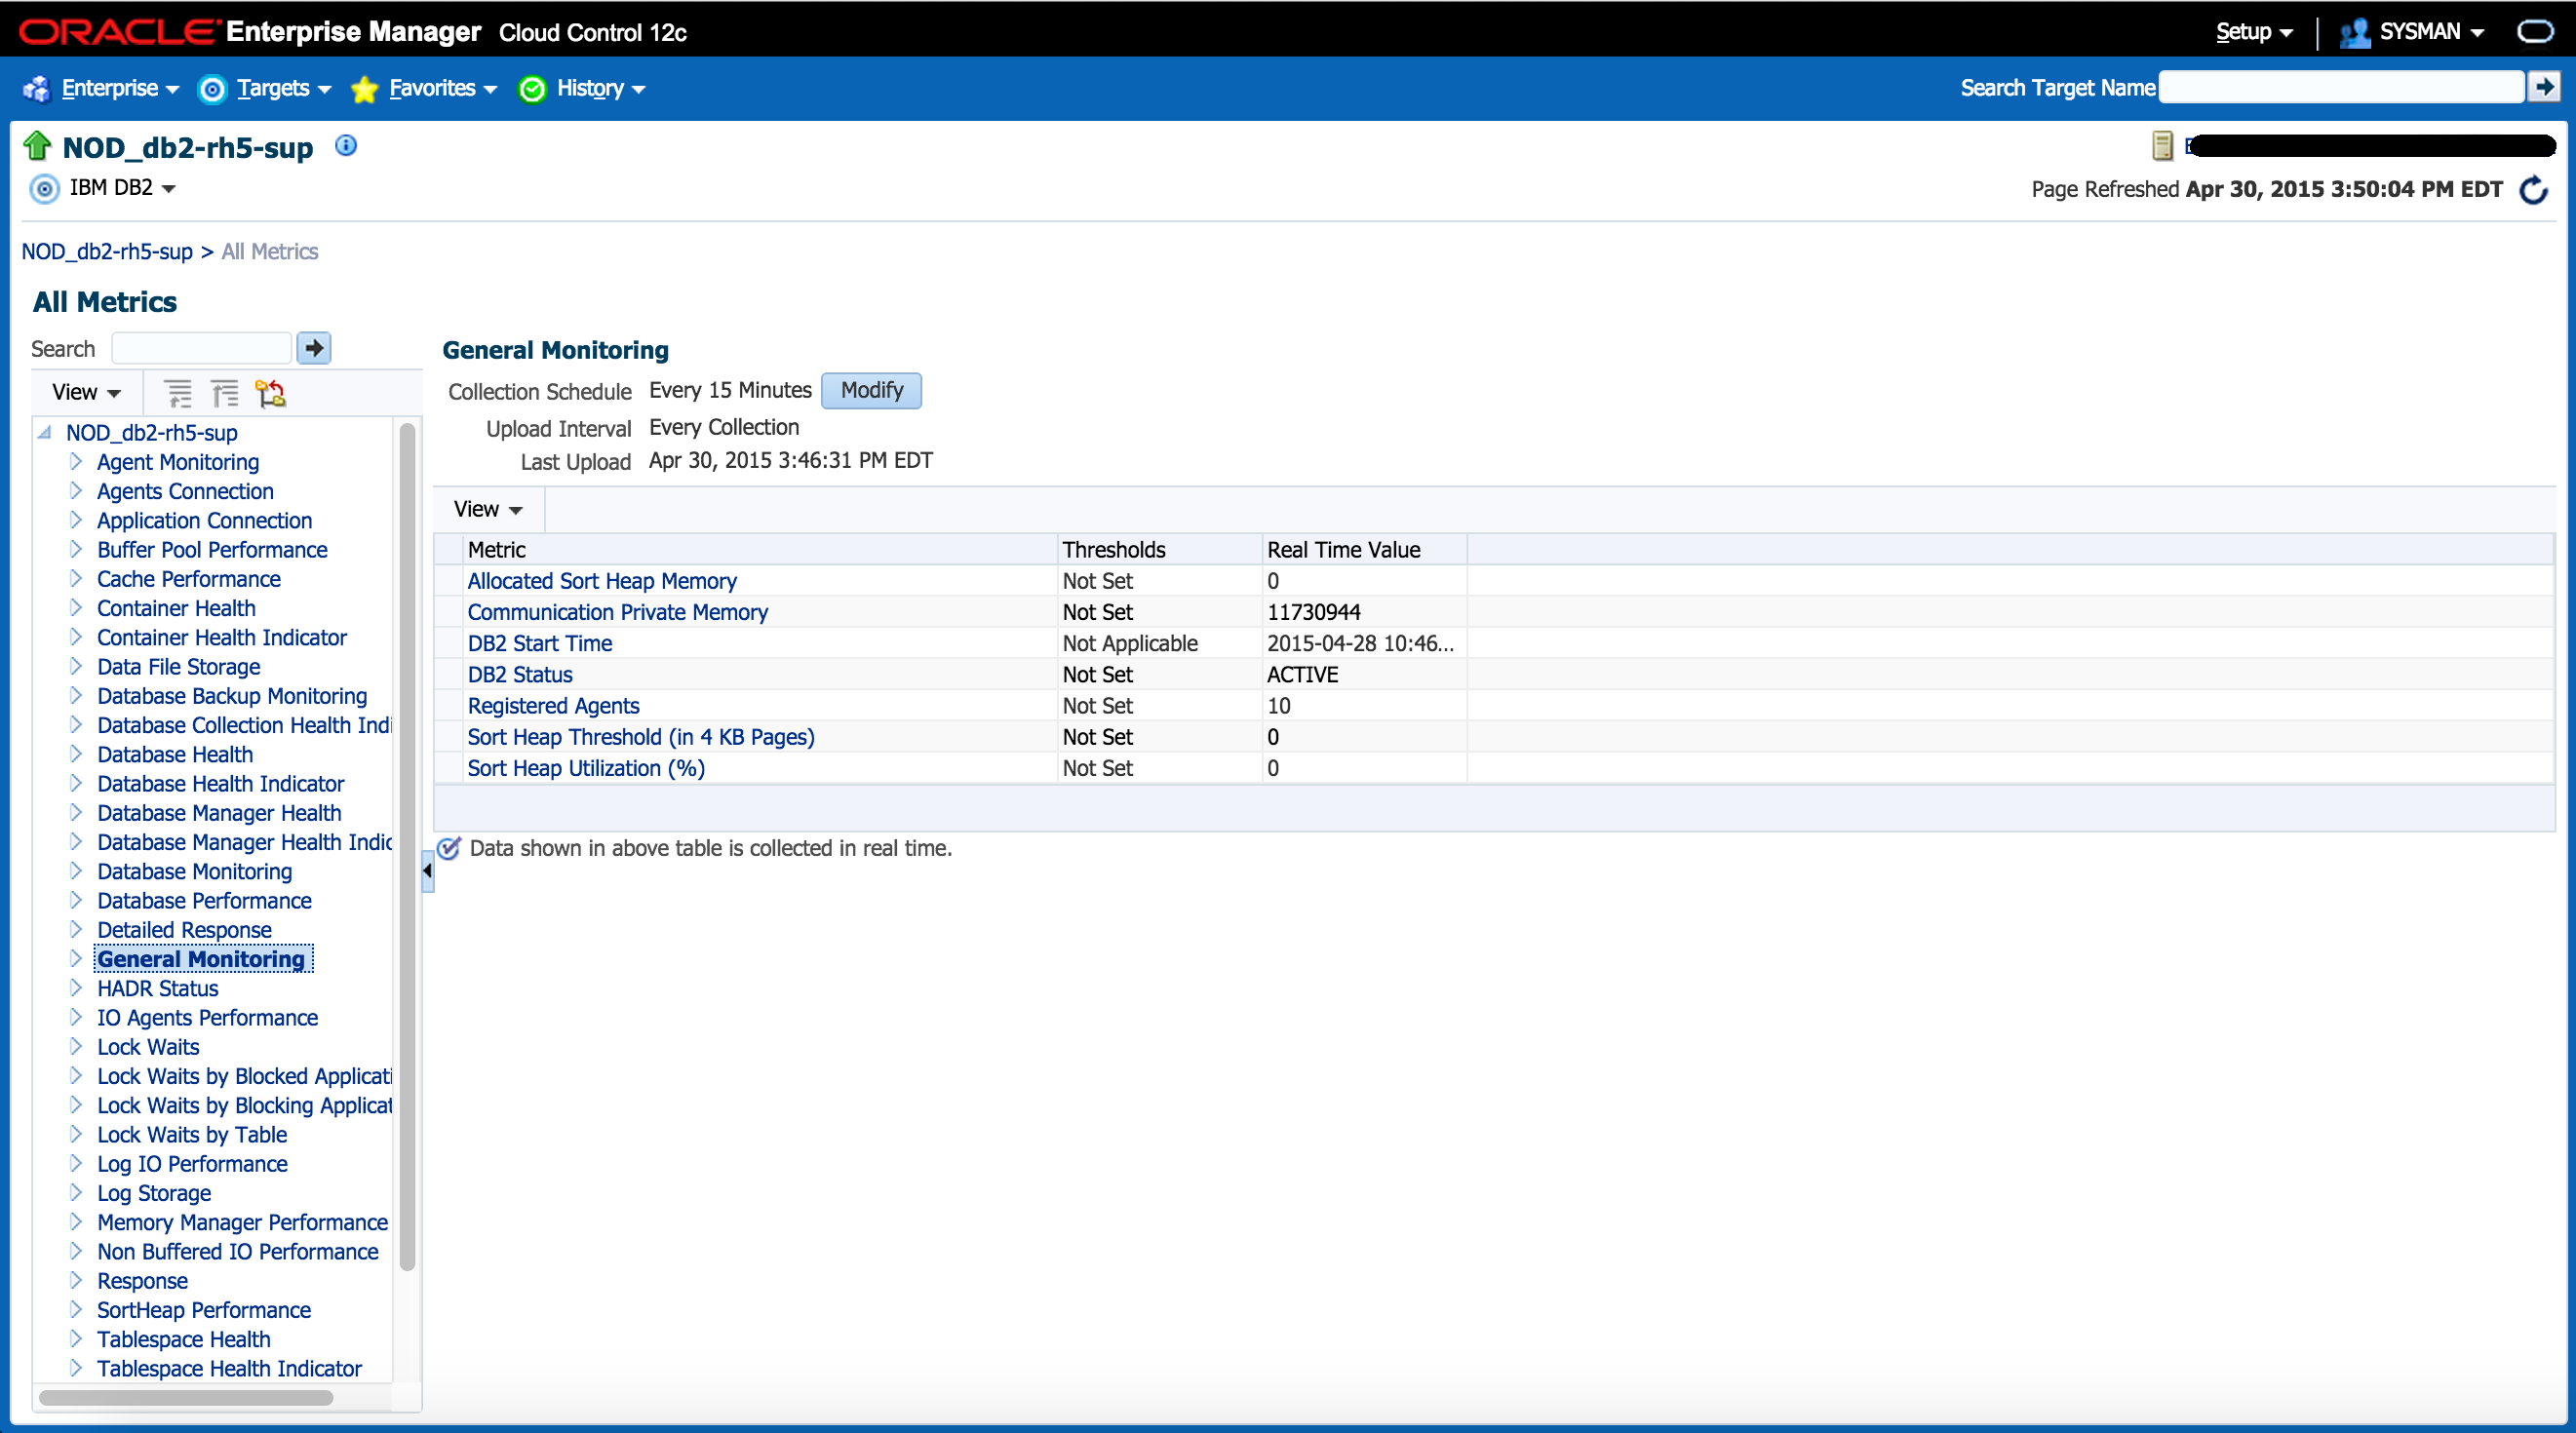
Description of "Figure 2-2 All Metrics Page for the IBM DB2 Plug-in"
2.2 Connections
Connections metrics provide the connection details for the database at the agent level and at the Database Manager level. Connections metrics consist of the following categories:
2.2.1 Agents Connection
The metrics in this category return the agent connection statistics, including the configured values and the current parameter values at the database manager snapshot level.
Default Collection Interval — Every 15 minutes
Table 2-1 Agents Connection Metrics
| Metric | Description and User Action |
|---|---|
|
Agent Created Due to Empty Pool |
Number of agents created due to an empty pool. |
|
Agent Creation Rate |
Creation rate for agents in the last interval, which equals: (agents_created_empty_pool-agents_created_empty_pool)/ __interval Increase the value of the configuration parameter agents_created_empty_pool. |
|
Agent Creation to Assignment Ratio |
Creation to assignment ratio, which equals: (agents_created_empty_pool /agents_from_pool) Increase the value of the configuration parameter agents_from_pool. |
|
Agent Limit |
Number of agents the database manager can create. |
|
Agent Waiting Top |
Maximum number of agents that have waited. |
|
Agents Assignment Rate |
Assignment rate for agents in the last interval, which equals: (agents_from_pool-agents_from_pool) /__interval Increase the value of the configuration parameter agents_from_pool. |
|
Agents Registered |
Number of registered agents. |
|
Agents Waiting on Token |
Number of agents waiting on a token. |
|
Coordination Agents Top |
Maximum number of coordination agents. |
|
Idle Agents |
Number of idle agents. |
|
Maximum Agents Registered |
Maximum number of registered agents. |
|
Maximum Coordination Agents |
Maximum number of coordination agents the database has created. |
|
Pool Agents |
Number of agents from the pool. |
2.2.2 Application Connection
The metrics in this category return the current connection information at both the database and database manager snapshot level, including the number of active connections.
Default Collection Interval — Every 15 minutes
Table 2-2 Application Connection Metrics
| Metric | Description |
|---|---|
|
Active Applications |
Number of active applications. |
|
Active Local Connections |
Number of active local connections. |
|
Active Remote Connections |
Number of active remote connections. |
|
Applications Connected |
Number of applications connected. |
|
Database Name (key column) |
Name of the database |
|
Remote Connections |
Current number of connections initiated from remote clients to the instance of the database manager that is being monitored. |
|
Local Connections |
Number of local applications currently connected to a database within the database instance being monitored. |
|
Total Connections |
Total number of connections. |
2.3 Database Manager Configuration Information
Database Manager Configuration Information metrics describe a set of database manager configuration parameters. These values are of two types: in hard disk and in memory, which is the type presented here. Database Manager Configuration Information metrics consist of the following categories:
2.3.1 Capacity
The metrics in this category return the database manager capacity configuration parameters that can impact the throughput on your system.
-
Table Name — MGMT_EMX_IBMDB2_DBMCAP
-
View Name — MGMT_EMX_IBMDB2_DBMCAP_VIEW
Default Collection Interval — Every 24 hours
| Metric | Description |
|---|---|
|
Application Support Layer Size |
The application support layer heap represents a communication buffer between the local application and its associated agent. |
|
Database System Monitor Heap Size |
Determines the amount of memory, in pages, to allocate for database monitor data. |
|
Audit Buffer Size |
Specifies the size of the buffer used when auditing the database. |
|
Maximum Java Interpreter Heap Size |
Determines the maximum size of the heap used by the Java interpreter started to service Java DB2 stored procedures and UDFs. |
|
Maximum Total Files Open |
Defines the maximum number of files that can be opened by all agents and other threads executing in a single database manager instance. |
|
Priority of Agents |
Controls the priority the operating system scheduler gives to all agents and other database manager instance processes and threads. |
|
Maximum Number of Agents |
Indicates the maximum number of database manager agents, whether coordinator agents or subagents, available at any given time to accept application requests. |
|
Maximum Number of Concurrent Agents |
Maximum number of database manager agents that can concurrently execute a database manager transaction. |
|
Agent Pool Size |
Determines the maximum size of the idle agent pool. |
|
Initial Number of Agents in Pool |
Determines the initial number of idle agents created in the Agentpool at DB2START time. |
|
Sort Heap Threshold |
The size of the shared sort memory is statically predetermined at the time of the first connection to a database based on the value of the sort heap threshold configuration parameter (sheapthreas). |
2.3.2 Connection
The metrics in this category return the parameters that provide information about using DB2 in a client/server environment.
-
Table Name — MGMT_EMX_IBMDB2_DBMCON
-
View Name — MGMT_EMX_IBMDB2_DBMCON_VIEW
Default Collection Interval — Every 24 hours
| Metric | Description |
|---|---|
|
TCP/IP Service Name |
Contains the name of the TCP/IP port that a database server uses to communicate to the client. |
|
Search Discovery Communications Protocols |
From an administration server perspective, this metric defines the search discovery managers started when DB2ADMIN starts. |
2.3.3 Database Instance
The metrics in this category return the parameters that provide information about database manager instances.
-
Table Name — MGMT_EMX_IBMDB2_DBMDBINST
-
View Name — MGMT_EMX_IBMDB2_DBMDBINST_VIEW
Default Collection Interval — Every 24 hours
Table 2-5 Database Instance Metrics
| Metric | Description |
|---|---|
|
Diagnostic Error Capture Level |
Determines the type of diagnostic errors recorded in the db2diag.log file. |
|
Diagnostic Directory Data Path |
Enables you to specify the fully qualified path for DB2 diagnostic information. |
|
Notify Level Raw |
Specifies the type of administration notification messages written to the administration notification log. |
|
Default Database System Monitor Switches |
Unique metric that enables you to set several switches, each of which are internally represented by a bit of the metric. |
|
Communications Bandwidth |
Value calculated for the communications bandwidth in MB per second. |
|
CPU Speed Raw |
The CPU speed, in milliseconds per instruction, used by the SQL optimizer to estimate the cost of performing certain operations. |
|
Maximum Number of Concurrently Active Databases |
Specifies the number of local databases that can be concurrently active. |
|
System Administration Authority Group Name |
Defines the group name with SYSADM authority for the database manager instance. |
|
Notify Level |
If notifylevel_raw equals:
Otherwise, All Informational messages. |
|
CPU Speed |
CPU speed in MIPs, which equals: 1/(cpuspeed_raw*1000) |
2.3.4 Logging and Recovery
The metrics in this category save the logging and recovery information. Recovering your environment can be very important to prevent the loss of critical data. A number of parameters are available to help you manage your environment and to ensure that you can adequately recover your data or transactions.
-
Table Name — MGMT_EMX_IBMDB2_DBMLOGREC
-
View Name — MGMT_EMX_IBMDB2_DBMLOGREC_VIEW
Default Collection Interval — Every 24 hours
Table 2-6 Logging and Recovery Metrics
| Metric | Description |
|---|---|
|
Transaction Manager Database Name |
Identifies the name of the transaction manager (TM) database for each DB2 instance. |
|
Transaction Resync Interval |
Specifies the time interval in seconds for which a transaction manager (TM), resource manager (RM), or sync point manager (SPM) should retry the recovery of any outstanding transactions in doubt found in the TM, RM, or SPM. |
|
Sync Point Manager Name |
Identifies the name of the sync point manager (SPM) instance to the database manager. |
|
Sync Point Manager Log File Size |
Identifies the sync point manager (SPM) log file size in 4 KB pages. |
|
Sync Point Manager Resync Agent Limit |
Identifies the number of agents that can simultaneously perform resync operations. |
2.3.5 Partitioned Database Environment
The metrics in this category return parameters about parallel operations and partitioned database environments.
-
Table Name — MGMT_EMX_IBMDB2_DBMPARENV
-
View Name — MGMT_EMX_IBMDB2_DBMPARENV_VIEW
Default Collection Interval — Every 24 hours
Table 2-7 Partitioned Database Environment Metrics
| Metric | Description |
|---|---|
|
Connection Elapsed Time |
Specifies the number of seconds within which a TCP/IP connection is to be established between two database partition servers. |
|
Number of FCM Buffers |
Specifies the number of 4 KB buffers used for internal communications (messages) both among and within database servers. |
|
Node Connection Retries |
max_connretries specifies the number of connection retries that can be made to a database partition server. |
|
Maximum Time Difference Among Nodes |
Each database partition server has its own system clock. This metric specifies the maximum time difference, in minutes, that is permitted among the database partition servers listed in the node configuration file. |
|
Start and Stop Timeout |
Applicable only in a partitioned database environment. |
2.4 Health Indicators/Alarms
Health Indicators/Alarms metrics return the health information and current values for all the snapshot levels of containers, tablespaces, databases and the Database Manager. Health Indicators/Alarms metrics consist of the following categories:
2.4.1 Container Health Indicator
The metrics in this category return health indicator information for tablespace containers from a health snapshot of tablespaces in a database.
Default Collection Interval — Every 30 minutes
Table 2-8 Container Health Indicator Metrics
| Metric | Description and User Action |
|---|---|
|
Container Health Indicator Additional Info |
Additional information present in the Container Health Indicator metrics. |
|
Container Health Indicator Alert State |
State of the alert. If alert_state_raw equals:
A warning or alarm condition indicates that you should examine the Health Indicator Alert Type. |
|
Container Name |
Name of the container. |
|
Health Indicator Alert Type |
Type of alert. If alert_state_raw equals:
|
|
Health Indicator Identifier |
Identifier for the alert. |
|
Health Indicator Timestamp |
Time when the alert was generated. |
|
Health Indicator Value |
Value for the alert. |
|
Node Number |
Node at which the alert was generated. |
|
Snapshot Timestamp |
Time when the query was executed. |
2.4.2 Container Health
The metrics in this category return container information from a health snapshot of a database.
Default Collection Interval — Every 30 minutes
Table 2-9 Container Health Metrics
| Metric | Description and User Action |
|---|---|
|
Container Name (key column) |
Name of the container. |
|
Tablespace Name (key column) |
Name of the tablespace to which the container belongs. |
|
Node Number |
Node at which the container resides. |
|
Container Rolled Up Alert State |
If alert_state_raw equals:
|
|
Snapshot Timestamp |
Time when the query was executed. |
2.4.3 Database Collection Health Indicator
The metrics in this category return container information from a health snapshot of a database.
Default Collection Interval — Every 30 minutes
Table 2-10 Database Collection Health Indicator Metrics
| Metric | Description and User Action |
|---|---|
|
Health Indicator Object Detail |
Description of the object. |
|
Health Indicator Object Name |
Name of the object. |
|
Health Indicator Object State |
Severity of the alert. |
|
Health Indicator Object State Detail |
Type of alert state. A warning or alarm condition indicates that the Health Indicator Alert Type should be examined. |
2.4.4 Database Health
The metrics in this category return information from a health snapshot of a database.
Default Collection Interval — Every 30 minutes
Table 2-11 Database Health Metrics
| Metric | Description and User Action |
|---|---|
|
Database Name (key column) |
Name of the database. |
|
Database Path |
Physical path of the database. |
|
Logical Location of Database |
Location of the database with respect to the DBM. |
|
Database Rolled Up Alert State |
If alert_state_raw equals:
A warning or alarm condition indicates there are one or more alerts on the database. |
|
Database Alias |
Alias name for the database. |
|
Server Platform |
Platform where the database is installed. |
|
Snapshot Timestamp |
Time when the query was executed. |
2.4.5 Database Health Indicator
The metrics in this category return health indicator information from a health snapshot of a database.
Default Collection Interval — Every 30 minutes
Table 2-12 Database Health Indicator Metrics
| Metric | Description and User Action |
|---|---|
|
Health Indicator Identifier |
Unique identifier for Health Indicator. |
|
Database Health Indicator Alert State |
If alert_state_raw equals:
A warning or alarm condition indicates that the Health Indicator Alert Type should be examined. |
|
Health Indicator Alert Type |
If alert_state_raw equals:
|
|
Health Indicator Timestamp |
Time when the alert was generated. |
|
Health Indicator Value |
Value for the alert. |
|
Snapshot Timestamp |
Time when the query was executed. |
|
Database Health Indicator Additional Info |
Additional information present in the Database Health Indicator metrics. |
2.4.6 Database Manager Health
The metrics in this category return information from a health snapshot of the DB2 Database Manager.
Default Collection Interval — Every 30 minutes
Table 2-13 Database Manager Health Metrics
| Metric | Description and User Action |
|---|---|
|
Server Instance Name (key column) |
Host name where DB2 is installed. |
|
DB2 Startup Time |
Time DB2 was last started. |
|
Last Reset |
Time DB2 was last reset. |
|
Number of Nodes in DB2 Instance |
Number of nodes in the DB2 instance. |
|
Rolled up Alert State |
If alert_state_raw equals:
A warning or alarm condition indicates that the Health Indicator Alert Type should be examined. |
|
Server Instance Name |
Host name where DB2 is installed |
|
Snapshot Timestamp |
Time when the query was executed. |
2.4.7 Database Manager Health Indicator
The metrics in this category return health indicator information from a health snapshot of the DB2 Database Manager.
Default Collection Interval — Every 30 minutes
Table 2-14 Database Manager Health Indicator Metrics
| Metric | Description and User Action |
|---|---|
|
Database Name (key column) |
Name of the database. |
|
DB Manager Health Indicator Additional Info |
Additional information present in the DBM Health Indicator metrics. |
|
DB Manager Health Indicator Alert State |
If alert_state_raw equals:
A warning or alarm condition indicates there are one or more alerts on the database. |
|
Health Indicator Alert Type |
If alert_state_raw equals:
|
|
Health Indicator Identifier |
Identifier for the alert. |
|
Health Indicator Timestamp |
Time when the alert was generated. |
|
Health Indicator Value |
Value for the alert. |
|
Server Instance Name |
Host name where DB2 is installed. |
|
Snapshot Timestamp |
Time when the query was executed. |
|
Additional Information |
Additional information present in the DBM Health Indicator metrics. |
2.4.8 Tablespaces Health
The metrics in this category return health indicator information for tablespaces from a health snapshot of tablespaces in a database.
Default Collection Interval — Every 30 minutes
2.4.9 Tablespace Health Indicator
The metrics in this category return health indicator information for tablespaces from a health snapshot of tablespaces in a database.
Default Collection Interval — Every 30 minutes
Table 2-16 Tablespace Health Indicator Metrics
| Metric | Description and User Action |
|---|---|
|
Tablespace Name (key column) |
Name of the tablespace. |
|
Tablespace Health Indicator Alert State |
If alert_state_raw equals:
|
|
Health Indicator Alert Type |
If alert_state_raw equals:
|
|
Health Indicator Identifier |
Identifier for the alert. |
|
Health Indicator Timestamp |
Time when the alert was generated. |
|
Health Indicator Value |
Value for the alert. |
|
Snapshot Timestamp |
Time when the query was executed. |
|
Tablespace Health Indicator Additional Info |
Additional information present in the Tablespace Health Indicator metrics. |
2.5 Monitoring Information
Monitoring Information metrics capture the monitoring information for the database, including general monitoring information, monitored values of the Agent, and monitored values of the database. Monitoring Information metrics consist of the following categories:
2.5.1 Agent Monitoring
The metrics in this category return information about Agents from an application snapshot.
Default Collection Interval — Every 15 minutes
Table 2-17 Agent Monitoring Metrics
| Metric | Description and User Action |
|---|---|
|
Agent Cpu Utilization (%) |
Total CPU utilization, which is equal to: Agent_total_cpu_time-_Agent_total_cpu_time )/1000)/__interval)*100 |
|
Agent Identifier |
Unique ID for each Agent. |
|
Application Average Lock Wait Time (ms) |
The average waiting time for locks, which equals: lock_wait_time / lock_wait If the average lock wait time is high, you should look for applications that hold many locks, or have lock escalations, with a focus on tuning your applications to improve concurrency, if appropriate. If escalations are causing a high average lock wait time, the values of one or both of the locklist and maxlocks configuration parameters may be too low. |
|
Application Commit SQL Statements Rate |
Commit SQL statements reading rate, which equals: commit_sql_stmts - _commit_sql_stmts/ __interval You can set the required value for the warning and critical thresholds to monitor any adverse conditions. |
|
Application Dynamic SQL Statements Rate |
Dynamic SQL statements reading rate, which equals: dynamic_sql_stmts - _dynamic_sql_stmts/ __interval You can set the required value for the warning and critical thresholds to monitor any adverse conditions. |
|
Application Failed SQL Statements Rate |
Failed SQL statements reading rate, which equals: failed_sql_stmts - _failed_sql_stmts/ __interval You can set the required value for the warning and critical thresholds to monitor any adverse conditions. |
|
Application Identifier |
Unique ID for each application. |
|
Application Name |
Name of the application. |
|
Application Priority |
Priority of Agents working for this application. |
|
Application Rollback SQL Statements Rate |
Rollback SQL statements reading rate, which equals: rollback_sql_stmts - _rollback_sql_stmts/ __interval You can set the required value for the warning and critical thresholds to monitor any adverse conditions. |
|
Application Row Reading Rate |
Rows reading rate in the last interval, which equals: rows_read - rows_read)/__interval You can set the required value for the warning and critical thresholds to monitor any adverse conditions. |
|
Application Row Writing Rate |
Rows writing rate in the last interval, which equals: rows_written - rows_written)/__interval You can set the required value for the warning and critical thresholds to monitor any adverse conditions. |
|
Application Static SQL Statements Rate |
Static SQL statements reading rate, which equals: static_sql_stmts - _static_sql_stmts/ __interval You can set the required value for the warning and critical thresholds to monitor any adverse conditions. |
|
Application Status |
Status of the application corresponding to the value of application_status_raw. |
|
Authorization ID |
Authorization ID of the user who invoked the application being monitored. On a DDCS gateway node, this is the user's authorization ID on the host. |
|
Client Database Alias |
Alias of the database provided by the application to connect to the database. |
|
Client Name |
Name of the Client for the database. |
|
Client Node Number |
client_nname in the database manager configuration file at the client node. |
|
Commit SQL Statements |
Number of commit SQL statements. |
|
Coordinator Agent Process Identifier |
Process ID (UNIX systems) or thread ID (Windows systems) of the coordinator Agent for the application. |
|
Dynamic SQL Statements |
Number of dynamic SQL statements. |
|
Execution Identifier |
ID that the user specified when logging in to the operating system. This ID is distinct from the Authorization ID, which the user specifies when connecting to the database. |
|
Failed SQL Statements |
Number of failed SQL statements. |
|
Host CPU Usage Per Sec (%) |
Ratio of CPU time utilized in the last interval, which equals: elapsed_exec_time_ms - elapsed_exec_time_ms / __interval You can set the required value for the warning and critical thresholds to monitor any adverse conditions. |
|
IO Waits |
IO wait time. |
|
Number of Applications Waiting on Locks |
Total number of applications that are currently waiting on locks. |
|
Number of Deadlocks |
Total number of deadlocks that have occurred. |
|
Number of Exclusive Lock Escalations |
Number of exclusive lock escalations. |
|
Number of Lock Escalations |
Number of lock escalations. |
|
Number of Locks Held |
Number of locks currently held by an application. |
|
Number of Lock Timeouts |
Number of lock timeouts for the application. |
|
Number of Lock Waits |
Number of times the application waited for locks. |
|
Number of Rows Read |
Total number of rows read. |
|
Number of Rows Written |
Total number of rows written. |
|
Number of Sorts |
Number of sorts performed by the statement. |
|
Rollback SQL Statements |
Number of rollback SQL statements. |
|
Statement Average Sort Time (ms) |
Average sort time per sort for the statement, which equals: stmt_sorts/total_sort_time |
|
Statement Rows Read |
Total number of statement rows read |
|
Statement Rows Written |
Total number of statement rows written. |
|
Statement Operation |
Statement operation value. |
|
Statement Start Time |
Start time of the statement. |
|
Statement Text |
Whole query or the statement executed. |
|
Statement Total Sort Time (ms) |
Total time used for statement sorting. |
|
Statement Total Sorts |
Total number of sorts. |
|
Statement Type |
Number of requests to perform a direct write of one or more sectors of data. |
|
Static SQL Statements |
Number of static SQL statements. |
|
System-CPU Time Used by Agent (ms) |
Total system time used by DBM for processing by the Management Agent. |
|
System-CPU Time Used by Statement (ms) |
Total system time used by DBM for processing by the statement. |
|
Total CPU Time Used Statement (ms) |
Total CPU time, which equals: stmt_usr_cpu_time + stmt_sys_cpu_time |
|
Total CPU Time Used by Agent (ms) |
Total CPU time, which equals: agent_usr_cpu_time + agent_sys_cpu_time |
|
Total Elapsed Execution Time (ms) |
Sum of the host execution times (in milliseconds) for all the statements that were executed for a particular application. |
|
Total Idle Time (ms) |
Time spent idle for an application. |
|
Total Lock Wait Time (ms) |
Total time the application waited for locks. |
|
Total Sort Time |
Total time used for sorting. |
|
User-CPU Time Used by Agent (ms) |
Total user time used by DBM for processing by the Agent. |
|
User-CPU Time Used by Statement (ms) |
Total user time used by DBM for processing by a Statement. |
|
Statement Hash |
Hash of the SQL statement text. |
2.5.2 Database Monitoring
The metrics in this category return snapshot information from the database and
detail_log logical data groups.
Default Collection Interval — Every 15 minutes
Table 2-18 Database Monitoring Metrics
| Metric | Description |
|---|---|
|
Database Name (key column) |
Real name of the database for which information is collected or to which the application is connected. This is the name the database was given when created. |
|
Allocated Database Size (Bytes) |
Capacity of the database. (Not available in partitioned databases.) |
|
Commit SQL Statements |
Number of applications waiting for a lock on an object in the database. Number of commit SQL statements. |
|
Database Average Lock Wait Time (ms) |
Average waiting time for locks, which equals: lock_wait_time/lock_wait High wait for an application can mean that the application is degrading performance. |
|
Number of Applications Waiting on Locks |
Number of applications waiting for a lock on an object in the database. |
|
Database Commit SQL Statements Rate |
Commit SQL statement reading rate, which equals: commit_sql_stmts - _commit_sql_stmts/ __interval The required value can be set for the warning and critical thresholds to monitor any adverse conditions. |
|
Database Connection Time |
Last time the database was connected. |
|
Database Dynamic SQL Statements Rate |
Dynamic SQL statement reading rate, which equals: dynamic_sql_stmts - _dynamic_sql_stmts/ __interval The required value can be set for the warning and critical thresholds to monitor any adverse conditions. |
|
Database Failed SQL Statements Rate |
Failed SQL statement reading rate, which equals: failed_sql_stmts - _failed_sql_stmts/ __interval The required value can be set for the warning and critical thresholds to monitor any adverse conditions. |
|
Logical Location of Database |
Location of the database.
|
|
Physical Disk Location of Database |
Physical disk location of the database. |
|
Database Rollback SQL Statements Rate |
Rollback SQL statement reading rate, which equals: rollback_sql_stmts - _rollback_sql_stmts/ __interval The required value can be set for the warning and critical thresholds to monitor any adverse conditions. |
|
Current Database Size (Bytes) |
Size of the database in bytes. |
|
Database Space Utilization (%) |
Total percentage space utilization in the database, which equals: (db_size/db_capacity) *100 |
|
Database Static SQL Statements Rate |
Static SQL statement reading rate, which equals: static_sql_stmts - _static_sql_stmts/ __interval The required value can be set for the warning and critical thresholds to monitor any adverse conditions. |
|
Database Status |
Status of the database. |
|
Database Deadlock Rate (per sec) |
Rate of deadlocks, which equals: (deadlocks-_deadlocks)/_interval The required value can be set for the warning and critical thresholds to monitor any adverse conditions. |
|
Dynamic SQL Statements |
Number of dynamic SQL statements. |
|
Database Exclusive Lock Escalation Rate (per sec) |
Rate of exclusive lock escalations, which equals: (x_lock_escals-_x_lock_escals)/__interval The required value can be set for the warning and critical thresholds to monitor any adverse conditions. |
|
Number of Exclusive Lock Escalations |
Number of exclusive lock escalations. |
|
Failed SQL Statements |
Number of failed SQL statements. |
|
Server Instance Name |
Name of the database manager instance for which the snapshot was taken. |
|
Database Internal Deadlock Rollback Rate (per sec) |
Rate of internal deadlock rollbacks, which equals: (int_deadlock_rollbacks-_int_deadlock_rollbacks) /__interval The required value can be set for the warning and critical thresholds to monitor any adverse conditions. |
|
Number of Lock Escalations |
Number of lock escalations. |
|
Database Lock Escalation Rate (per sec) |
Rate of lock escalations, which equals: (lock_escals-_lock_escals)/__interval The required value can be set for the warning and critical thresholds to monitor any adverse conditions. |
|
Number of Lock Timeouts |
Number of lock timeouts for the application. |
|
Database Lock Timeouts Rate (per sec) |
Rate of lock timeouts. The required value can be set for the warning and critical thresholds to monitor any adverse conditions. |
|
Number of Locks Held |
Number of locks currently held by an application. |
|
Number of Active Current Connections |
Total number of active connections in the database. |
|
Number of Current Connections |
Total number of currently connected applications. |
|
Number of Deadlocks |
Total number of deadlocks that have occurred. |
|
Number of Internal Rollbacks |
Total number of internal deadlock rollbacks. |
|
Number of Lock Waits |
Number of times the application waited for locks. |
|
Database Percentage of Applications Wating on Locks (%) |
Ratio of applications waiting on locks, which equals: (locks_waiting /appls_cur_cons)*100 If a large number of applications are waiting on locks, this indicates a possible performance degradation. |
|
Rollback SQL Statements |
Number of rollback SQL statements. |
|
Static SQL Statements |
Number of static SQL statements. |
|
Total Lock Wait Time (ms) |
Total time the application waited for locks. |
|
Lock List in Use |
Total lock list memory in use. |
|
Last Reset |
Time DB2 was last reset. |
2.5.3 Database Backup Monitoring
The metrics in this category provide information about the last database backup.
Default Collection Interval — Every 2 hours
Table 2-19 Database Backup Monitoring Metrics
| Metric | Description |
|---|---|
|
Database Name (key column) |
Real name of the database for which information is collected or to which the application is connected. This is the name the database was given when created. |
|
Server Instance Name |
Name of the database manager instance for which the snapshot was taken. |
|
Last Backup Timestamp |
Last backup of the database. |
|
Days Since Last Backup |
Amount of days since the last database backup. |
2.5.4 General Monitoring
The metrics in this category provide basic information about the status of the databases and some of the important configuration values.
Default Collection Interval — Every 15 minutes
Table 2-20 General Monitoring Metrics
| Metric | Description and User Action |
|---|---|
|
DB2 Start Time |
Date and time that the database manager was started using the db2start command. |
|
Registered Agents |
Number of Agents registered in the DBM instance that is being monitored. |
|
Communication Private Memory |
Amount of communication private memory. |
|
Allocated Sort Heap Memory |
Amount of memory allocated to sort heap. |
|
Sort Heap Threshold (in 4 KB Pages) |
Maximum number of private memory pages to be used for private sorts, or the maximum number of shared memory pages to be used for shared sorts. If the sort is a private sort, this parameter affects Agent private memory. If the sort is a shared sort, this parameter affects the database shared memory. Each sort has a separate sort heap that is allocated as needed by the Database Manager. This sort heap is the area where data is sorted. If directed by the optimizer, a smaller sort heap than the one specified by this metric is allocated using information provided by the optimizer. |
|
DB2 Status |
Status of the DB2 instance. If DB2 status equals:
|
|
Sort Heap Utilization (%) |
Sort heap utilization, which equals: sort_heap_allocated / sortheap_threshold *100 Increase the value of the sort heap threshold configuration parameter, sheapthres. |
2.6 Performance
Performance metrics provide information regarding the performance at various snapshot levels. Performance metrics consist of the following categories:
2.6.1 IO Agents Performance
The metrics in this category provide performance metrics for the Agent at the application snapshot level.
Default Collection Interval — Every 15 minutes
Table 2-21 IO Agents Performance Metrics
| Metric | Description and User Action |
|---|---|
|
Database Name (key column) |
Real name of the database for which information is collected or to which the application is connected. This is the name the database was given when created. |
|
Cleans for Steals |
Number of times a page cleaner was invoked because a synchronous write was needed during the victim buffer replacement for the database. |
|
Cleans for Threshold |
Number of times a page cleaner was invoked because a buffer pool had reached the dirty page threshold criterion for the database. |
2.6.2 Database Performance
The metrics in this category provide performance metrics for all the bufferpools in the database.
Default Collection Interval — Every 15 minutes
Table 2-22 Database Performance Metrics
| Metric | Description and User Action |
|---|---|
|
Database Name (key column) |
Real name of the database for which information is collected or to which the application is connected. This is the name the database was given when created. |
|
Average Data Write Rate |
Pool data write rate, which equals: (pool_data_writes/pool_write_time) |
|
Average Index Write Rate |
Pool index write rate, which equals: (pool_index_writes/pool_write_time) |
|
Average Page Read Rate |
The rate equals: (pool_data_p_reads + pool_index_p_reads )/pool_read_time |
|
Average Page Write Rate |
The rate equals: (pool_data_writes + pool_index_writes)/pool_write_time |
|
Database Buffer Pool Data Hit Ratio (%) |
The ratio equals:((1-(pool_data_p_reads/pool_data_l_reads))*100)) |
|
Database Buffer Pool Hit Ratio (%) |
The ratio equals: (1-((pool_data_p_reads + pool_index_p_reads)/ (pool_data_l_reads + pool_index_l_reads )))*100 The required value can be set for the warning and critical thresholds to monitor any adverse conditions. |
|
Logical Data Read Rate |
The rate equals: (pool_data_l_reads /pool_read_time) |
|
Logical Index Read Rate |
The rate equals: (pool_index_l_reads /pool_read_time) |
|
Physical Data Read Rate |
The rate equals: (pool_data_p_reads/pool_read_time) |
|
Physical Index Read Rate |
The rate equals: pool_index_p_reads/pool_read_time |
|
Physical Data Reads |
Number of read requests that required I/O to get data pages into the buffer pool. |
|
Physical Index Reads |
Number of physical read requests to get index pages into the buffer pool. |
|
Pool Asynchronous Data Reads |
Number of data pages read asynchronously to the buffer pool by prefetchers. |
|
Pool Asynchronous Data Writes |
Number of times a buffer pool data page was physically written to disk by either an asynchronous page cleaner or a prefetcher. |
|
Pool Asynchronous Index Reads |
Number of index pages read asynchronously to the buffer poll by prefetchers. |
|
Pool Asynchronous Index Writes |
Number of times a buffer pool index page was physically written to disk by either an asynchronous page cleaner or a prefetcher. |
|
Pool Asynchronous Read Time (microseconds) |
Number of times a buffer pool data page was physically read from disk by an asynchronous page prefetcher. |
|
Pool Asynchronous Write Time (microseconds) |
Number of times a buffer pool index page was physically written to disk by either an asynchronous page cleaner or prefetcher. |
|
Pool Data Writes |
Number of times the buffer pool data page was physically written to the disk. |
|
Pool Index Writes |
Number of times the buffer pool index page was physically written to the disk. |
|
Logical Data Reads |
This count includes accesses to data that is already in the buffer pool when the database manager needs to process the page and read into the buffer pool before the database manager can process the page. |
|
Logical Index Reads |
Indicates the number of logical read requests to get index pages into the buffer pool. |
|
Pool Read Time (microseconds) |
Provides the total amount of elapsed time spent processing read requests that caused data or index pages to be physically read from disk to buffer pool. |
|
Pool Write Time (microseconds) |
Total amount of time spent physically writing data or index pages from the buffer pool to disk. |
|
Synchronous Data Read Rate |
Total synchronous read rate, which equals: ((pool_read_time-pool_async_read_time == 0) ? 0 :((pool_data_p_ reads-pool_async_data_reads )/(pool_read_time-pool_async_read_ time))) |
|
Synchronous Data Write Rate |
Pool data synchronous write rate, which equals: ((pool_data_writes - pool_async_data_writes )/(pool_write_time-pool_async_write_time)) |
|
Synchronous Index Read Rate |
Index synchronous read rate, which equals: (pool_data_p_reads-pool_async_index_reads )/(pool_read_time-pool_async_read_time) |
|
Synchronous Index Write Rate |
Index synchronous write rate, which equals: ((pool_index_writes - pool_async_index_writes )/(pool_write_time-pool_async_write_time)) |
2.6.3 Bufferpool Performance
The metrics in this category provide performance metrics for the individual bufferpools in the database.
Default Collection Interval — Every 15 minutes
Table 2-23 Bufferpool Performance Metrics
| Metric | Description and User Action |
|---|---|
|
Buffer Pool Name (key column) |
Name of the buffer pool. |
|
Individual Buffer Pool Hit Ratio (%) |
Buffer pool hit ratio, which equals: (1-((pool_data_p_reads + pool_index_p_reads)/ The required value can be set for the warning and critical thresholds to monitor any adverse conditions. |
|
Database Name |
Real name of the database for which information is collected or to which the application is connected. This is the name the database was given when created. |
|
Database Alias |
Alias for the database. |
|
Database Path |
Physical location of the database. |
|
Pool Asynchronous Data Reads |
Number of data pages read asynchronously to the buffer poll by prefetchers. |
|
Pool Asynchronous Index Reads |
Number of index pages read asynchronously to the buffer poll by prefetchers. |
|
Pool Asynchronous Index Writes |
Number of times a buffer pool index page was physically written to disk by either an asynchronous page cleaner or prefetcher. |
|
Pool Asynchronous Read Time (microseconds) |
Number of times a buffer pool data page was physically read from disk by an asynchronous page prefetcher. |
|
Pool Asynchronous Write Time (microseconds) |
Number of times a buffer pool index page was physically written to disk by either an asynchronous page cleaner or prefetcher. |
|
Pool Data Writes |
Number of times the buffer pool data page was physically written to the disk. |
|
Pool Index Writes |
Number of times the buffer pool index page was physically written to the disk. |
|
Logical Data Reads |
This count includes accesses to data that is already in the buffer pool when the database manager needs to process the page and read into the buffer pool before the database manager can process the page. |
|
Logical Index Reads |
Indicates the number of logical read requests to put index pages into the buffer pool. |
|
Physical Index Reads |
Indicates the number of physical read requests to put index pages into the buffer pool. |
|
Physical Data Reads |
Number of read requests that required I/O to put data pages into the buffer pool. |
|
Pool Read Time (microseconds) |
Provides the total amount of elapsed time spent processing read requests that caused data or index pages to be physically read from the disk to the buffer pool. |
|
Pool Write Time (microseconds) |
Total amount of time spent physically writing data or index pages from the buffer pool to the disk. |
2.6.4 Cache Performance
The metrics in this category provide performance information for the package and the catalog cache of the database.
Default Collection Interval — Every 15 minutes
Table 2-24 Cache Performance Metrics
| Metric | Description and User Action |
|---|---|
|
Database Name (key column) |
Real name of the database for which information is collected or to which the application is connected. This is the name the database was given when created. |
|
Catalog Cache Hit Ratio (%) |
Catalog cache hit ratio, which equals: 1-(cat_cache_inserts /cat_cache_lookups))*100 The hit ratio is a percentage indicating how well the catalog cache is helping to avoid actual accesses to the catalog on disk. A high ratio indicates it is successful in avoiding actual disk I/O accesses. |
|
Catalogue Cache Heapfull |
The number of times that an insert into the catalog cache failed due to a heap-full condition in the database heap. |
|
Catalog Cache Inserts |
Number of inserts performed. The hit ratio is 1-(CCI/CCL). |
|
Catalog Cache Lookups |
Number of times the catalog cache was referenced to obtain table description information. |
|
Catalog Cache Overflows |
Number of times that the catalog cache overflowed the bounds of its allocated memory. |
|
Package Cache Hit Ratio (%) |
Package cache hit ratio, which equals: 1-(pkg_cache_inserts /pkg_cache_lookups))*100 The hit ratio is a percentage indicating how well the package cache is helping to avoid reloading packages and sections for static SQL from the system catalogs as well as helping to avoid recompiling dynamic SQL statements. A high ratio indicates it is successful in avoiding these activities. |
|
Package Cache Inserts |
Number of inserts performed. The hit ratio is 1-(PCI/PCL). |
|
Package Cache Lookups |
Number of times the package cache was referenced to obtain a section or a package. |
|
Package Cache Max Used (Bytes) |
Largest size reached by the package cache. |
|
Package Cache Overflows |
Number of times that the package cache overflowed the bounds of its allocated memory. |
2.6.5 Log IO Performance
The metrics in this category provide performance information for the log input and output including the number of reads and writes in the logs.
Default Collection Interval — Every 15 minutes
Table 2-25 Log IO Performance Metrics
| Metric | Description |
|---|---|
|
Database Name (key column) |
Real name of the database for which information is collected or to which the application is connected. This is the name the database was given when created. |
|
Cleans Logging Threshold |
Number of times a page cleaner was invoked because the logging space used had reached a predefined criterion for the database. |
|
Log Reads |
Number of log reads. |
|
Log Writes |
Number of log writes. |
2.6.6 Memory Manager Performance
The metrics in this category provide the values of the workspace provided and the locklist set in the database.
Default Collection Interval — Every 15 minutes
Table 2-26 Memory Manager Performance Metrics
| Metric | Description |
|---|---|
|
Database Name (key column) |
Real name of the database for which information is collected or to which the application is connected. This is the name the database was given when created. |
|
Private Workspace Max Used |
Largest size that can be reached by private workspace. |
|
Shared Workspace Max Used |
Largest size that can be reached by shared workspace. |
|
Locklist Current Value |
Current value for the total amount of lock list memory that is in use. |
2.6.7 SortHeap Performance
The metrics in this category display the various performance values associated with the sortheap.
Default Collection Interval — Every 15 minutes
Table 2-27 SortHeap Performance Metrics
| Metric | Description and User Action |
|---|---|
|
Database Name (key column) |
Real name of the database for which information is collected or to which the application is connected. This is the name the database was given when created. |
|
Active Sorts |
Number of sorts in the database that currently have an allocated sort heap. |
|
Average Active Sorts Rate |
Rate of active sorts in the last interval, which equals: (active_sorts-_active_sorts )/__interval The required value can be set for the warning and critical thresholds to monitor any adverse conditions. |
|
Average Hash Join Overflow Rate |
Rate of hash join overflow in the last interval, which equals: (hash_join_overflow-_hash_join_overflow) /__interval The required value can be set for the warning and critical thresholds to monitor any adverse conditions. |
|
Average Hash Join Rate |
Rate of hash joins in the last interval, which equals: (total_hash_joins-_total_hash_joins )/__interval The required value can be set for the warning and critical thresholds to monitor any adverse conditions. |
|
Average Hash Join Small Overflow Rate |
Rate of the small hash join overflow in the last interval, which equals: (hash_join_small_overflow-_hash_join_small_overflow )/__interval The required value can be set for the warning and critical thresholds to monitor any adverse conditions. |
|
Average Hash Join Small Overflow Ratio |
Ratio of the small hash join overflow. |
|
Average Hash Loops Rate |
Rate of hash loops in the last interval, which equals: (total_hash_loops-_total_hash_loops)/ __interval The required value can be set for the warning and critical thresholds to monitor any adverse conditions. |
|
Average Piped Sorts Rejected Rate |
Rate of piped sorts rejection in the last interval, which equals: ((piped_sorts_requested-piped_sorts_accepted)-(_piped_sorts_requested-_piped_sorts_accepted)) /__interval The required value can be set for the warning and critical thresholds to monitor any adverse conditions. |
|
Average Post Threshold Joins Rate |
Rate of post threshold joins in the last interval, which equals: (post_threshold_ hash_joins-_post_threshold _hash_joins)/__interval The required value can be set for the warning and critical thresholds to monitor any adverse conditions. |
|
Average Post Threshold Sorts Rate |
Rate of post threshold sorts in the last interval, which equals: (post_threshold_sorts-_post_threshold_sorts ) /__interval The required value can be set for the warning and critical thresholds to monitor any adverse conditions. |
|
Average Sort Heap Pages Used |
Average sort heap space used, which equals: (sort_heap_allocated /active_sorts) The required value can be set for the warning and critical thresholds to monitor any adverse conditions. |
|
Average Sort Time (ms) |
Average time per sort, which equals: (total_sort_time/total_sorts) The required value can be set for the warning and critical thresholds to monitor any adverse conditions. |
|
Average Sorts Overflow Rate |
Rate of sort overflow in the last interval, which equals: (sort_overflow-_sort_overflow )/__interval The required value can be set for the warning and critical thresholds to monitor any adverse conditions. |
|
Average Sorts Overflow Ratio |
Ratio of sort overflow. |
|
Average Sorts Rate |
Rate of sorts in the last interval, which equals: (total_sorts-_total_sorts )/__interval The required value can be set for the warning and critical thresholds to monitor any adverse conditions. |
|
Piped Sorts Accepted |
Number of piped sorts that have been accepted. |
|
Piped Sorts Requested |
Number of piped sorts that have been requested. |
|
Post Threshold Hash Joins |
Total number of times that a hash join heap request was limited due to concurrent use of shared or private sort heap space. |
|
Post Threshold Sorts |
Number of sorts that have requested heaps after the sort heap threshold has been exceeded. |
|
Sort Heap Pages Allocated |
Total number of allocated pages of sort heap space for all sorts at the level chosen and at the time the snapshot was taken. |
|
Sort Overflows |
Total number of sorts than ran out of sort heap and may have required disk space for temporary storage. |
|
Total Hash Join Overflows |
Number of times that hash join data exceeded the available sort heap space. |
|
Total Hash Join Small Overflow |
Number of times that hash join data exceeded the available sort heap space by less than 10%. |
|
Total Hash Joins |
Total number of hash joins executed. |
|
Total Hash Loops |
Total number of hash loops executed. |
|
Total Sorts |
Number of sorts that have been executed. |
|
Total Sort Time (ms) |
Time spent in sorts. |
2.6.8 Non-Buffered I/O Performance
The metrics in this category display the various performance values related to the non-buffered I/O activities that do not use the buffer pool.
Default Collection Interval — Every 15 minutes
Table 2-28 Non-Buffered IO Performance Metrics
| Metric | Description |
|---|---|
|
Database Name (key column) |
Real name of the database for which information is collected or to which the application is connected. This is the name the database was given when created. |
|
Average Data Read Rate |
Direct read rate, which equals: direct_reads/direct_read_time The required value can be set for the warning and critical thresholds to monitor any adverse conditions. |
|
Average Direct Write Rate |
Direct write rate, which equals: direct_writes/direct_write_time The required value can be set for the warning and critical thresholds to monitor any adverse conditions. |
|
Direct Read Requests |
Number of requests to perform a direct read of one of more sectors of data. |
|
Direct Read Time (ms) |
Elapsed time in milliseconds required to perform the direct reads. |
|
Direct Reads |
Number of read operations that do not use the buffer pool. |
|
Direct Write Requests |
Number of requests to perform a direct write of one or more sectors of data. |
|
Direct Write Time (ms) |
Elapsed time in milliseconds required to perform the direct writes. |
|
Direct Writes |
Number of write operations that do not use the buffer pool. |
2.7 Response
The metrics in this category provide information about the response of the IBM DB2 database in the instance.
Default Collection Interval — Every 5 minutes
| Metric | Description |
|---|---|
|
Database Name |
Name of the database. |
|
DB Status |
Status of the database:
|
|
DB Status Value |
Status value of the database. |
|
DB2 Status |
Status value of the DB2 instance. |
|
DB2 Status Value |
Status of the DB2 instance:
|
|
Server Instance Name |
Database instance type. |
|
Status |
Status of the database. The database is up if the status is 0. Otherwise, it is down. |
2.8 Detailed Response
This metric category provides information about the response of the instance.
Default Collection Interval — Every 5 minutes
2.9 Storage Information
Storage Information metrics provide information about the storage objects, such as the tablespace and data files. Storage Information metrics consist of the following categories:
2.9.1 Data Files Storage
The metrics in this category provide information about the file properties for the database data storage files.
Default Collection Interval — Every 2 hours
Table 2-31 Data Files Storage Metrics
| Metric | Description |
|---|---|
|
Data File Identifier (key column) |
Unique identifier for the data file. |
|
Table Name |
Name of the particular table in the database where the file resides. |
|
Table Schema |
Schema of the table in which the file resides. |
|
Table Type |
Type of table to which the file belongs. |
|
Page Reorganizations |
Number of page reorganizations. |
|
Overflow Accesses |
Number of overflow accesses. |
2.9.2 Log Storage
The metrics in this category provide information about the log storage properties for the database.
Default Collection Interval — Every 30 minutes
Table 2-32 Log Storage Metrics
| Metric | Description and User Action |
|---|---|
|
Database Name (key column) |
Real name of the database for which information is collected or to which the application is connected. This is the name the database was given when created. |
|
Allocated Secondary Log Size |
Allocated size of the secondary log. |
|
Log Space Utilization (%) |
Space utilization of log files. |
|
Total Log Available (in 4Kb Pages) |
Total number of pages available for logging. |
|
Total Log Used (in 4Kb Pages) |
Total number of pages used for logging. |
2.9.3 Tablespace Storage
The metrics in this category provide information about the individual tablespace properties for all database tablespaces.
Default Collection Interval — Every 15 minutes
Table 2-33 Tablespace Storage Metrics
| Metric | Description |
|---|---|
|
Tablespace Identifier (key column) |
Identifier for the tablespace. |
|
Tablespace Name (key column) |
Name of the tablespace. |
|
Bufferpool Identifier |
Bufferpool identifier for the tablespace. |
|
Extent Size |
Extent size for the tablespace. |
|
Number of Containers |
Number of containers. |
|
Number of Ranges |
Number of ranges. |
|
Page Size |
Page size for the tablespace. |
|
Prefetch Size |
Prefetch size for the tablespace. |
|
Tablespace Free Pages |
Number of pages in a tablespace that will become free if all pending transactions are committed or rolled back, and new space is requested for an object. |
|
Tablespace State |
State of the tablespace. |
|
Tablespace Total Pages |
Total number of pages in a tablespace. |
|
Tablespace Type |
Type of tablespace. |
|
Tablespace Usable Pages |
Total number of pages in a tablespace minus overhead pages. |
|
Tablespace Used Pages |
Total number of pages currently used (not free) in a tablespace. |
|
Tablespace Utilization (%) |
Tablespace utilization in percentage. |
2.10 System Configuration Information
System Configuration Information metrics collect the information related to the database software. Each installation of the database software provides an instance to store the data. System Configuration Information metrics consist of the following categories:
2.10.1 Database System Information
The metrics in this category provide information about the various system configuration metrics for the database system, including the name and operating system properties.
-
Table Name — MGMT_EMX_IBMDB2_DBSYS
-
View Name — MGMT_EMX_IBMDB2_DBSYS_VIEW
Default Collection Interval — Every 24 hours
Table 2-34 Database System Information Metrics
| Metric | Description |
|---|---|
|
Server Name |
Name of the database server. |
|
OS Type |
Type of the operating system. |
|
OS Version |
Version of the operating system. |
|
OS Release |
Release of the operating system. |
|
Total Number of CPUs |
Total number of CPUs for the operating system on which the database is installed. |
|
Total Number of Configured CPUs |
Total number of configured CPUs on which the database is installed. |
|
Total Memory (mb) |
Amount of memory. |
2.10.2 Instance Information
The metrics in this category return the parameters that provide information about database instances.
-
Table Name — MGMT_EMX_IBMDB2_DBINST
-
View Name — MGMT_EMX_IBMDB2_DBINST_VIEW
Default Collection Interval — Every 24 hours
Table 2-35 Instance Information Metrics
| Metric | Description |
|---|---|
|
Instance Name (key column) |
Name of the instance. |
|
Number of DB Partitions |
Number of database partitions. |
|
Bit Size of Current Instance |
Bit size of the current instance (32 or 64). |
|
Release Number |
Internal release number, as returned by the db2level command; 9 for example, 03030106. |
|
Service Level |
Service level, as returned by the db2level command; for example, DB2 v8.1.1.80. |
|
Build Level |
Build level, as returned by the db2level command; for example, n041021. |
|
Program Temporary Fix |
Program temporary fix (PTF) identifier, as returned by the db2level command; for example, U498350. |
|
Fix Pack Number |
FixPak number, as returned by the db2level command. |
2.10.3 Product Information
The metrics in this category provide information about the installed IBM DB2 database product.
-
Table Name — MGMT_EMX_IBMDB2_DBPRO
-
View Name — MGMT_EMX_IBMDB2_DBPRO_VIEW
Default Collection Interval — Every 24 hours
2.10.4 Partition Information
The metrics in this category return parameters about parallel operations and partitioned database environments.
-
Table Name — MGMT_EMX_IBMDB2_DBPART
-
View Name — MGMT_EMX_IBMDB2_DBPART_VIEW
Default Collection Interval — Every 24 hours
Table 2-37 Partition Information Metrics
| Metric | Description |
|---|---|
|
Partition Number (key column) |
Partition number where the database is installed. |
|
Host Name |
Host name of the machine where the db2 database software is installed. |
|
Logical Port |
TCP/IP port number to communicate with the database. |
|
Switch Name |
Name of the switch where the database is connected. |
2.10.5 Registry Settings
The metrics in this category provide information about the various registry parameters for the database.
-
Table Name — MGMT_EMX_IBMDB2_DBREGSET
-
View Name — MGMT_EMX_IBMDB2_DBREGSET_VIEW
Default Collection Interval — Every 24 hours
Table 2-38 Registry Settings Metrics
| Metric | Description |
|---|---|
|
Database Registry Variable (key column) |
Name of the DB2 registry variable. |
|
Current Value |
Current setting of the DB2 registry variable. |
|
Is Aggregate |
Indicates whether or not the DB2 registry variable is an aggregate variable. Possible return values are 0 if it is not an aggregate variable, and 1 if it is an aggregate variable. |
|
Aggregate Name |
Name of the aggregate if the DB2 registry variable is currently getting its value from a configured aggregate. If the registry variable is not being set through an aggregate, or is set through an aggregate but has been overridden, the value of AGGREGATE_NAME is NULL. |
|
Level |
Values are: Instance — If level1_raw = I Otherwise, the value is Environment. |
2.11 DB2 Diag Log File Monitoring
The metrics in this category provide information about the IBM DB2 database Diagnostic Log file.
Note:
This metric category is supported only for local monitoring, that is, when the IBM DB2 database on a host is monitored by an Oracle Management Agent that is running on the same host.Default Collection Interval — Every 5 minutes
Table 2-39 DB2 Diag Log File Monitoring Metrics
| Metric | Description |
|---|---|
|
Log File Match Count |
Number of times a pattern was found in the log file. |
|
Server |
Name of the server where IBM DB2 is running. |
|
Instance |
Name of the IBM DB2 instance. |
|
DB |
Name of the IBM DB2 database. |
|
Function |
Name of the function present in the last log entry. |
|
Last Occurrence Time Stamp |
Time of the last log entry that shares a common function name with other entries that satisfy a particular pattern. |
|
Message |
Message present in the log file. |
2.12 HADR Status Metrics
The metrics in this category provide details about the HADR and HADR cluster status and configuration.
Default Collection Interval — Every 30 minutes
Table 2-40 HADR Status Metrics
| Metric | Description |
|---|---|
|
Database Name |
Database Name monitor element |
|
HADR Connect Status |
Text identifier detailing the status of the HADR connection:
|
|
HADR Connect Time |
The last time the connect status changed (the time it first became congested or disconnected). |
|
HADR Heartbeat |
The number of missed heartbeats on the HADR connection. Typically, the higher the value, the worse the condition. |
|
HADR Local Host |
The number of missed heartbeats on the HADR connection. Typically, the higher the value, the worse the condition. |
|
HADR Local Service |
The number of missed heartbeats on the HADR connection. Typically, the higher the value, the worse the condition. |
|
HADR Primary Log File |
The number of missed heartbeats on the HADR connection. Typically, the higher the value, the worse the condition. |
|
HADR Primary Log LSN |
The current log position of the primary HADR database. The log sequence number (LSN) is a byte offset in the database log stream. |
|
HADR Primary Log Page |
The current page number in the current log file |
|
HADR Remote Host |
The remote host name |
|
HADR Remote Instance |
The remote HADR instance name |
|
HADR Remote Service |
The remote HADR service name |
|
HADR Role |
Text identifier detailing the role of the monitored database. Possible values are:
If the role is standard, then ignore all other metrics |
|
HADR Standby Log |
The current log file on the standby HADR database. |
|
HADR State |
Text identifier detailing the state of HADR. Possible values are:
|
|
HADR Sync Mode |
Text identifier detailing sync mode. Possible values are:
|
|
HADR Timeout |
The number of seconds before the HADR Database Server considers that a communication attempt has failed, |
2.13 Top Statements by CPU Time Metrics
The metrics in this category provide details about the SQL statements that use the most processor time.
Default Collection Interval - Every 30 minutes
Table 2-41 Top Statements by CPU Time Metrics
| Metric | Description |
|---|---|
|
Statement Hash |
A hash of the SQL statement text. |
|
Statement |
The SQL statement executed. |
|
Total CPU Time (s) |
The amount of time the statement was executing while Enterprise Manager collected data. |
|
CPU Time per hour (s) |
The average amount of time the statement is executing, per hour. |
2.14 Top Statements by Execution Count Metrics
The metrics in this category provide details about the SQL statements that are executed most frequently.
Default Collection Interval - Every 30 minutes
Table 2-42 Top Statements by Execution Count Metrics
| Metric | Description |
|---|---|
|
Statement Hash |
A hash of the SQL statement text. |
|
Statement |
The SQL statement executed. |
|
Total Execution Count |
The number of times the statement executed while Enterprise Manager collected data. |
|
Total Execution Count per Hour |
The average number of times the statement executes, per hour. |
2.15 Lock Waits Metrics
The metrics in this category provide information about database locks.
Default Collection Interval - Every 30 minutes
| Metric | Description |
|---|---|
|
Lock Request Agent ID |
The ID of the agent waiting on a lock. |
|
Lock Name |
The name of the lock being waited on. |
|
Lock Object Type |
The object type of the lock being waited on. |
|
Locked Schema |
The schema containing the locked table. No value if the lock does not reference a table. |
|
Locked Table |
The locked table being waited on. No value if the lock does not reference a table. |
|
Lock Wait Duration (s) |
The time, in seconds, this agent has been waiting for access. |
|
Application Requesting Lock |
The name of the application wanting to acquire the lock. |
|
User Requesting Lock |
The authorization ID of the session that wants to acquire the lock. |
|
Application Holding Lock |
The application holding the lock blocking access. |
|
User Holding Lock |
The authorization ID of the session holding the lock blocking access |
|
SQL Statement Requesting Lock |
The SQL statement text being executed by the application requesting the lock. Only available on on versions of DB2 9.7 and later. |
|
SQL Statement Holding Lock |
The SQL statement text associated with the application holding the lock. This is not necessarily the statement responsible for the lock. Only available on versions of DB2 9.7 and later. |
2.16 Lock Waits by Table Metrics
The metrics in this category describe the tables being most waited on.
Default Collection Interval - Every 30 minutes
2.17 Lock Waits by Blocked Application Metrics
The metrics in this category describe the applications that are waiting the longest for locks.
Default Collection Interval - Every 30 minutes
2.18 Lock Waits by Blocking Application Metrics
The metrics in this category describe the applications that are holding a lock on which other applications are waiting.
Default Collection Interval - Every 30 minutes