18 Monitoring Business Applications
This chapter describes how you use Oracle Enterprise Manager to monitor Business Application performance.
A Business Application is an Enterprise Manager target that represents a logical application; for the user, it defines a unit of management. A Business Application is composed of RUEI applications and BTM transactions. Using the Enterprise Manager Console, you view a Business Application to access RUEI and BTM performance data as well as information about the application's supporting infrastructure: the hosts and servers where the application services are executing.
You cannot use Enterprise Manager to create RUEI applications and BTM transactions. That work must be done using the RUEI and BTM stand-alone products, which were introduced in previous chapters. You must complete the steps described in "Setting up End-to-end Monitoring," to be able to set up Business Application monitoring. You must also complete the tasks described in Section 18.2, "Prerequisites and Considerations."
This chapter covers the following:
18.1 Introduction to Business Applications
By using Oracle Enterprise Manager to monitor your Business Applications, you can make sure that your applications are performing at their peak and that end users are satisfied with their performance.
The use of Business Applications offers a number of significant advantages over traditional IT-centric approaches that only focus on system health issues. In particular, Business Applications:
-
Allow you to manage your applications in their business context, measuring, and alerting on the basis of the end-users' experience.
-
Provide customizable dashboards with complete visibility across multi-tier composite applications.
-
Provide a visualization of all target relationships within a business service.
18.1.1 Systems, Services, Business Applications, and Key Components
Within Oracle Enterprise Manager, there are two types of targets: systems and services. A service target represents some functionality provided or supported by a system. A Business Application is a service target. Hence, when you create a business application, you must associate it with a system that represents the infrastructure that supports the service functionality.
Consider an example business application that contains an order entry application implemented by a collection of physical (system) resources. The application is deployed in a Web Logic domain modeled as a system target whose members are the individual managed servers. The Business Application could include transactions deployed in containers. Each of these containers is an application server, possibly within a single Web Logic domain. In this case, the Web Logic domain is the system target. (In the case that the transaction spans multiple domains, it is recommended that you create a composite application within Oracle Enterprise Manager.)
You specify which key components within the system target should be monitored to determine the business application's availability. For instance, for a transaction, the key components will be the servers where the services that comprise the transaction are running.
System monitoring provides insights into the behavior of the monitored application infrastructure. It collects metrics and reports on the health of all components from the hosts to the application servers and the deployed Java EE applications. It also provides deep-dive diagnostics tools for the application servers and the databases.
18.1.2 MyBank: An Example Business Application
To illustrate the nature of a Business Application, consider the situation in which end users access a banking application (MyBank) that allows them to perform such tasks as the payment of bills. This business application is delivered through the infrastructure shown in Figure 18-1.
The end-user experience of the MyBank business application is monitored through RUEI, while Key Performance Indicators (KPIs) are used to monitor its key aspects, such as the availability and performance of the logon page, and the number of errors in transfer responses and online payments.
BTM monitors the performance of the services and transactions deployed within the application environment used to deliver the business application. This is done by tracking each transaction as its execution progresses through the different tiers of the application. This is complemented by the ability to perform root-cause analysis to locate bottlenecks, errors, and incomplete transaction instances.
Figure 18-1 The MyBank Business Application
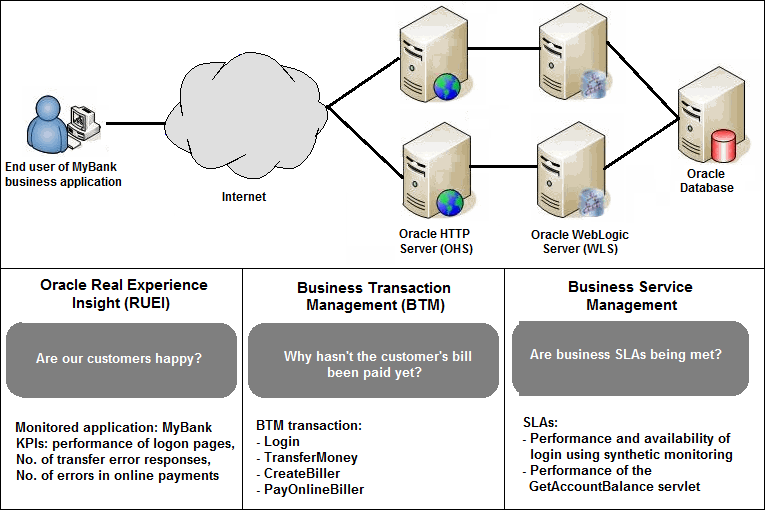
Description of "Figure 18-1 The MyBank Business Application"
Proactive application monitoring is achieved by defining business objectives that set acceptable levels of performance and availability. Within Oracle Enterprise Manager, these business objectives are referred to as Service Level Agreements (SLAs) and are composed of Service Level Objectives (SLOs) that measure specific metrics.
Insight into each of these key aspects of a business application's operation and delivery is available through a number of dedicated regions of the Oracle Enterprise Manager console.
18.2 Prerequisites and Considerations
This section describes the requirements that must be met and the issues that should be considered to use the Business Applications facility. It is strongly recommended that you carefully review this information before proceeding with the creation of business applications.
Important:
It is recommended that you review the My Oracle Support website to obtain up-to-date information about the supported RUEI and BTM products, as well as patches, configurations, known issues, and workarounds.This section covers the following:
18.2.1 Requirements for Using RUEI
To use RUEI to monitor the performance of your Business Applications, you must ensure that the following requirements have been met:
-
RUEI version 12.1.0.6 (or higher) has been installed and configured to monitor the required applications, suites, and services. Information about deployment options and requirements is available from the Oracle Real User Experience Insight Installation Guide.
-
The Enterprise Manager for Oracle Fusion Middleware plug-in must be deployed to both Oracle Management Service (OMS) and to each Management Agent monitoring the business application targets.
For details on deploying the plug-in to OMS, see the "Deploying Plug-Ins to Oracle Management Service" chapter in the Enterprise Manager Cloud Control Administrator's Guide:
http://docs.oracle.com/cd/E24628_01/doc.121/e24473/plugin_mngr.htm#CJGCDHFGFor details on deploying the plug-in to a Management Agent, see the "Deploying Plug-Ins on Oracle Management Agent" chapter in the Enterprise Manager Cloud Control Administrator's Guide:
http://docs.oracle.com/cd/E24628_01/doc.121/e24473/plugin_mngr.htm#CJGBIAGJ -
The Reporter system must be accessible to Oracle Enterprise Manager via an HTTPS connection on port 443. Other component host systems (such as Collector, Processing Engine, and database servers) do not need to be accessible to Oracle Enterprise Manager unless you intend to make them managed targets (see Section 18.3, "Registering RUEI/BTM Systems").
-
The statistics data retention setting (which governs the availability of statistical information such as violation counters) has been configured to be consistent with your business application reporting requirements. The procedure to do this is described in the Oracle Real User Experience Insight User's Guide.
-
If you intend to export session information from the Session Diagnostics facility, you should ensure that the exported session is not older than the period specified for the Full Session Replay (FSR) data retention setting. In addition, the URL prefix masking setting should be specified as "Complete logging". For more information, see the Oracle Real User Experience Insight User's Guide.
18.2.1.1 Registering RUEI Installations with Self-Signed Certificates
A RUEI installation can use a self-signed certificate. This is explained in the Oracle Real User Experience Insight Installation Guide. However, Oracle Enterprise Manager only accepts SSL certificates issued by a trusted Certificate Authority (CA), and that contain a valid Common Name (CN). Therefore, in order to be able to register a RUEI installation with Oracle Enterprise Manager, you need to do the following:
Note:
All instructions on the Oracle Enterprise Manager system need to be carried out as the user running the oms and agent.-
Verify that the certificate is valid. One way to do this is to attempt to access the Oracle Real User Experience Insight system through a browser via HTTPS and view the certificate details. You should ensure the certificate' s date validity. If the certificate's date range does not include the period your Oracle Real User Experience system is running, you will not be able to use it.
-
Download the certificate to your Oracle Enterprise Manager system. Many browsers provide an option when creating a security exception for a self-signed certificate to also save the certificate to a file. If you have already approved the security exception in your browser, the following example works in Mozilla Firefox:
-
Click the security icon to the left of the hostname
-
Click More information, then click View certificate
-
Select the Details tab and click Export
The exported file should be copied to your system running Enterprise Manager. The examples below assume that you stored the file containing the certificate in ~/ruei.cert.
A more direct way to download the certificate to your Oracle Enterprise Manager system can be carried out on the system itself. Issue the following commands on the Oracle Enterprise Manager system:
openssl s_client -showcerts -connect <RUEI_REPORTER_HOST>:443 </dev/null \ | openssl x509 -inform PEM > ~/ruei.cert -
-
Add the certificate to the keystore. Within Oracle Enterprise Manager, two components are used to communicate with a RUEI system via SSL: one for polling the status of RUEI, and one for the communication with RUEI. Both keystores need to contain the same certificate. Issue the following commands on the Oracle Enterprise Manager system:
Agent:
cd <agent instance home>/bin
./emctl secure add_trust_cert_to_jks \
[-password <keystore password, default "welcome">] \
-trust_certs_loc ~/ruei.cert -alias <unique alias>
OMS
<path_to_Oracle_WT>/jdk/bin/keytool -import \
-keystore <path_to_wlserver_10.3>/server/lib/DemoTrust.jks \
-file ~/ruei.cert -alias <unique alias> -storepass DemoTrustKeyStorePassPhrase
-
In order for Oracle Enterprise Manager to work with the new certificate, perform a bounce of the OMS and the AGENT. Issue the following commands:
<OMS oracle home>/bin/emctl stop oms -all
<OMS oracle home>/bin/emctl start oms
<AGENT oracle home>/bin/emctl stop agent
<AGENT oracle home>/bin/emctl start agent
18.2.2 Requirements for Using BTM
To use BTM to monitor the performance of your business applications, you must ensure that the following requirements have been met:
-
BTM version 12.1.0.6 (or higher) has been installed and configured. Installation and configuration instructions are provided in the Oracle Business Transaction Management Installation Guide.
-
The server where the central BTM server is deployed must be accessible to the Oracle Management Server (OMS) on the port where the BTM system's managed server is listening.
-
The business transactions you intend to monitor via the Business Application facility have been defined using the BTM user interface. The procedure for doing this is described in the Business Transaction Management Online Help.
18.3 Registering RUEI/BTM Systems
Before you can create Business Applications based on RUEI-monitored applications and services, or BTM-monitored transactions, you must first register the appropriate RUEI or BTM system with Oracle Enterprise Manager.
Note:
You must have Super Administrator privileges in order to access the Application Performance Management page.Do the following:
-
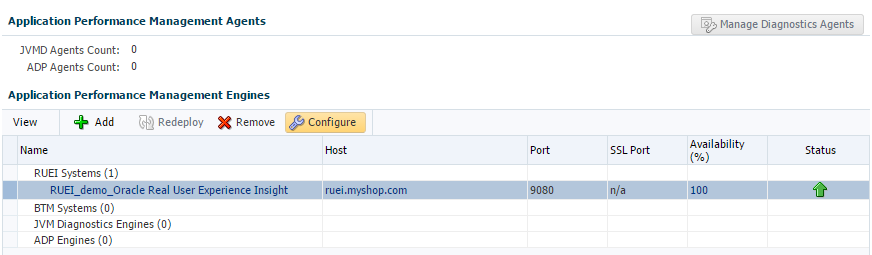
From the Setup menu, select Middleware Management, then select Application Performance Management. The Application Performance Management page shown in Figure 18-2 appears. The currently registered systems are listed.
Figure 18-2 Application Performance Management Agents
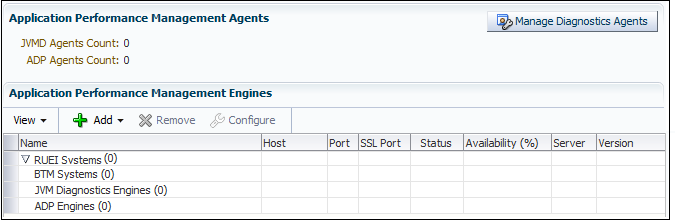
Description of "Figure 18-2 Application Performance Management Agents"
-
Select Real User Experience Insight System or Business Transaction Management System from the Add drop down. A page similar to the one shown in Figure 18-3 appears.
Note:
Release 12.1.0.6 of Oracle Fusion Middleware Management Plug-in allows you to register more than one RUEI system. Previous releases of Oracle Fusion Middleware Management Plug-in prompted you to remove the existing target if you attempted to register a second RUEI system. -
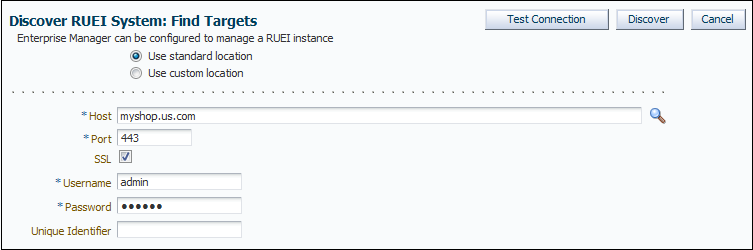
Specify whether the RUEI or BTM system is running in a standard or custom location.
-
Specify the host system where the Reporter system or BTM Sphere is located. Click Select Target. A new window opens that allows you to view the available systems. You can use the Target Type menu to search for specific target types.
-
Specify the port number for communication with the RUEI Reporter or BTM Sphere, for example 443.
-
Specify a secure connection for communication with the RUEI Reporter or BTM Sphere. Only use an insecure connection for testing purposes.
-
Specify a valid user name and password combination. For a RUEI system, the specified user must have Oracle Enterprise Manager access permissions. Note that Oracle SSO authentication for this user is not supported. The Security Officer privilege is also recommended to allow downloading of sessions and the showing of replay details in the Enterprise Manager UI. With this in place, Enterprise Manager will be able to retrieve this data. Moreover, additional (per-end-user) Enterprise Manager roles will be applied to reveal session-zip download and content-download buttons.
-
Optionally, specify a string to be attached to the RUEI/BTM system name. For example, if "SanitySite" is specified, then each of the system's component names will be prefixed with "SanitySite_", creating system names such as "SanitySite_BTM_System".
-
In the case of a custom location, specify the full URL of the WSDL RUEI/BTM discovery service. In the case of a BTM system, this should be in the following form:
http://host:port/btmcentral/sphere/discoveryService/?wsdl
In the case of a RUEI instance, this should be in the following form:
http://host:port/ruei/service.php?endPoint=uxDiscoveryService&wsdl
-
Specify the URL of the Management Agent to be used to collect metric information about the system. If it is managed by Oracle Enterprise Manager, you can click Select to specify it.
-
Click Test Connection to verify whether a working connection to the RUEI/BTM system can be made.
Note:
A secure connection to a RUEI installation fails if you have not completed the process described in "Registering RUEI Installations with Self-Signed Certificates". -
Click Discover. An overview of the components associated with the selected system is displayed. An example is shown in Figure 18-4.
Figure 18-4 Discover RUEI Instance: View Targets Page
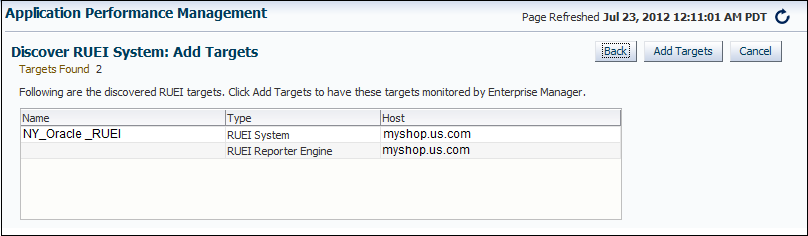
Description of "Figure 18-4 Discover RUEI Instance: View Targets Page"
For RUEI systems, you also need to enter credentials to enable incident communication from RUEI in a section of the screen labelled Edit Incident Alert Credential:
-
Confirm the connection information for the EM Repository connection information. By default, the credentials for the Enterprise Manager repository are entered into the appropriate fields.
Note:
The RUEI system must have access to the port specified in this section to communicate with the Enterprise Manager repository. -
Enter the details for the Oracle EM Repository Credentials. In this section, enter the Super Administrator's username (typically
sysman) and password.Note:
The Test button in this section only tests that you have entered a valid username/password. It does not test whether that user has the required privilege. -
Enter the values for the Oracle RUEI Wallet Credentials. After entering the password twice, save this credential with a meaningful name so that you can recognise it if you require it later. Note that the default value will not be accepted, because it contains the
<and>characters.
-
-
Click Add Targets to have each of the system's components become a managed target within Oracle Enterprise Manager. Note that if you do so, each system must be accessible to a Management Agent. Further information about managed targets is available from the Oracle Enterprise Manager Cloud Control Administrator's Guide. If you need to edit any of the credentials you specified above, you can select the target and click the Configure button to display a screen that will allow you edit the values.
18.3.1 Setting Up a Connection Between RUEI and the Oracle Enterprise Manager Repository
The following procedure describes setting up a connection so that KPIs from RUEI can be monitored by one or more Oracle Enterprise Manager instances. This procedure can be used for the following situations:
-
Initial setup of KPIs
-
After a changing Enterprise Manager hostname
-
After a changing the sysman user credentials
-
After changing the TNS settings of the Enterprise Manager database
-
Correcting issues with initial KPI setup
-
From the Setup menu, select Middleware Management, then select Application Performance Management. The Application Performance Management page shown in Figure 18-5 appears. The currently registered systems are listed.
Figure 18-5 Application Performance Management Engines
Description of "Figure 18-5 Application Performance Management Engines"
-
Select the RUEI system you would like to set up and click Configure. The RUEI Setup Page appears.
-
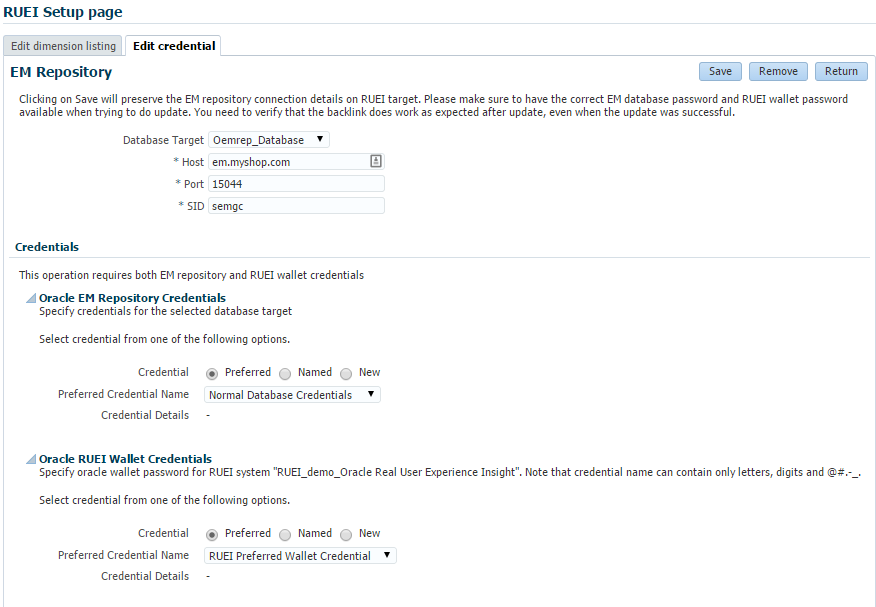
Select the Edit credential tab and click edit. The RUEI Setup page shown in Figure 18-6 appears. Enter the appropriate EM repository credentials. You also need to enter the RUEI wallet password, this is typically specified while setting up the RUEI repository.
-
On the RUEI host, configure RUEI to use the mkstore utility:
-
Determine the location of the mkstore utility. This utility is included with the Oracle Database and Oracle Client runtime. In both cases, it is located in
$ORACLE_HOME/bin. -
Edit the
/etc/ruei.conffile and add the following line, where mkstore_location is the path determined in the step above:export MKSTORE_BIN=mkstore_location -
Restart RUEI by selecting System, then Maintenance, and then System reset. Select Reapply latest configuration option and click Next to apply the changes you have made.
Note:
This step is valid for RUEI release 12.1.0.6. For other releases, check Appendix D Setting up a Connection to the Enterprise Manager Repository of the Oracle Real User Experience Insight Installation Guide.
-
18.4 Creating Business Applications
To create a Business Application, you need to specify the RUEI-monitored applications, suites, and services, and the BTM-monitored transactions upon which it is based. You are not required to include both RUEI applications and BTM transactions in a Business Application.
Do the following:
-
From the Targets menu, select Business Applications. The currently defined Business Applications are displayed. The page (partially) shown in Figure 18-7 appears.
-
Click Create. The page shown in Figure 18-8 appears.
Figure 18-8 Create Business Application (Name) Page
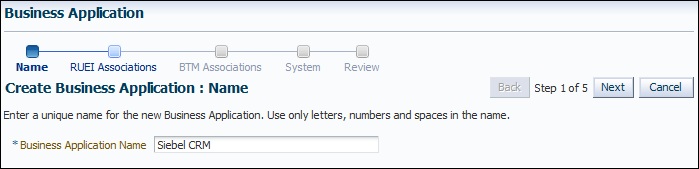
Description of "Figure 18-8 Create Business Application (Name) Page"
-
Specify a unique name for the new business application. It is recommended that you include an indication of the purpose and scope of the business application as part of the name. Do not accept the default name, which is invalid if it contains either of the
<or>characters. Note that business applications cannot be renamed later. When ready, click Next. The page shown in Figure 18-9 appears.Figure 18-9 Create Business Application (RUEI Associations) Page
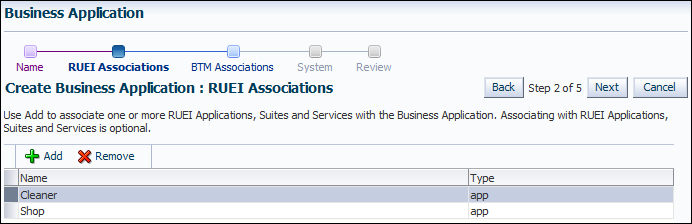
Description of "Figure 18-9 Create Business Application (RUEI Associations) Page"
-
Click Add. A new window opens that allows you to select the RUEI-monitored applications, suites, and services upon which the business application should be based. You can use the Type menu to restrict the listing to specific types. You can multi-select from the list of all the applications, suites, and services associated with a selected RUEI system. When ready, click Next. The page shown in Figure 18-10 appears.
Figure 18-10 Create Business Application (BTM Associations) Page
Description of "Figure 18-10 Create Business Application (BTM Associations) Page"
-
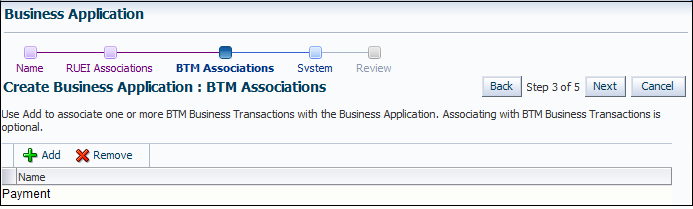
Click Add. A new window opens that allows you to select the BTM-monitored transactions upon which the business application should be based. When ready, click Next. The page shown in Figure 18-11 appears.
Figure 18-11 Create Business Application (System) Page
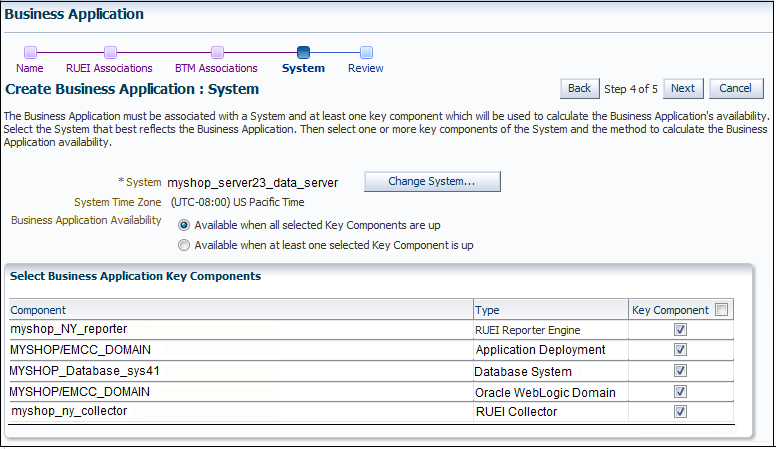
Description of "Figure 18-11 Create Business Application (System) Page"
-
Click Select System and select the system that hosts the business application. This should be a system that encompasses the infrastructure that the business application runs on.
Use the Key Component check boxes to select the system members used in the calculation of the business application's availability. Two rules are available: either all specified key components for a business application must be up, or at least one of them must be up (the default). When ready, click Next. The page shown in Figure 18-12 appears.
Figure 18-12 Create Business Application (Review) Page
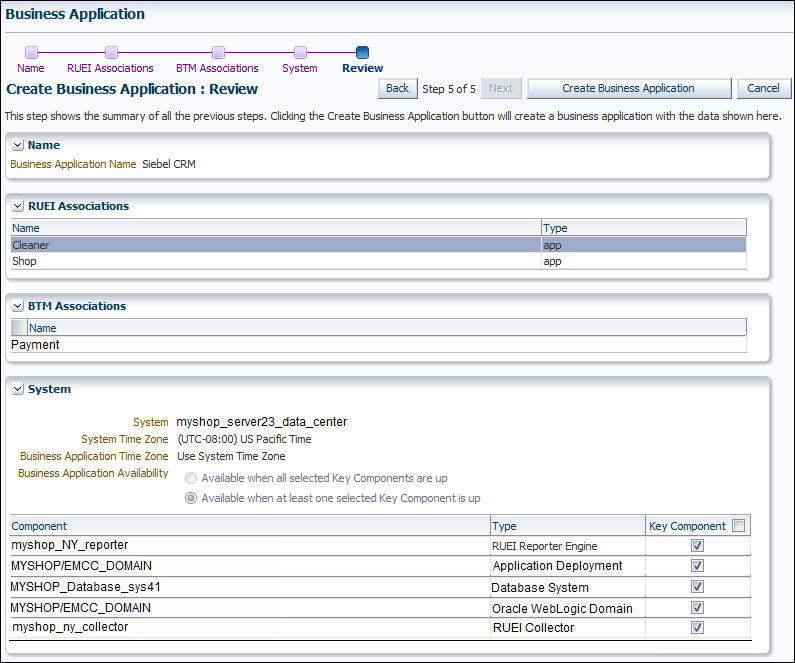
Description of "Figure 18-12 Create Business Application (Review) Page"
-
Review the new business application's properties before creating it. If necessary, use the Back and Next buttons to amend its properties. When ready, click Create Business Application. The newly created Business Application appears on the Business Application page (Figure 18-7).
18.5 Monitoring Business Applications
Once a Business Application has been created, you can use the Business Application home page to monitor its performance and availability, as well as the status of the systems (hosts, databases, and middleware components) that support it.
It is also from the Business Application home page that you can access more detailed information about RUEI components and Business Transactions:
-
To get more information about RUEI components, select one of the RUEI related views from the Business Application drop down menu. See "Monitoring RUEI Options."
-
To get more information about Business Transactions, select one of the transactions listed in the Business Transaction region.
-
If there are timeout issues associated with monitoring the Business Application, you can set the APM_WEBSERVICE_CREATE_TIMEOUT system property in the Enterprise Manager WebLogic configuration to a value appropriate to your network configuration, for example 60 seconds.
To view the Business Application home page, do the following:
-
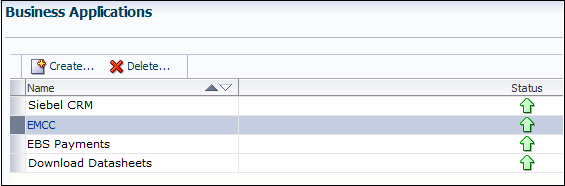
From the Targets menu, select Business Applications. The currently defined business applications are listed. An example is shown in Figure 18-7.
In addition to the names of existing Business Applications, this page also provides summary information about status, system, RUEI metrics, and RUEI KPIs. Use the View > Columns menu option to add or delete columns to this display.
You can also click across to view information about system targets by clicking on one of the names listed in the System pane.
-
Click the Business Application of interest. The home page for the selected Business Application is displayed. An example is shown in Figure 18-13.
Each region provides specific information on the various operational aspects of the selected business application. By default, the following regions are available:
-
General: indicates the business application's status and availability. Click the Availability (%) item to view a history of its status for the selected time period.
-
System Status: indicates the system's availability over the last 24 hours. The Most Affected Members are shown next, with an indication whether the member has been defined as a key variable in determining availability.
-
Incidents and Problems Overview: indicates the number of outstanding critical, warning, and error alerts associated with various aspects of the selected business application.
-
Business Transactions: lists the business transactions included in the Business Application. The use of this region is explained in Section 18.8, "Monitoring BTM Transactions in Enterprise Manager".
-
RUEI - Key Performance Indicators (KPI): indicates the status of the KPIs associated with the business application's targets.
-
Service Test Status: indicates the status and history of Service Tests.
-
SLA Status: indicates the Service Level Agreements defined for this Business Application. For more information about defining Service Level Agreements, see Oracle® Enterprise Manager Cloud Control Administrator's Guide.
18.6 Monitoring RUEI Options
The Business Application drop down menu, accessible from the Business Application home page, includes three options for the Real User Experience (RUEI) item:
-
Real User Experience (RUEI) data, whose contents are described in "Monitoring RUEI Data."
-
RUEI Session Diagnostics, whose contents are described in "Working With Session Diagnostics."
-
RUEI Metrics, whose contents are described in "Monitoring RUEI Metrics."
18.6.1 Monitoring RUEI Data
Selecting the RUEI Data option from the Business Application > Real User Experience menu, displays a region that includes four tabs. This section describes the contents of each tab.
18.6.1.1 RUEI Key Performance Indicators Tab
The RUEI Key Performance Indicators tab displays information about key aspects of the RUEI application, suite, or service upon which the business application is based. For example, you could have KPIs defined for such things as availability, performance, and visitor traffic. An example is shown in Figure 18-14.
Understanding Report Metric Values
A KPI's metric value is always calculated over a 1-minute interval. That is, the metric's value is derived from its average value over that 1-minute period. Within the RUEI instance's configuration, The KPI calculation range specifies how many of these 1-minute period averages should be used when calculating the metric's reported value. By default, the calculation range is one minute. However, a longer calculation range can be specified if you want extreme values to be averaged out over a longer period. For example, if a calculation range of 10 minutes is specified, the metric's value over each reported 1-minute period is calculated based on the averages for the previous 10 1-minute periods. Similarly, a calculation range of 15 minutes would specify that the reported value should be derived from the averages for the last 15 1-minute periods.
In addition to fixed targets, KPIs can be based on automatic (or auto-learnt) targets. Because visitor traffic and usage patterns can differ widely during the course of a day, these auto-learnt minimum and maximum targets are calculated as moving averages for the current 1-minute period, based on the measured metric value for that 1-minute period over the last 30 days. For example, when a KPI metric is measured at 10.45 AM, the average against which it is compared is calculated from the last 30 days of measurements at 10.45 AM. The minimum and maximum targets can be defined in terms of small, medium, or large deviations from these moving averages. In contrast, a fixed KPI target essentially represents a straight line, as either a minimum or maximum. This is shown in Figure 18-15.
Figure 18-15 Automatic and Fixed KPI Targets Contrasted
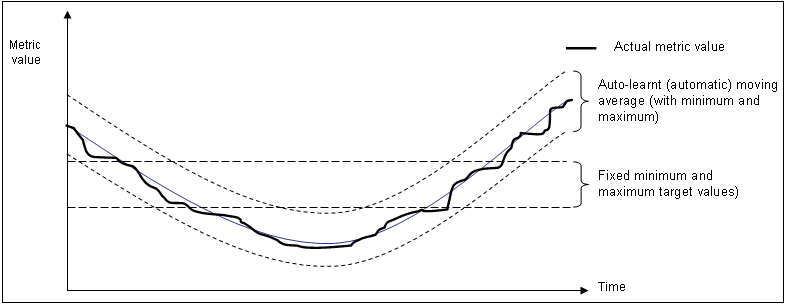
Description of "Figure 18-15 Automatic and Fixed KPI Targets Contrasted"
Optionally, KPIs can be configured within RUEI to generate alerts when they move outside their defined boundaries. If enabled, the configuration defines the duration the KPI must be down before an alert is generated, the severity of the reported incident, and whether an additional notification should be generated when the KPI has returned to its defined boundaries. The reporting of these alerts is described in Section 18.7, "Monitoring KPI and SLA Alert Reporting".
18.6.1.2 Usage Data Tab
The Usage Data tab displays information about the top executed user requests and about the top users.
The Top Executed User Requests display, is shown in the next figure. This region enables you to view the most frequent user requests and actions, and their impact on the business application. These actions can be specific page names, or combinations of suite-specific dimensions (such as Siebel screen, module, and view names).
The Top Users region enables you to monitor the most active users of the targets associated with the business application. This includes session and page view information, as well as user and application violation indicators. An example is shown in Figure 18-17.
Use this region to verify the performance of the most popular user requests associated with a business application (such as downloads or payment handlings).
Selecting a user opens the RUEI Session Diagnostics facility and displays detailed information about the selected user. For more information, see Section 18.6.2, "Working With Session Diagnostics").
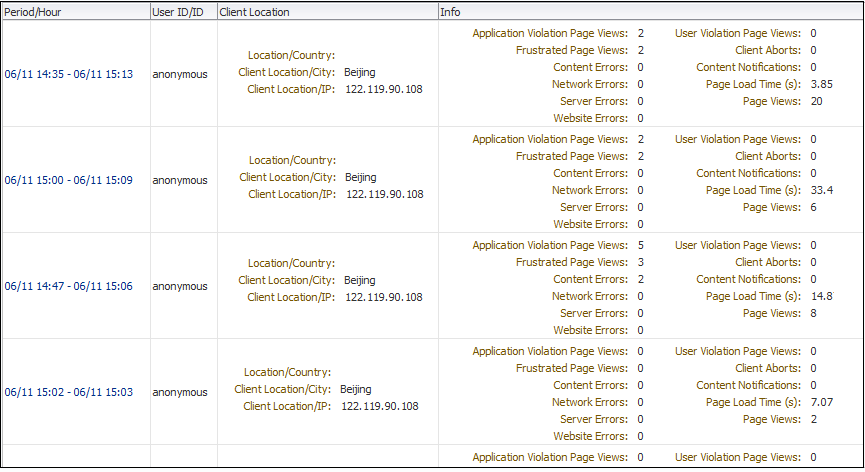
18.6.1.3 Violations Data Tab
The Violations Data tab enables you to examine the suite and application pages, as well as service functions, with the highest number of associated violations. An example is shown in Figure 18-18.
The application violation counter reports the number of website, network, server and content errors, while the user violation counter reports the number of content notifications and client aborts. A content notification is the detection of a predefined string within a page (such as "Order processed successfully"); a client abort refers to a page view that was aborted by the client, possibly because the client closed the browser, or clicked reload, or clicked away, while the page was loading.
For each suite instance, total counters are also reported for each of its associated suite-specific data items (such as Oracle Fusion view ID). See the Oracle Real User Experience Insight User's Guide for further information on these items.
Note that the number of items (such as page names or suite-specific data items) listed for a category can be controlled via the Show menu. For example, list only the 5 or 10 items with the most violations. The Minimum Violations menu allows you to specify the threshold of violation incidents that needs to be met for a page before being reported.
If a page or object experiences several types of errors (for example, both a network and a web service error), the page or object error is not recorded multiple times. Instead, it is reported according to the following order: website, server, network, and content. For example, if an object experiences both a website and a network error, the error is recorded as a website error.
The application violation counter reports the total number of website, network, server, and content errors. The user violation counter reports the total number of content notifications and client aborts. An example of the possible use of these counters would be the creation of dashboards to track the general health of specific applications. These counters are also available for use as KPI metrics.
18.6.1.4 User Flows Tab
The User Flows tab displays information about the user flows associated with the current Business Application. An example of the data displayed in this tab is shown in Figure 18-19. The information shown includes a graphic representation of the loss of users through the defined steps, the number of steps completed and the number of steps stopped.
18.6.2 Working With Session Diagnostics
The Session Diagnostics facility allows you to perform root-cause analysis of operational problems. It supports session performance breakdown, including the impact of failing pages and hits on sessions, the full content of each failed page, and the relationship between objects, page views, and sessions. Moreover, it offers the opportunity to track exactly what error messages visitors to the monitored website receive, and when. With this ability to recreate application failures, you can identify and eliminate annoying or problematic parts of your web pages.
This section explains the use of the Sessions Diagnostics facility. It covers the following topics:
18.6.2.1 Getting Started
To locate the diagnostics information you require, do the following:
-
On the Business Application home page, from the Business Application drop down, select Real User Experience (RUEI) and then RUEI Session Diagnostics.
-
Use the View Data menu to select the required period. Note that the availability of session diagnostics information is determined by the Statistics and Session Diagnostics data retention policy settings specified for the associated RUEI instance. For more information, see the Oracle Real User Experience Insight User's Guide.
-
Specify the appropriate search criteria to locate the required user record(s). The available default search criteria are controlled by the RUEI instance configuration (described in Section 18.6.2.2, "Customizing Session Diagnostics Reporting"). You can click Add Fields to make additional search criteria available. Be aware that while the use of wildcard characters (*) is supported, all other search characters are treated as literals. Also, all criteria specified for the search must be met for matched user records to be reported.
You can specify multiple values for a single dimension by clicking Add Fields, and selecting the required dimension. In this case, only one of the specified values needs to be found in order for a match to be made.
After updating the appropriate search filters, you can save the search combination by clicking Save. Note that changes to saved searches can influence the available fields within the Add Fields facility. In addition, the predefined list of available dimensions is based on the business application definition. For example, only oracle Fusion-specific dimensions are available if the business application is defined as a Oracle Fusion suite.
When ready, click Search. The results of the search are shown in the lower part of the area. An example is shown in Figure 18-20.
If you specify an ECID as the search criteria and the ECID value refers to a spurious hit then no results are displayed if you also specify a filter relating to a page property, because there is not a page associated with the spurious hit.
Figure 18-20 Session Diagnostics Search Results
Description of "Figure 18-20 Session Diagnostics Search Results"
-
Click the user record of interest from the displayed list. Information like the one shown in Figure 18-21 is displayed.
Figure 18-21 Example Session Activity Listing
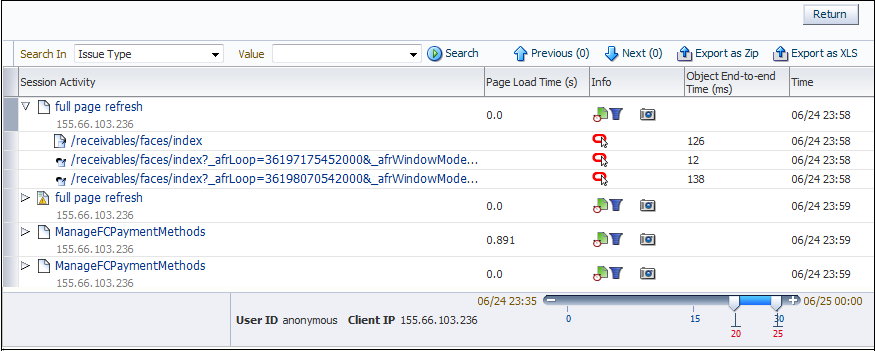
Description of "Figure 18-21 Example Session Activity Listing"
-
The overview shows the pages and actions recorded within the selected user record. You can hover your mouse over an icon to see a tooltip. Icons indicate slow or failed objects, page-loading satisfaction, whether replay content is available, and whether clickout is available to JVM Diagnostics to provide activity information. (Clickout capability is shown by the Oracle icon.) The camera replay can show a pop-up with full contents of the hit. This allows access to the original html in full detail. The icon shown as item 1 in Figure 18-28 provides a link to associated logs to help debug an issue.
-
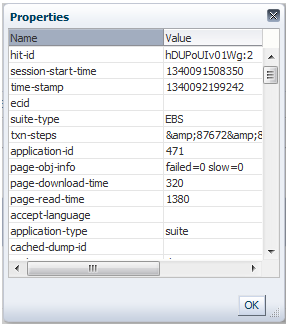
You can click a page or object within the selected user session to open a window with detailed technical information about it. An example is shown in Figure 18-22.
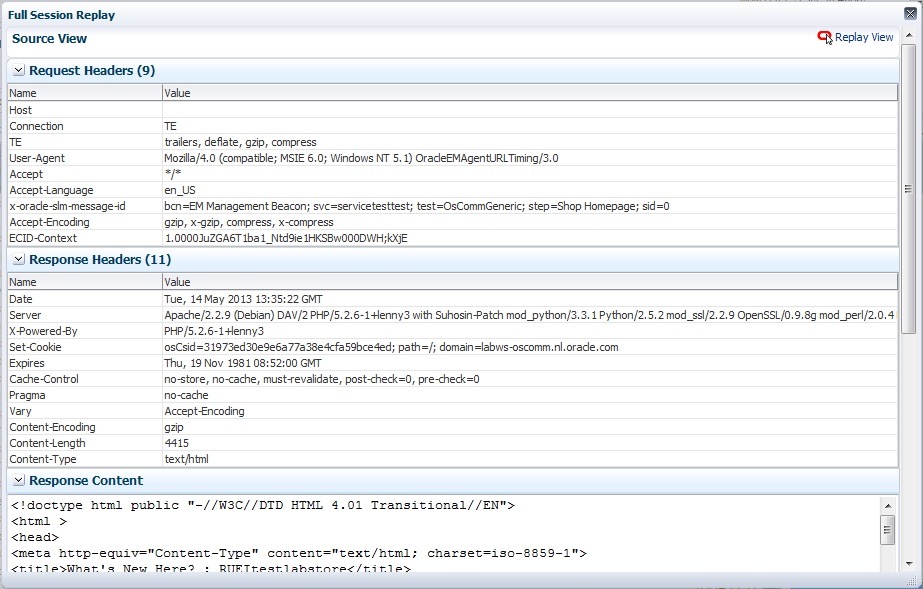
When replay content is available an icon is displayed in the Session Activity Listing as shown in Figure 18-21. You can click on the icon to open a pop up showing the Replay Content that was recorded. An example is shown Figure 18-23.
Click the Replay View link in the upper right corner of the screen to be redirected to the RUEI server, where you see the browser view of the Session Replay Content. You might be required to log in to the RUEI server.
-
The list of matched user sessions shown in Figure 18-20 is based upon the period selected in the View menu. For example, if the period "Last hour" is selected, the list of matched user sessions is based on sessions that were active during that period. However, they may have started or finished outside this period. For this reason, you can use the slider at the bottom of Figure 18-21 to restrict the displayed page views and actions to a more specific period.
-
Optionally, click Export as Zip to export the session's complete contents to external utilities for further analysis (described in Section 18.6.2.3, "Exporting Full Session Information") or Export as XLs to export a summary of the pages within the session (described in Section 18.6.2.4, "Exporting Session Pages to Microsoft Excel").
18.6.2.2 Customizing Session Diagnostics Reporting
You can control the specific dimensions reported in Session Activity part of the Session Diagnostics for applications, suites and services. To do so:
-
From the Setup menu, select Middleware Management, then select Application Performance Management. The currently registered RUEI instance is shown in the RUEI Systems row of the Application Performance Management page shown in Figure 18-2.
-
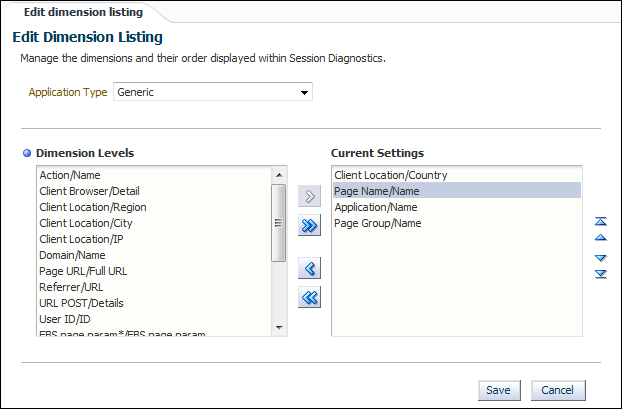
Select the required RUEI system. Click Configure. The Edit Dimension Listing page shown in Figure 18-24 is displayed.
-
Use the Application Type menu to select whether you want to modify the dimension listings for generic applications (that is, applications that are not suite-based), services, or suites. If the latter, you will need to specify the suite type.
-
Use Move and Remove to select the dimensions that should be listed. Once selected, you can control the order in which the item appears in the list. When ready, click Save.
18.6.2.3 Exporting Full Session Information
In addition to viewing session information, you can also export complete session contents to external utilities for further analysis or integration with other data. For example, you could use complete real-user sessions as the basis for test script generation. Test platforms, such as Oracle Application Testing Suite (ATS), can easily be configured to generate automated test scripts for an application's most common usage scenarios.
In addition, this facility can also be used to support root-cause analysis. Complete user session information can be provided to application or operations specialists to help identify unusual or difficult to isolate issues. Sensitive information within the exported data is masked according to the actions defined in the HTTP protocol item masking facility. This is described in the Oracle Real User Experience Insight User's Guide.
To export session information:
-
Locate the required session, and click Export as Zip.
-
Depending on how your browser is configured, you are either prompted to specify the location to which the zip file should be saved, or the session is immediately saved to the defined default location.
In order for the session export files to be created correctly, you should do the following:
-
Ensure that the requirements for exporting session information described in Section 18.2, "Prerequisites and Considerations" have been met.
-
Verify the exported content files (described in the following section) are present before attempting to import an exported RUEI session into an external utility.
Understanding the Structure of the Exported Data
The exported session zip file contains the following files:
-
data.tab: contains the direct (raw) hit information for the selected session extracted from the Collector log file. -
page.tab: contains the direct (raw) page information for the selected session extracted from the Collector log file. -
content_hitno.tab: contains the complete (raw) content information for the indicated hit. There is a file for each hit within thedata.tabfile that has content. For example, if the third and sixth hits had content available for them, two files would be created:content_3.tabandcontent_6.tab.Viewable versions of the files cited in the hit file are also available under the
content_viewerdirectory. This means that data transferred with chunked encoding can be immediately viewed. Note that the samehitnoas in thedata.tabfile is used in their file naming. -
index.html: allows developers and other interested parties outside RUEI to view and analyze session details as they would appear within the Session Diagnostics facility, with access to source, page and object details, and element identification.
Note:
The log files used as the basis for creating exported session files are also used internally by RUEI. The format and contents of these files is subject to change without notice.18.6.2.4 Exporting Session Pages to Microsoft Excel
You can export a summary of the pages within the currently selected session to Microsoft Excel.
-
Locate the required session, and click Export as XLS. Depending on how your browser is configured, you are either prompted to specify the tool with which to open the file directly (by default, Microsoft Excel), or the session is immediately saved to the defined default location.
-
Within Microsoft Excel, you can view and edit the generated file. The exported page view history and session summary can be used to compile sets of real-user sessions that could be used as the basis for testing or performance analysis.
Controlling Row Creation and Ordering
Be aware that the rows that appear in the Microsoft Excel export are based on the currently specified RUEI configuration. This is described in Section 18.6.2.2, "Customizing Session Diagnostics Reporting".
18.6.3 Monitoring RUEI Metrics
As part of Business Application monitoring, the RUEI Metrics page presents a useful overview of user-selectable metrics within a given timespan. These metrics can be counts (for example, page views) or aggregate values (such as, median page load time).
To view the RUEI Metrics page, select Real User Experience (RUEI) and then RUEI Metrics from the Business Application drop down, as shown in Figure 18-25.
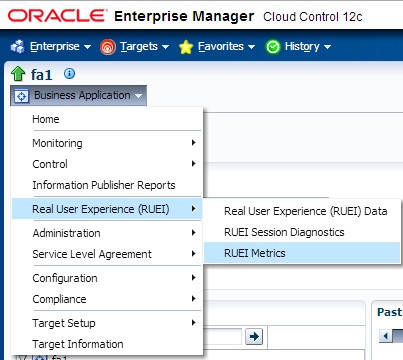
This page allows you to select performance metrics and view their associated average and median data graphically.
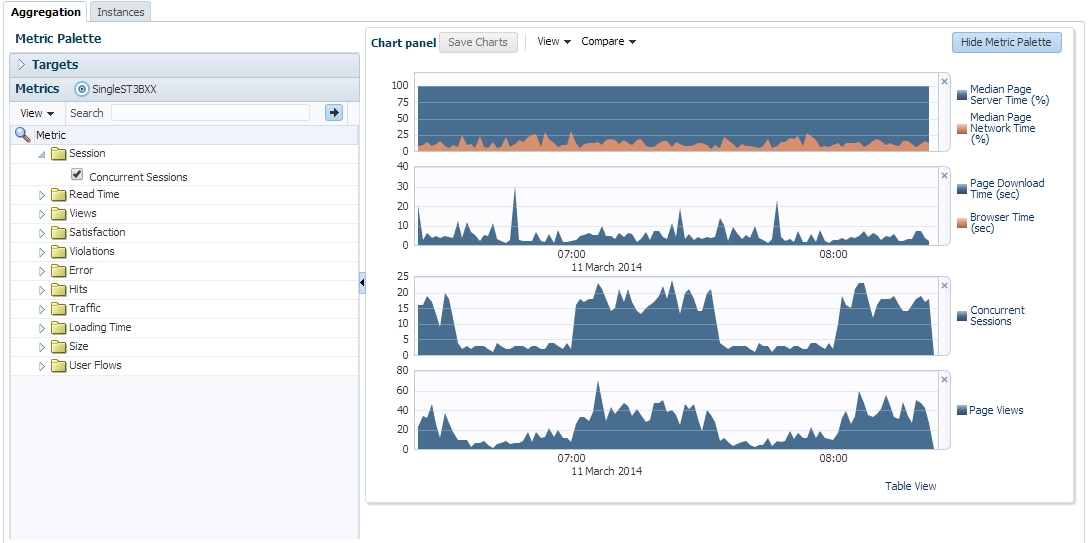
The time-period for the data can be set and search filters similar to those on the RUEI Session Diagnostics Page allow you to further refine the data returned. Filter settings can be saved for subsequent use. The metrics are displayed in two tabs, Aggregation shows the metric aggregated over time and Instances shows individual events.
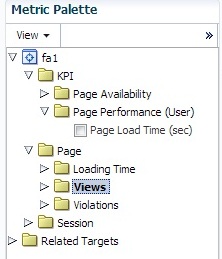
On the Aggregation tab the selectable metrics are arranged in an hierarchical tree palette. The list displays a set of items that is appropriate for the configured business application type. This set can expand to include system metrics. For example, if the application associates to a WebLogic server, JVM metrics become available in addition to RUEI metrics. An example of a metrics palette is shown in Figure 18-26.
Note that the individual metrics graphs can be combined into one chart using the graph toolbar. Also some of the listed graphs show data from different parts of the metric palette combined into one chart. In Figure 18-27, the top chart shows graphs for both Median Page Server Time and Median Page Network Time.
Incident Manager allows you to navigate directly from a KPI event to the RUEI Metrics page. In this case, the RUEI Metrics page is populated with time and filter settings relevant to the context of the KPI event. Therefore, you can inspect relevant metrics around the offending event, be it in time-period or in filters broader than those that correspond to the original KPI event.
From the RUEI Metrics page there is a direct link to the session diagnostics facility. When you click this link, the search properties and time-span will be re-used to find sessions that match the active criteria.
Note:
Selecting median values over a large timespan can impact performance.The instances tab displays events filtered using the criteria you set, for example Client Browser = Chrome. If you specify an ECID as the criteria and the ECID value refers to a spurious hit then no results are displayed, because there is not a page associated with the spurious hit. For each item in the results, you can:
-
Review the Session Activity, timing and user information (if available). Where applicable, you can expand and collapse items to display further detail, for example specific URLs associated with the session activity, or page attributes.
-
Display session information for the event, see "Working With Session Diagnostics."
-
Review the icons (numbered 1 to 5) for each item as shown in Figure 18-29 where:
Icon 1 provides a link to the log viewer, showing logs associated with the current item.
Icon 2 provides a link to Request Instance Diagnostics, that is, JVM Diagnostics for the current item.
Icon 3 the indicates page loading satisfaction, a tooltip appears displaying the satisfaction level, for example Satisfied.
Icon 4 provides a link to replay content (for example, the original html if available).
Icon 5 provides a link to further session diagnostics, see "Working With Session Diagnostics."
Some of the icons shown are the same as those for Session Diagnostics, see Figure 18-20, "Session Diagnostics Search Results".
18.7 Monitoring KPI and SLA Alert Reporting
This section explains the KPI-related information that is available for both RUEI applications and BTM Transactions.
Note:
To monitor KPI and SLA alerts you must first complete all the steps described in "Setting Up a Connection Between RUEI and the Oracle Enterprise Manager Repository."The alerts generated by KPIs defined for the applications, suites, and services, as well as for the SLAs for the transactions that comprise your business applications are reported as events in Incident Manager. To view these events:
-
From the Enterprise menu, select Monitoring, and then Incident Manager.
-
Open the Events Without Incidents predefined view.
-
Click the event of interest to view more information about it.
Event detail information varies depending on whether the event is based on a RUEI KPI or BTM SLA. Each is described in the following sections.
You can also access the Events Without Incidents view from the home page of a business application using the Business Application menu. Select Monitoring, then Incident Manager, and Events without Incident. This option shows events in the context of the selected Business Application.
After accessing the Events Without Incidents view, you will see events listed as shown in Figure 18-29.
When you click on the RUEI event, you'll see event details at the bottom of the screen in the Guided Resolution region (as shown in Figure 18-30).
Select RUEI metrics to drill down to the RUEI Metrics page in context of the filters that were set up for the KPI as well as in the time frame of the KPI violation. The RUEI Metrics page will also show the metric that is the basis for the KPI definition.
The status of the KPIs defined for the applications, suites, and services that comprise your business applications are reported in the RUEI - Key Performance Indicators (KPIs) tab (explained in Section 18.6.1.1, "RUEI Key Performance Indicators Tab").
This provides information about the Business Application associated with the KPI, as well as the metric upon which the KPI is based. Note that for ease of management, KPIs within RUEI are grouped into categories that can be customized to contain related performance indicators. For example, separate categories could be defined for business and IT-related issues, such as user flow completion, visitor traffic, website availability, and so on.
Important:
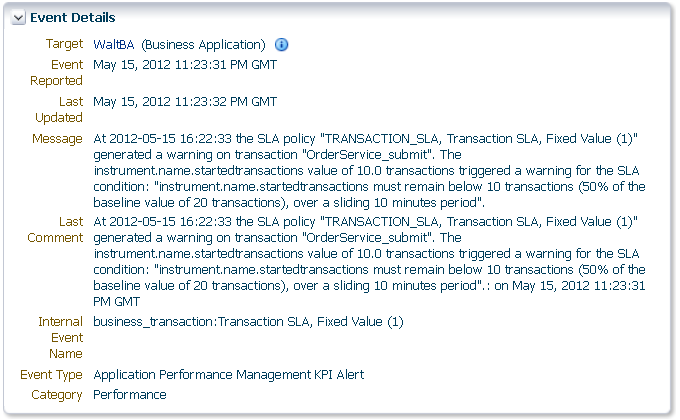
In order to view KPI alerts within Incident Manager, you will need to set up a connection between RUEI and the Oracle Enterprise Manager Repository. The procedure to do this is described in Section 18.3.1, "Setting Up a Connection Between RUEI and the Oracle Enterprise Manager Repository".Information about BTM SLA alerts is shown on the Alerts tab and on the SLA Compliance tab for BTM. Events corresponding to these alerts are also shown in the Events Without Incidents view of the Incident Manager. When you click the event of interest, information similar to that shown in Figure 18-31 is displayed.
Information is provided about the following:
-
Target: the business application containing the service or transaction for which the event was reported.
-
Event Reported: the date and time when the event was reported.
-
Last Updated: if the severity of the event has changed, this indicates the date and time when it has changed.
-
Message: details about the event and the condition that triggered it.
-
Last Comment: indicates comments manually added to events via the "Comments..." link in Incident Manager. If none have been added, then the original message is reported.
-
Internal Event Name: a combination of the managed object type whose threshold was breached (
business_transaction,service, orservice_endpoint) and the original SLA policy name. -
Event Type: this is always "Application Performance Management KPI Alert" for BTM SLA alerts.
-
Category: this is always "Performance" for BTM SLA alerts.
Important:
In order for BTM Service Level Agreement alerts to be reported as events in Oracle Enterprise Manager, you must set up a connection between BTM and the EM repository. Please consult the Business Transaction Management Installation Guide for instructions on how to configure this connection.18.8 Monitoring BTM Transactions in Enterprise Manager
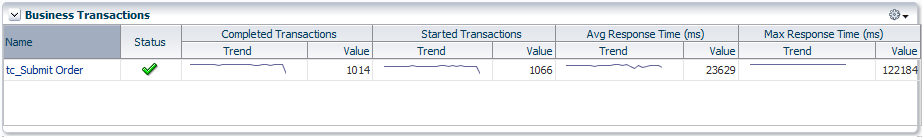
The Business Transactions region shown on the Business Application home page (Figure 18-13) provides a high-level overview of each transaction within the selected business application. An example is shown in Figure 18-32.
Figure 18-32 Business Transactions Region
Description of "Figure 18-32 Business Transactions Region"
For each transaction, it indicates:
-
The transaction's current compliance status.
-
The number of transaction instances started during the period. A transaction instance starts when an instance of the primary operation flow is started.
-
The number of transaction instances that completed during the period. An instance is considered to have completed when both its start and end messages have been observed, regardless of whether condition alerts occurred.
-
The average amount of time a transaction requires to complete. For each transaction instance, this is calculated as the time from when the instance's start message is observed until its end message is observed.
-
The maximum amount of time a transaction requires to complete. This is the single highest response time from all transaction instances observed during the period.
You can click a transaction to view more information about it. This opens the Transaction Home page, where you can view the following regions:
-
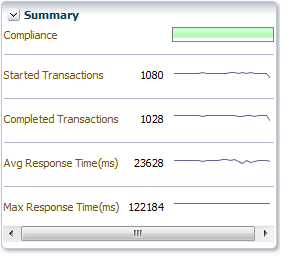
Summary: provides a graphic rendering of the transactions' overall compliance and core metrics. An example is shown in Figure 18-33.
-
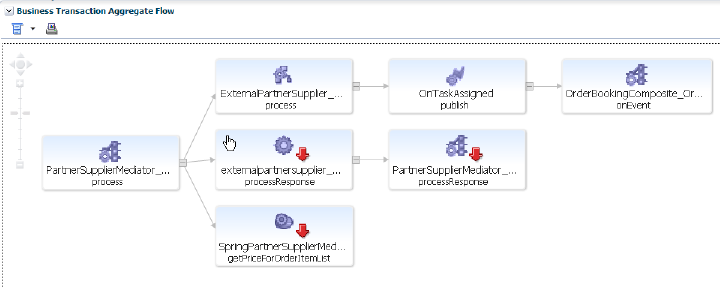
Business Transaction Aggregate Flow: provides a graphical rendering of the operations that make up the selected transaction and their status. An example is shown in Figure 18-34.
Figure 18-34 Business Transaction Aggregate Flow Region
Description of "Figure 18-34 Business Transaction Aggregate Flow Region"
The aggregate flow region provides you with a complete picture of the transaction and helps you understand the flow of work through it. You can use it to identify and resolve issues related to performance, and to isolate the cause of failing components in a business process. Based on the dependencies revealed by discovery, the services that interact within the transaction are also revealed. Additional information is usually available if you move the cursor over the links that connect operations or the operation itself. This should allow you to identify bottlenecks, faulty components, slow components, and unusually light or heavy traffic.
-
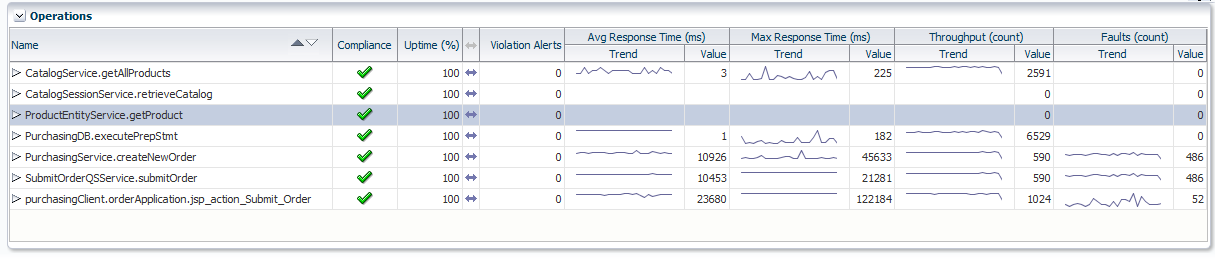
Operations: indicates all the logical operations associated with the transaction. An example is shown in Figure 18-35.
You can expand an operation to view its corresponding endpoints. An operation might have several corresponding endpoints if it has been replicated or if different endpoints are used for secure/unsecure communication. For each endpoint, the host name and port for the container where the endpoint resides are also displayed, together with its status and performance data. If you right click an endpoint in the Operations or Business Transaction Aggregate Flow region, you can choose to display the tabs associated with the physical operation. The context menu that is displayed when you right-click an operation also provides the option to access the JVMD view or the Request Instance Diagnostics view:
-
The JVM Diagnostics view allows you to view the details of an executing Java Virtual Machine (JVM) process for the period within which a given operation executes. You can see stack frames for executing threads, thread state information, aggregate information about the frequency and cost of method execution, information regarding the holding of Java and DB locks, and details about the objects in the Java heap. JVMD also stores historical data for each JVM it monitors so that you can view data relating to things that have happened in the past and get a sense for historical trends.
-
The Request Instance Diagnostics view allows you to trace the path of a request in a WebLogic domain and to generate a report of all the metrics associated with a particular instance of the request.
Please see Chapter 17, "Getting Detailed Execution Information," for additional information about these views.
-
18.9 Working Within Business Transaction Manager
Additional information about a selected transaction is available by clicking Launch BTM at the top-right hand of the Transaction Home page. This will open a new window with the Business Transaction Management console providing extended information about the selected transaction. The first time you open this window you will need to provide a valid BTM user name and password. An example is shown in Figure 18-36.
Figure 18-36 Business Transaction Management Console
Description of "Figure 18-36 Business Transaction Management Console"
The following sections describe the Tabs display as they apply to a given transaction; similar information is displayed if you look at tabs for a physical operation. Additional information is available from the Oracle Business Transaction Management Online Help.
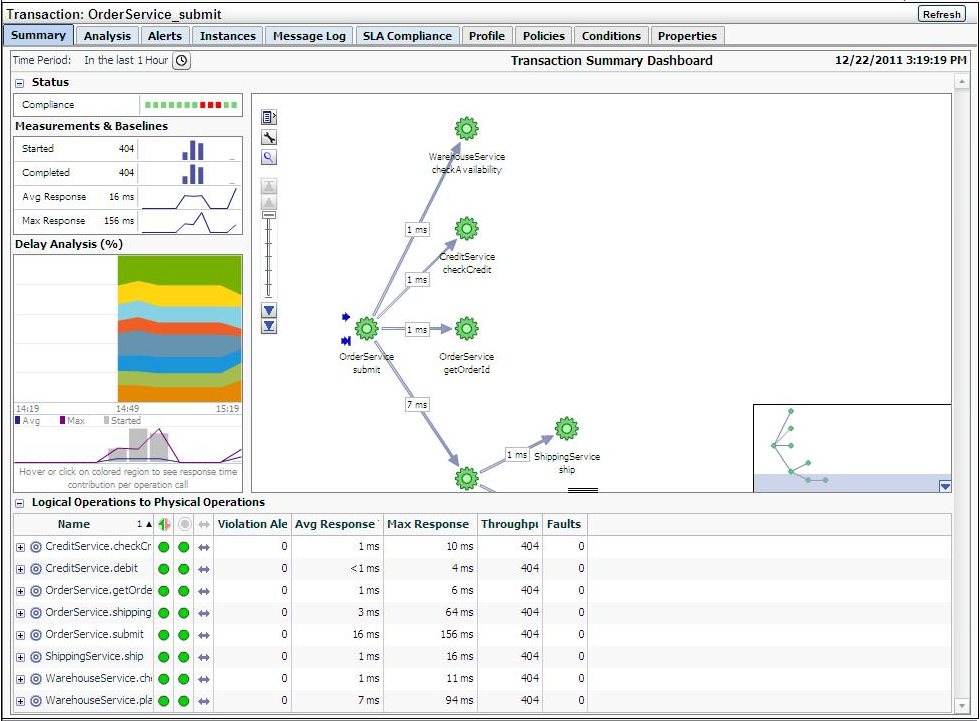
18.9.1 Summary Information
The Summary tab uses four panes and a grid view to present performance information in a Transaction Summary Dashboard. It contains the following elements:
-
A Status pane indicating the overall compliance for the transaction.
-
A Measurement and Baselines pane detailing the number of started and completed transactions, average response times, and maximum response times. If baselines have been defined for the transaction, these are shown as gray lines.
-
A map of the transaction detailing average response times for each transaction link. Place the cursor over each service icon to obtain detailed performance information for that service. The thickness of the arrows indicates throughput.
-
The Delay analysis pane, which you can use in conjunction with the map pane, provides a graphical rendering of the proportion of the overall response time that is spent in each hop (link) of the transaction.
Each colored area of the grid corresponds to a transaction link. Clicking within a colored region highlights its corresponding link in the map and displays the percentage of the response time taken up by that hop.
At the bottom of this pane, a graph shows the average and maximum response times, and the number of started transactions. Clicking within the pane displays a vertical red line that shows how the colored proportions correspond to message traffic flows.
-
A grid view showing the logical and physical operations that make up the transaction, and the following instruments for each: violation alerts, average response time, maximum response time, throughput, and faults.
18.9.2 Analyzing Transaction Information
The Analysis tab displays detailed current performance and usage information for the selected transaction. It contains the panes described in Table 18-1.
Table 18-1 Panes Within Analysis Tab
| Pane | Description |
|---|---|
|
Performance |
Provides data about started transactions, completed transactions, condition alerts, average response time, and maximum response time. The data is displayed in graphic form as well as using a grid view. |
|
Conditions |
Provides information about condition alerts that have been triggered in a given time period: the name of the condition that was met, the endpoint where the condition alert was triggered, and the number of condition alerts triggered. Conditions must have been defined for this information to be collected and displayed. |
|
Consumer Usage |
Displays performance information segmented by consumer for the given time period: started transactions, completed transactions, average response time, and maximum response time. Consumers must have been defined and consumer segmentation enabled for this information to be collected and displayed. |
|
Breakdown by Client Address |
Displays performance information segmented by client IP address: started transactions, completed transactions, average response time, and maximum response time. The client address is the machine host name from which the request was sent. The table lists all client addresses that sent requests, and displays the aggregated performance measurements associated with each client address. Segmentation by client IP address must be enabled for this data to be collected and displayed. |
|
Violation Alerts |
Displays information about service level agreement (SLA) violations. The display distinguishes between warning alerts and failure alerts. The graph shows aggregate measurements for violation alerts. The grid view lists more detailed information: showing alerts for each SLA policy. SLAs must have been created for this information to be collected and displayed. |
|
Custom Charting |
Lets you set up a customized chart and table similar to the Performance pane, but with instruments of your choosing. Click Choose Instruments, and select the instruments you want displayed in the chart and table. You can select multiple instruments. When you set up a custom chart/table for a transaction, it is available for any selected transaction. |
|
Custom Breakdown |
You can set up a custom table of numeric instruments segmented in various ways. Click Choose Instruments and select the instruments that you want displayed in the table. Click Choose Segments and select how you want to segment the measurements. You can select multiple segments. |
18.9.3 Viewing Alerts
The Alerts tab shows information about all alerts occurring in the given time period. Business Transaction Management issues the following types of alerts:
-
Service level agreement alerts issued when a deviation occurs from the standards of performance you have defined for a transaction.
-
Condition alerts issued when a condition is satisfied. Conditions can test for faults, specific property values, or a missing message.
-
System alerts issued to provide information about the health of the monitoring infrastructure.
The grid view shows the following information for each alert: time of occurrence, an icon denoting the severity of the alert, the source of the alert, the instrument measured, and for SLA alerts, the enforcement value. To obtain more information about a given alert, click the Inspector icon to open an inspector window.
Service level agreement alerts are also reported as events in Incident Manager. For more information on accessing these events, see Section 18.7, "Monitoring KPI and SLA Alert Reporting".
18.9.4 Viewing Transaction Instances
The Instances tab allows you to view captured transaction instances.
A transaction usually executes many times in a given period. If you have enabled transaction instance logging or if you have enabled fault monitoring, Business Transaction Management tracks the flow of messages included in the transaction and maps these to particular transaction instances. It assembles the messages for a transaction instance in the following cases:
-
When an alert is generated as a result of a fault, or a condition being met.
-
When you explicitly ask for assembly.
Once a transaction instance is assembled, you can use the Instances tab to access detailed performance information for that instance. You can also use the Message Log tab to search for messages containing particular property values.
In the Instances tab, The ID column of the table lists both instances that have been assembled (these have an ID value assigned) and instances that have not been assembled (these are blank). Information for each instance shows when it was captured, what the overall response time for the transaction instance was, and values for properties if you have created these.
The Show instances filtering control allows you to list instances that have occurred in a set time period or to show only assembled instances.
Which instances you choose to assemble depends on what interests you. For example, you might want to assemble an instance with an unusually slow response time; or you might want to assemble an instance with an unexpected property value.
If you are capturing a very large set of messages, you might want to use the Message Log tab to search for a smaller set of messages, based on property values, and then assemble one or more of these.
Inspecting an Assembled Instance
You can assemble an instance by clicking the Inspector (magnifying glass icon) for the instance. This opens a Transaction Instance Inspector. It consists of three parts:
-
The top part of the inspector shows the name of the transaction, the time the assembled instance started executing, its ID, the number of message exchanges, the total messages exchanged, and the response time between the starting and ending messages. Any warnings or faults are also shown.
-
The instance map shows the entire transaction instance, with the response time given for each request/response link. Move the cursor over the operation name to view the service type, endpoint name, host name, and port. Right clicking an operation allows you to view JVM diagnostics.
-
A grid view shows detailed information for each message included in the transaction instance. The view includes property values if these have been defined. Right clicking a row allows you to view JVM diagnostics.
Clicking the magnifying glass (tear-off control) for any operation, opens a Message Content inspector window, and displays the contents of the selected message if you have enabled message content logging for that operation.
18.9.5 Viewing Message Logs
You can use the Message Log tab to view the following information:
-
If instance logging is enabled, you can view information about each message logged in a specified time period, as well as the value of any property associated with a message. You can also use the Message Log Search tool to search for a message or messages that contain property values of interest.
-
If message content logging is enabled, you can view information about each message logged in a specified time period, as well as its content. In this case, in addition to searching for messages based on property values, you can also search based on the content of any message element (free text search).
Business Transaction Management logs message content or instance and property values only if you have done the following:
-
Enabled monitoring for the transaction.
-
Enabled the appropriate type of logging for the transaction (instance or message).
-
Selected one or more operations for message logging.
Logged information is stored according to storage settings that you define when you create the transaction.
The Message Log tab uses a grid view to display a list of messages, showing the arrival time of the request message, the service that includes the selected operation, the location of the endpoint that implements the service, the operation (message), and the type of operation. If there are any properties associated with the operation, their values are shown in additional columns whose title is the property name.
If you have message content logging enabled, double clicking on any message shows you the contents of the message. The set of messages shown in the grid varies depending on the setting of the filters shown at the top of the tab. These allow you to see the following:
-
All operations or specific operations chosen from a drop down list.
-
Any response, only successful operations, only failures.
-
Messages that arrived within a time interval denoted by the last specified time period, since a certain time, or between two given times.
You can use these controls to narrow the selection of messages shown in the grid. After you change filter settings, click Search again to repopulate the grid. You can further restrict your search by using the Message Search tool accessed from the Choose Content... link. This allows you to search for messages based on their property values or, if message content is enabled, based on message content. This tool is described in the next section.
You can find messages belonging to the current transaction, by clicking the Choose Content... link from the Message Log tab. This brings up a dialog that includes three areas to use for specifying search criteria: an area labeled Message property search, an area labeled ECID, and one labeled Free text search. You use controls in these areas to search for a set of messages based on a property value, an ECID value, and/or on text content. As you enter property, ECID, and free-text values, a search expression is constructed in the text box at the top of the dialog. To clear the text box and start over, press Clear.
Additional information about using Oracle query language to construct your query is available at the following location:
https://download.oracle.com/docs/cd/B28359_01/text.111/b28304/cqoper.htm#BABBJGFJ
When you are done defining the expression to be used in the search, click OK. Then click Search to repopulate the grid according to your newly defined search criteria. For more information about the Message Log Search tool for searching for messages with a specific ECID, see the Business Transaction Management Online Help.
18.9.6 Viewing Service Level Agreement Compliance
The SLA Compliance tab displays the current state of Service Level Agreement (SLA) compliance for the selected transaction. These are specified during transaction creation. You use such agreements to set standards of performance for a business application. You can then monitor deviations from those standards. To view both condition alerts and SLA alerts, use the Alerts tab. The SLA Compliance tab has the following subtabs:
-
The Threshold Compliance subtab provides real-time monitoring of the selected transaction. It uses a grid view. Each row represents one performance objective. The columns provide various types of static information that identify and define the objectives. Also provided are the following dynamic columns with real-time monitoring values:
-
The Current Status column can have three possible values: a green circle indicates that the transaction is in SLA compliance, a yellow triangle indicates that the warning threshold for the transaction is currently in violation, and a red diamond indicates that the failure threshold for the objective is currently in violation.
-
The Value column displays the current value of the instrument on which the objective is based. Click the magnifying glass next to a value to pop up a chart showing the instrument's recent history.
-
-
The Baselines subtab displays historical baseline values for the transaction that you can use as a reference point. Data is shown only if baselines for the selected object have been defined.
18.9.7 Viewing Policies Applied to Transactions
Use the Policies tab to view information about policies associated with a transaction. By default, the tab shows information about applied policies. You can use the filter control to view changed policies, disabled policies, pending policies, rejected policies, and unapplied policies. The name of the applied policy is shown in a tree view in the Name column. Expanding the policy node shows the following information:
-
Policy Status Details lists any issues arising from the application of the policy.
-
Monitored Object Type specifies the targets to which the policy is applied.
-
Location specifies the address of a target endpoint.
-
Management Intermediary specifies the Business Transaction Management agent that is applying the policy.
Double clicking the policy name in the Policy tab, opens a new window that you can use to view alert, profile, and target information for the selected policy.
18.9.8 Viewing Transaction Profile Information
Use the Profile tab to see a map of the transaction and to see its definition. It also provides the following information:
18.9.9 Viewing Transaction Conditions
When you define a transaction, you can associate one or more conditions with the transaction. A condition is an expression that Business Transaction Management evaluates against each instance of the transaction. Conditions can test for faults, specific property values, or missing messages. Use the Condition tab to display the conditions defined for a transaction. This tab allows you to do the following:
-
View the status of fault monitoring: enabled or disabled.
-
View condition definitions and status.
Use the Alerts tab to see whether any of the conditions have been violated. You cannot change fault monitoring status or condition definitions from the Enterprise Management console.
18.9.10 Viewing Transaction Properties
Properties are variables that hold values associated with the request or response phase of an operation. Properties are commonly used to facilitate searches, to surface message elements without having to log message content, to define conditions, and to enable consumer segmentation. Use the Properties tab to display a list of all the properties defined for messages included in a transaction. In addition to listing the properties, the tab shows information about the following:
-
The service and operation for which the property is defined.
-
The phase (request/response) of the operation.
-
The data type of the property value.
-
Whether the value is deemed sensitive.
-
Whether it is mapped to a consumer (denoted by a human icon on the left) and what consumer-mapped attribute it is associated with.
-
A description if you have supplied one when you created the property.
You cannot modify a property value from the Enterprise Management console.