24 Getting Started with Management Pack for Oracle Coherence
This chapter describes the procedure to discover and monitor a Coherence cluster using Oracle Enterprise Manager Cloud Control 12c. The following sections are covered in this chapter:
24.1 About Coherence Management
Oracle Coherence is an in-memory data-grid and distributed caching solution. It is composed of many individual nodes or java processes which work together to provide highly reliable and high speed virtual caching.
Enterprise Manager provides deep visibility into performance of all the artifacts such as caches, nodes, and services. The Cluster Home page displays an overview of the performance hotspots such as nodes with minimum available memory, publisher and receiver success rate, and nodes with maximum send queue size. The Cluster Home page provides immediate visibility into the worst caches in the system based on hits-to-gets ratio which is an overall health indicator for the cluster.
Nodes and caches can be proactively monitored by the Incident Management feature. You can create a monitoring template by pre-populating the monitoring template with metrics for a Coherence target. You can export and import monitoring templates to share monitoring settings between different Enterprise Manager deployments.
Metric Extensions are the next generation of User-Defined Metrics, which enable you to extend Enterprise Manager to monitor conditions specific to the enterprise's environment by creating new metrics for any target type. By including metric extensions in export or imported monitoring templates, multiple metric extensions can be easily shared at the same time between Enterprise Manager deployments.
You can correlate cluster nodes with the underlying hosts to determine CPU and memory utilization on those hosts in order to make better decisions for scaling your clusters. You can see the association of the caches, nodes, hosts and also Oracle WebLogic targets using Coherence*Web applications.
Highly customizable performance views for monitoring performance charts and trends are available. You can overlay metrics for multiple nodes or caches in the same or different cluster for detail analysis to provide detailed visibility at the desired level. The drill down views allows you to determine the root cause of performance problems or simply identify performance trends in the Coherence Cluster.
Enterprise Manager provides a centralized cache data management feature that allows you to perform various cache operations such as add/remove index, view cache data, view query explain plan, and so on.
Enterprise Manager monitors the changing configuration of the nodes over a period of time. You can compare configurations of multiple nodes which helps identify performance bottlenecks caused by configuration changes. The Topology Viewer provides a high level topology of the entire cluster and shows the relation between caches, nodes and hosts. You can customize topology view to show some key performance metrics as well.
All of the Coherence Management features are integrated with JVM Diagnostics and provide real-time visibility into the node JVMs. You can drill down to a Coherence node's JVM from within the context of a cache and a cluster to identify the method or thread that is causing a delay. The JVM Diagnostics feature is part of the WLS Management Pack EE and Management Pack for NonOracle Middleware.
Enterprise Manager provides a complete provisioning solution. You can maintain an Oracle Coherence setup image or gold image in the Software Library and deploy it throughout the infrastructure to create completely new clusters or add nodes an existing cluster. You can use the same deployment procedure to updates nodes as well.
24.2 New Features
This section lists the new features in Oracle Enterprise Manager Cloud Control 12c. The new features are:
-
User Interface Enhancements: Several enhancements have been made to the page layout and format of all the pages. Some of the changes made are:
-
Navigation Tree: The navigation tree makes it easier to navigate to any node or cache from any page. Nodes are grouped based on the hosts on which they are running, and caches are grouped based on services.
-
Personalization: The personalization feature allows users to customize any of the pages by adding or deleting regions, changing the page layout, adding or deleting metrics, and so on.
-
Master-Detail View: In the Detailed pages, a context sensitive list of nodes, caches, services, and applications is displayed in a master-detail view. When a row is selected (node, cache, service, or application), corresponding charts for the key metrics are shown in the bottom part of the page.
-
-
Home Page Changes:
-
Summary: This region shows the overall cluster availability and configuration. Nodes are divided in two categories, storage and non-storage, you can check the status of each type of nodes. Together with number of caches and total objects gives overall cluster capacity.
-
Incidents: This region indicates the proactive alerts that are generated by Enterprise Manager based on the configured threshold. You can configure warning and critical threshold levels to indicate the severity of the alerts. It also shows the incidents for all the child nodes and caches.
-
Key Indicators: This region shows the network performance and memory utilization aggregated across all the nodes in the cluster. Send/Receive success below 95% over prolonged period is a warning sign and should draw the administrator's attention, anything below 90% can lead to critical errors in the cluster, including unstable cluster and dropping of the nodes.
-
Top Components: This region provides insight into the top 10 components for a given metric. It provides quick visibility into the performance hotspots in large data grids.
-
Charts: The charts show the trends of the important cache metrics. These are aggregated across all the nodes where the cache is running.
-
24.3 Configuring a Coherence Cluster for Monitoring
You need configure a Coherence cluster before it can be monitored in Enterprise Manager. You can:
-
Configure a Standalone Coherence Cluster
-
Configure a Managed Coherence Cluster
24.3.1 Configuring a Standalone Coherence Cluster
Oracle Coherence standalone deployments can be monitored using Enterprise Manager by configuring the Coherence nodes with a set of Coherence and JMX system properties (start arguments). In addition, one of the nodes will have to be configured as a central JMX management node. This JMX management node must expose all Coherence MBeans and attributes. See Section 24.3.1.1, "Creating and Starting a JMX Management Node" for details. In addition to configuring the JMX management node, the Management Agent must also be installed and configured on the same host as JMX management node. This is required to discover and monitor the Coherence cluster in Enterprise Manager.
Figure 24-1 shows the configuration for monitoring standalone Coherence clusters using Enterprise Manager.
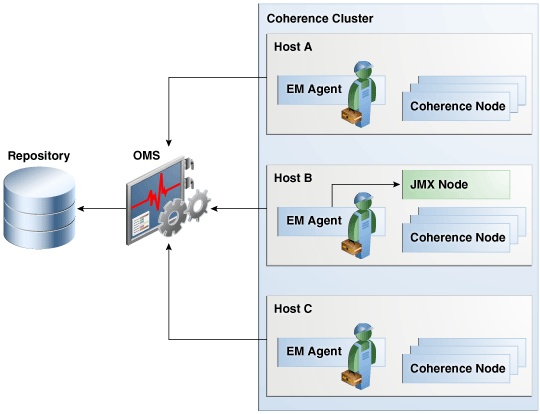
As shown in the figure, Coherence Management (JMX) node's MBean server will expose MBeans for entire Coherence cluster. Enterprise Manager will connect to this management node to discover and monitor Coherence cluster.
24.3.1.1 Creating and Starting a JMX Management Node
The Management Agent uses the JMX management node (centralized MBean server) to discover and monitor the entire Coherence cluster, including the nodes and caches. As a best practice, it is recommended that the Management Agent be present on the same host as the JMX management node that is used to discover and monitor the Coherence cluster. The Management Agent must be setup on all the machines on which the Coherence nodes are running to monitor and provision the cluster. See the Using JMX to Manage Coherence chapter in the Oracle Coherence Management Guide for more details on using JMX to manage Oracle Coherence. To configure the JMX management node, you must:
-
Specify Additional System Properties
-
Include Additional Class Path
-
Use the Enterprise Manager Custom Start Class
24.3.1.1.1 Specifying Additional System Properties
Note:
Oracle recommends that the management node is configured as a storage disabled node to ensure minimal performance impact on any Coherence caches.The following start arguments must be added to one of the Coherence nodes to configure it as the JMX central management node.
-
-Dtangosol.coherence.management.extendedmbeanname=true(allows any restarted node to be automatically detected by Enterprise Manager. This parameter is available in Coherence 3.7.1.9 and later versions)-
If set to true, the status of the node is automatically refreshed when a node is restarted.
-
If this property is not set, you must use the Refresh Cluster option to update the status of a node when it is restarted.
-
If you start a node after setting this property to true, all nodes in the cluster must be started after the
extendedmbeannameproperty is set to true.
-
-
-Dtangosol.coherence.management=all(enables monitoring for all nodes) -
-Dcom.sun.management.jmxremote.port=<port number>(required for remote connection) -
-Dtangosol.coherence.distributed.localstorage=false(disables caching and ensures that the node is a dedicated monitoring node) -
-Doracle.coherence.home=<coherence home> -
-Dtangosol.coherence.member=<member name>(required for target name) -
-Doracle.coherence.machine=<fully qualified hostname>(must match the name of the host discovered in Enterprise Manager)
Note:
If you are using JMX credentials, you must set the following additional start arguments.-
-Dcom.sun.management.jmxremote.ssl=true -
-Dcom.sun.management.jmxremote.authenticate=true
If no JMX credentials are used, you must set these arguments to false.
24.3.1.1.2 Including the Additional Class Path
You must include the path to the Enterprise Manager custom jar files, coherenceEMIntg.jar and the bulkoperationsmbean.jar. These jar files are available in <OEM_Agent_Home>/<PLUGIN_HOME>/<MIDDLEWARE_MONITORING_PLUGIN_DIR>/archives/coherence directory.
Note:
The location of the .jar files may change based on the plugin version.24.3.1.1.3 Using the Custom Start Class
In addition to configuring the system properties and the class path when starting Coherence management node, it is also required that you use the Enterprise Manager EMIntegrationServer class as the start class. This class allows you to register the custom MBeans required for the Cache Data Management feature of Management Pack for Oracle Coherence.
24.3.1.1.4 Example Start Script for the Coherence Management Node
An example start script for the management node is given below:
#
!/bin/sh

CP=$CP:<EM CC_Agent_Home>/plugins/oracle.sysman.emas.agent.plugin_12.1.0.6.0/archives/coherence/coherenceEMIntg.jar:
<EM CC_Agent_Home>/plugins/oracle.sysman.emas.agent.plugin_12.1.0.6.0/archives/coherence/bulkoperationsmbean.jar
COH_OPTS="$COH_OPTS -cp $CP"
$JAVA_HOME/bin/java $COH_OPTS
-Dtangosol.coherence.management.extendedmbeanname=true
-Dcom.sun.management.jmxremote.authenticate=false
-Dcom.sun.management.jmxremote
-Dcom.sun.management.jmxremote.ssl=false
-Dtangosol.coherence.management=all
-Dtangosol.coherence.member=<unique member name>
-Doracle.coherence.machine=<hostname_as_discovered_in_EM>
-Dcom.sun.management.jmxremote.port=<OpenTCP_Port>
-Doracle.coherence.home=$COHERENCE_HOME
-Dtangosol.coherence.distributed.localstorage=false
-Dtangosol.coherence.management.refresh.expiry=1m
-server
-Xms2048m -Xmx2048m
oracle.sysman.integration.coherence.EMIntegrationServer
24.3.1.2 Configuring All Other Nodes
In addition to configuring the Coherence JMX management node, you must configure all other Coherence cluster nodes with additional Coherence specific system properties (start arguments) used by Enterprise Manager.
24.3.1.2.1 Additional System Properties for All Other Coherence Nodes
The following system properties must be added to all other Coherence nodes.
-Dtangosol.coherence.management.extendedmbeanname=true
-Dtangosol.coherence.management.remote=true –Dtangosol.coherence.member=<unique member name> -Doracle.coherence.home=<coherence home>
-Doracle.coherence.machine=<machine name> should be the same as the name of the host discovered in Enterprise Manager.
Note:
If you are using JMX credentials, you must set the following additional start arguments.-
-Dcom.sun.management.jmxremote.ssl=true -
-Dcom.sun.management.jmxremote.authenticate=true
If no JMX credentials are used, you must set these arguments to false.
24.3.1.2.2 Example Start Script for All Other Coherence Nodes
An example start script for all other Coherence nodes is given below:
#!/bin/sh

COH_OPTS="$COH_OPTS -cp $CP"
$JAVA_HOME/bin/java $COH_OPTS
-Dtangosol.coherence.management.extendedmbeanname=true
-Dtangosol.coherence.management.remote=true
-Dcom.sun.management.jmxremote.authenticate=false
-Dcom.sun.management.jmxremote.ssl=false
-Doracle.coherence.home=<coherence home>
-Dtangosol.coherence.member=<unique member name>
-Doracle.coherence.machine=<hostname>
-Dcom.tangosol.net.DefaultCacheServer
24.3.1.3 Testing the Configuration
To test the Coherence cluster configuration for use in Enterprise Manager, you must verify that the central management (JMX) node has information regarding the managed objects of all other Coherence cluster nodes, caches, services, and so on. Additionally, you must verify that the central management node is accessible remotely, either throuhg <hostname>:<port> OR the JMX Service URL. If JMX credentials are used, they should also be specified.
24.3.1.3.1 Verifying Remote Access for the MBean Objects Using JConsole
JConsole is a Java tool available through JDK. You can use this to verify remote access to the MBean objects of entire Coherence cluster nodes, caches, services, and so on.
To verify remote access, open JConsole and select "New Connection". In New Connection page, select Remote Process and provide connection details where <hostname> is the name of the machine where central management node is running, <port> is what you have specified in the -Dcom.sun.management.jmxremote.port parameter while starting the management node. If successful, you will see the MBean object tree.
If you see MBeans for all Coherence nodes in the System MBean Browser or JConsole, you can now discover and monitor the Coherence cluster and its associated elements in Enterprise Manager.
24.3.2 Configuring a Managed Coherence Cluster
To monitor a Weblogic-Coherence 12.1.2 cluster using Oracle Enterprise Manager FMW Plug-in 12.1.0.6.0, you must:
-
Configure the Coherence managed servers with a set of Coherence and JMX system properties (start arguments).
-
Configure one of the managed servers as a central JMX management node.
Note: This configuration is supported only with Coherence 12.1.2.
Fig Figure 24-4 shows the configuration required to monitor a managed Coherence cluster.
24.3.2.1 Configuring the Central Management Node
To monitor WebLogic - Coherence clusters, you must configure one of the managed servers as a central JMX management node by adding the server startup arguments and the class path.
Note: Cluster management operations such Stop/Start Nodes, Stop/Start Cluster, and provisioning of new nodes or Coherence managed servers and clusters are not applicable for managed Coherence servers since these are done through the Weblogic domain and its components.
24.3.2.1.1 Adding the Server Start Arguments
The following start arguments must be added to one of the managed servers to configure it as the central management node.
-Dtangosol.coherence.management.extendedmbeanname=true–Dcom.sun.management.jmxremote
-Dtangosol.coherence.management=all
-Dcom.sun.management.jmxremote.port=<port number>
-Dtangosol.coherence.distributed.localstorage=false
-Dtangosol.coherence.mbeans=<em-mbeans.xml>
-Doracle.coherence.machine=<machine name> - the machine name and the name of the discovered host must be the same.
-Djavax.management.builder.initial=weblogic.management.jmx.mbeanserver.WLSMBeaServerBuilder
Note:
If you are using JMX credentials, you need to add the following additional start arguments.-Dcom.sun.management.jmxremote.ssl=true
-Dcom.sun.management.jmxremote.authenticate=true
If no JMX credentials are used, these parameters must be set to False.
24.3.2.1.2 Additional Class Path
The following additional paths must be included in the managed server class path:
-
Path to the Enterprise Manager custom jars,
coherenceEMIntg.jarand thebulkoperationsmbean.jar. These jars are available in<OEM agent PLUGIN_HOME>/<MIDDLEWARE_MONITORING_PLUGIN_DIR>/archives/coherencedirectory. -
Path to the Coherence custom MBean configuration. If you already have a custom MBean configuration, then you will have to add the custom MBeans to this configuration file. If a custom MBean configuration is not present, you must create a new custom MBean configuration file and add the custom MBeans.
24.3.2.1.3 Enterprise Manager Custom MBeans
The custom MBean configuration must be specified in a configuration file by using the -Dtangosol.coherence.mbeans start parameter. For instance, if the name of the custom MBean configuration file is em-custom-mbeans.xml, the start parameter must be specified as -Dtangosol.coherence.mbeans=em-custom-mbeans.xml. If you already have a custom MBean configuration definition, you can add the following MBean configuration to that definition.
<mbeans>
<mbean id="100">
<mbean-class>oracle.sysman.integration.coherence.CacheDataManager
    </mbean-class>
<mbean-name>type=Custom,name=CacheDataManager
    </mbean-name>
<enabled>true</enabled>
</mbean>
<mbean id="110">
<mbean-class>oracle.as.jmx.framework.bulkoperations.BulkOperationsMBeanImpl
    </mbean-class>
<mbean-name>type=BulkOperations
</mbean-name>
<enabled>true</enabled>
</mbean>
</mbeans>
24.3.2.1.4 Example Class Path
For example, if the custom MBeans and custom jar files are present in the "/opt/oracle/middleware/user_projects/domains/base_domain/config/coherence" directory, you must add the following to the managed server class path:
/opt/oracle/middleware/user_projects/domains/base_domain/config/coherence:/opt/oracle/middleware/user_projects/domains/base_domain/config/coherence/coherenceEMIntg.jar:/opt/oracle/middleware/user_projects/domains/base_domain/config/coherence/bulkoperationsmbean.jar
24.3.2.2 Configuring All Other Managed Servers
Apart from configuring one of the managed servers as a central management node, you also need to configure all Coherence managed servers with additional Coherence specific system properties (start arguments).
24.3.2.2.1 Additional Server Start Arguments
The following start arguments must be added to the entire Coherence cluster.
-Dtangosol.coherence.management.extendedmbeanname=true
-Dtangosol.coherence.management.remote=true
-Doracle.coherence.machine==<machine name> - the machine name and the name of the discovered host must be the same.
Note:
If you are using JMX credentials, you need to add additional start arguments (where are these described?). If no JMX credentials are used, it is recommended that you set the following parameters:-Dcom.sun.management.jmxremote.ssl=false
-Dcom.sun.management.jmxremote.authenticate=false
24.3.2.3 Testing the Configuration
In order to test Weblogic-Coherence cluster configuration for use in OEM, you will have to verify that central management (JMX) node has information regarding managed objects of all other Coherence cluster nodes, caches, services, etc. Additionally, you should verify that the central management node is accessible remotely, either using <hostname>:<port> OR JMX Service URL. If JMX credentials are used they should also be specified.
To test if the Weblogic-Coherence cluster configuration can be monitored in Enterprise Manager, you must verify that the central management (JMX) node has information regarding managed objects of all other Coherence cluster nodes, caches, services, and so on. Additionally, you must verify if the central management node is accessible remotely, either using <hostname>:<port> or JMX Service URL. If JMX credentials are used, they must also be specified.
24.3.2.3.1 Verifying Coherence Cluster MBean Objects Using Fusion Middleware Control
You can verify that the central management (JMX) node has information regarding managed objects of entire Coherence cluster nodes, caches, services, and so on through the FMW Control System MBean Browser.
To do so, login to FMW Control and navigate to the Home page of the Weblogic managed server configured as central management (JMX) node. From the WebLogic Server menu, select System MBean Browser.
In the System MBean Browser, expand Application Defined MBeans. This shows the MBean objects for the entire Coherence cluster. All other managed servers that are participating in Coherence cluster will have MBean objects pertaining to it.
24.3.2.3.2 Verifying Coherence Cluster MBean Objects Remote Access Using JConsole
JConsole is a Java tool available through JDK. You can use this tool to verify remote access to the MBean objects of entire Coherence cluster nodes, caches, services, and so on.
Open JConsole and select New Connection. In New Connection page, select Remote Process and provide connection details. <hostname> is the name of the machine where the central management (JMX) node is running. <port> is what you have specified in the -Dcom.sun.management.jmxremote.port argument while starting the management node.
If the new connection is successfully started, you will see the MBean Object tree. If you see MBeans for all Coherence managed servers in System MBean Browser or JConsole, you are ready to perform discovery in Enterprise Manager. Once discovered, you can used Enterprise Manager to monitor Coherence cluster.
Note:
Cluster management operations such Stop/Start Nodes, Stop/Start Cluster, Provisioning of new nodes or Coherence managed servers and cluster are not supported.24.4 Discovering Coherence Targets
Enterprise Manager monitors the entire Coherence cluster and its artifacts. The key targets that can be monitored are Oracle Coherence Cluster, Oracle Coherence Node, and Oracle Coherence Cache. The Oracle Coherence Cluster target provides a high level view of the health of the entire cluster. The Oracle Coherence Node and Oracle Coherence Cache are child targets of the Oracle Coherence Cluster. In addition to monitoring the above target types, additional Coherence components such as Services, Connections, and Applications can also monitored.
Note:
To provision new Coherence nodes, start, and stop nodes, the Management Agent must be installed on all the hosts on which the nodes are running. For more details on provisioning Coherence nodes, see the Enterprise Manager Lifecycle Management Guide.Prerequisites
Before you discover a Coherence cluster, you must have completed the following tasks:
-
Created a Coherence cluster with one JMX management node and one or more other nodes.
-
Started the JMX management node with the necessary parameters as defined in Section 24.3.1.1, "Creating and Starting a JMX Management Node".
-
Started the other nodes with the necessary parameters as defined in Section 24.3.1.2, "Configuring All Other Nodes".
To discover an already running Coherence cluster, follow these steps:
-
Login to Enterprise Manager as an administrator with the Add Target privilege.
-
From the Targets menu, select Middleware. You will see a list of Middleware targets.
Note:
Alternatively, you can add a Coherence target from the Setup menu. From the Setup menu, select Add Target, then select Add Targets Manually. In the Add Targets Manually page, select the Add Non-Host Targets Using Guided Process option. Follow the steps in the wizard to add the Coherence target. -
Select Oracle Coherence in the Add drop-down box and click Go. The Oracle Coherence Cluster: Discover Cluster, Node, and Cache Targets page is displayed.
-
On this page, specify the connection details of the Coherence JMX management node. This is required to discover the Coherence cluster, node and cache targets. You can select either of the following options to provide MBean Server details:
-
Host, Port, and Service: Enter the following details:
-
Management Node Host: Select the host on which the Management Node is running.
-
JMX Remote Port: The port used for the JMX RMI connection. If you are using the MBean connector for Coherence MBeans, specify the
tangosol.coherence.management.remote.connectionportproperty.Note:
It is recommended that you use thecom.sun.management.jmxremote.portproperty. -
Service Name: The service name used for the connection. The default is
jmxrmi.
-
-
MBean Server Credentials: If JMX authentication is used, specify the user name and password required to access the MBean Server.
-
JMX Service URL: Service URL that will be used for the connection. If you enter the URL, the values specified in the Machine Name, Port, Communication Protocol, and ServiceName fields will be ignored. For example,
service:jmx:rmi://localhost:3000/jndi/rmi://localhost:9000/server. For more details on the URL format, refer tohttp://java.sun.com/j2se/1.5.0/docs/api/javax/management/remote/JMXServiceURL.htmlYou may need to specify the Service URL only in complex cases like when the RMI registry and the MBean Server ports are different. It is recommended that you use the Machine Name and Port option for the MBean server connection.
-
-
Select the Management Agent that will be used to monitor the Coherence target and click Continue.
-
The details of the discovered targets are displayed. Click Add Targets to add these targets to Enterprise Manager.
Note:
To automatically discover a new node or target in Enterprise Manager, you must refresh the cluster as described in Section 24.4.1, "Refreshing a Cluster".24.4.1 Refreshing a Cluster
You can manually synchronize the cluster targets with the running Coherence cluster. Click Refresh Cluster from the Oracle Coherence Cluster menu. A message indicating that new Coherence nodes and caches that have been discovered will be added as Enterprise Manager targets is displayed. Nodes are updated if there are any changes to their attributes. Click Continue to refresh the cluster. This ensures that the latest changes are applied.
Click Close. The list of nodes and caches that can be added are displayed. Click Add Targets to add the targets to the cluster.
Note:
Decommissioned nodes and caches will not be removed during the Refresh process. You must remove them manually.24.4.2 Managing Mis-configured Nodes
While discovering a Coherence cluster, all nodes must be started with the proper guidelines as described in Section 24.3, "Configuring a Coherence Cluster for Monitoring".
If a node is improperly configured or has been started without the necessary guidelines, it will be categorized as a mis-configured node and will not be a part of the newly discovered cluster. During discovery, if any improperly configured nodes are present in the cluster, you will see the following screen:
This indicates that there are some improperly configured nodes in the cluster. Click Close. The following page is displayed.
The list of improperly configured nodes along with the reasons for their failure is listed in this page. You can either choose to cancel the discovery process and fix these nodes or continue with the discovery with the properly configured nodes.
If you wish to continue with the discovery process, follow the steps listed in Section 24.4, "Discovering Coherence Targets".
If you click Cancel, the discovery process is aborted and the cluster is not refreshed. If mis-configured nodes are found during the Refresh process, they must be fixed before you can run the Refresh operation again. See Section 24.4.1, "Refreshing a Cluster" for details) and then discover the cluster.
24.5 Enabling the Management Pack
You must enable the Management Pack for Oracle Coherence if you want to use any custom features. If the management pack is not enabled, you can access only the Home pages and base platform features. To enable the Management Pack, do the following:
-
From the Setup menu, select Management Packs, then select Management Pack Access.
-
Select Oracle Coherence in the Search drop-down list and click Go.
-
All the Coherence targets being monitored are displayed. Check the Pack Access Agreed check box for the Coherence target and click Apply to enable the Management Pack.
Note:
Apart from enabling the Management Pack, you must grant VIEW privileges to all users on the Management Agent that is monitoring the Coherence targets. This ensures that all targets being monitored by the Management Agent are visible to the user.