12 Discovering and Monitoring the SOA Suite
This chapter describes how you can discover and configure the components of the SOA Suite 11g using Enterprise Manager Cloud Control.
In particular, this document covers the following:
12.1 New Features in This Release
The new features that have been introduced in the 12c version of the SOA Suite are:
-
Error Hospital allows you to view an aggregate count of errors that have occurred in all SOA Composites deployed in the SOA Infrastructure. The Error Hospital page is available at the SOA Infrastructure level, where system-wide faults data is aggregated. When accessed at the partition level, the Error Hospital page is limited to faults data associated only with that partition. You can perform the following operations:
-
Generating a Error Hospital Report
-
Performing a Bulk Recovery
-
-
Target Setup Verification allows you to perform a series of tests that can help diagnose and repair setup problems required for target monitoring.
-
Fault Management allows you to perform a real-time search and recovery of faults and BPEL/BPMN messages. In addition to this, you can perform bulk recovery of faults, and track and monitor the status of submitted bulk recoveries.
-
Oracle RAC Database Support for Dehydration Store Performance allows you to monitor the health and performance of RAC-based Dehydration Store for Multi Data Source or GridLink Data Source type.
-
Instance Tracing Enhancements allows you to perform the following operations:
-
Tracing instances using the Instance Id.
-
Viewing payloads for BPEL component instances.
-
Tracing instances at SOA Infrastructure level.
-
-
Support Work Bench Enhancements is enhanced to generate BPEL and Mediator dumps. The enhanced capability is supported for SOA PS6 (11.1.1.7.0).
-
SOA Composite Targets Discovery is enhanced to discover only the default versions of SOA Composites, if required. Unlike the previous release, where the default and only option was to discover all the deployed SOA Composites, you can now choose to only discover the default versions of the SOA composites. To do so, follow the steps listed in Section 12.5.1.
-
SOA Diagnostic Reports collects fine-grained data about messages or instances which help you monitor and diagnose the execution and performance issues of BPEL and Mediator Components.
12.2 List of Supported Versions
The following are the versions of the SOA Suite that are supported in Enterprise Manager Cloud Control 12c:
-
11.1.1.2.0 (PS1)
-
11.1.1.3.0 (PS2)
-
11.1.1.4.0 (PS3)
-
11.1.1.5.0 (PS4)
-
11.1.1.6.0 (PS5)
-
11.1.1.7.0 (PS6)
-
12.1.0.3.0 (SOA 12c)
12.3 Monitoring Templates
The following Oracle-certified default templates are being shipped for Enterprise Manager Cloud Control 12c Release 2 and Enterprise Manager Cloud Control 12c Release 3 agents. Table 12-1 describes the available templates, and the agents to which they apply:
Table 12-1 Monitoring Templates
| Target Type | Agent Name | Template Name |
|---|---|---|
|
SOA Infrastructure |
PS1 Agent |
Oracle Certified Fusion Apps Template for SOA Infrastructure for FMW Plugin 12.1.0.3.0 |
|
SOA Infrastructure |
PS1 Agent |
Oracle Certified FMW Template for SOA Infrastructure for FMW Plugin 12.1.0.3.0 |
|
SOA Infrastructure |
PS3 Agent |
Oracle Certified Fusion Apps Template for SOA Infrastructure |
|
SOA Infrastructure |
PS3 Agent |
Oracle Certified FMW Template for SOA Infrastructure |
|
SOA Composite |
PS1 Agent |
Oracle Certified Fusion Apps Template for SOA Composite for FMW Plugin 12.1.0.3.0 |
|
SOA Composite |
PS1 Agent |
Oracle Certified FMW Template for SOA Composite for FMW Plugin 12.1.0.3.0 |
|
SOA Composite |
PS3 Agent |
Oracle Certified Fusion Apps Template for SOA Composite |
|
SOA Composite |
PS2 and PS3 Agent |
Oracle Certified FMW Template for SOA Composite |
Note:
The templates created using older versions of OMS (Enterprise Manager Cloud Control 12c Release 2, Enterprise Manager Cloud Control 12c BP1, and so on) should not be used in Enterprise Manager Cloud Control 12c Release 3.12.4 Overview of the Discovery Process
This section describes the overall process involved in discovering and monitoring SOA Suite in Enterprise Manager Cloud Control. Follow the instructions outlined against each step in this process to successfully discover and monitor the SOA Suite.
Table 12-2 Understanding the Discovery Process
| Oracle SOA Suite Version | Application Server Deployed To | Discovery Mechanism | Process |
|---|---|---|---|
|
Oracle SOA Suite |
Oracle WebLogic Managed Server |
Manual Discovery |
|
12.5 Discovering the SOA Suite
This section describes the procedure for discovering the SOA Suite 11g.
12.5.1 Discovering the SOA Suite
You can use a local or a remote Management Agent to perform the discovery process. as follows:
Discovering the SOA Suite Using a Local Agent
If you use a local agent, you need to use a Management Agent that is running on the same host as the Administration Server.
-
From the Targets menu, select Middleware.
Oracle Enterprise Manager Cloud Control displays the Middleware page that lists all the middleware targets being monitored.
-
On the Middleware page, from the Add list, select Oracle Fusion Middleware / WebLogic Domain and click Go.
-
On the Find Targets page, specify the Administration Server Host, Port, Username, Password, and Agent (local or remote) details.
In the Advanced section, select the JMX Protocol from the list. By default, the Discover Application Versions appears checked which enables administrators to discover all versions of deployed SOA Composites. However, if you uncheck this option, then you can discover only the latest default version of SOA composites.
Note:
When the SOA Infrastructure application is down, if you uncheck the Discover Application Versions check box, then, only composites with single version is discovered. If there are composites with multiple versions, they are ignored.Note:
-
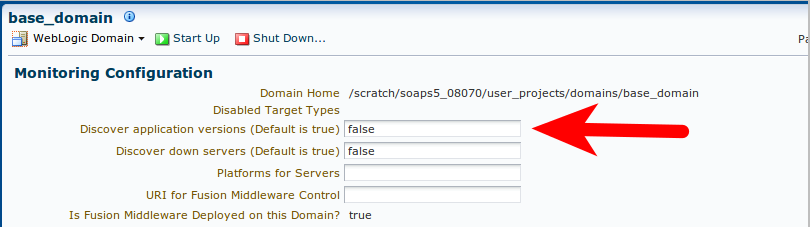
If you have targets which were discovered with the Discover Application Versions box checked (which is the default, see Figure 12-1), but now want to disable this option, perform the following steps:
-
Go to the WebLogic Domain target page.
-
On the Monitoring Configuration page, update the value of Discover application versions to false. (See Figure 12-2.)
-
Perform a domain refresh
Doing this will discover new composite targets (without any version numbers in their names) that will not contain the metric history from the previous targets.
-
-
Once you are in a state where you have composite targets without version numbers in their names, if you add more SOA composite versions, the version specified as the default version in the SOA Suite will be monitored. Historical metrics will be retained on the same target whenever the default version changes.
Click Continue.
-
-
You will return to the Middleware page. You will see the SOA instances under the WebLogic Domain.
Note:
SOA Composites that are created after the discovery of SOA Suite Domain are not displayed automatically. To view all the SOA Composites, navigate to the Home page of the WebLogic Server target and select the Refresh Domain option from the menu.
Discovering the SOA Suite Using a Remote Agent
You can discover the SOA Suite using a remote agent which may be running on a host that is different from the host on which the Administration Server is running. In this case, you may not be able to provision SOA Artifacts remotely, or capture the host metrics.
To collect metric data, ensure that you copy the jar files listed in Table 12-3 to the Agent Home Directory, which is located at: $AGENT_HOME/plugins/oracle.sysman.emas.agent.plugin_<plugin version>/archives/jlib/extjlib. If the extjlib directory does not exist, it can be created. This step is required only if you are using a remote agent to monitor the SOA Suite.
Table 12-3 Metric Data Collection
| SOA Target | Files Names |
|---|---|
|
SOA 11g targets |
|
|
SOA PS3 (11.1.1.4.0) and higher targets |
|
|
SOA 12c targets |
jrf-api.jar To enable Error Hospital and Instance Tracing, you additionally require:
|
|
To enable BPMN instance tracing |
For SOA 11g targets:
For SOA 12c targets:
|
12.5.2 Configuring the SOA Suite
After discovering the SOA Suite 11g, you must perform the following additional configuration steps:
-
Set the SOA database details like the host name, port, and credentials.
-
From the Targets menu, select Middleware.
Oracle Enterprise Manager Cloud Control displays the Middleware page that lists all the middleware targets being monitored.
-
Select a SOA Infrastructure home from the list and click Configure. The Monitoring Configuration page is displayed.
-
Set the SOA database details in the Monitoring Configuration page.
-
-
Set preferred credentials for the WebLogic Domain.
-
From the Setup menu, select Security, then select Preferred Credentials.
-
Select the Oracle WebLogic Domain target and click Managed Preferred Credentials.
-
Select WebLogic Administrator Credentials in the Target Preferred Credentials and click Set.
-
Enter the user name and password in the Select Named Credentials window and click Save.
-
12.6 Metric and Collection Settings
For the following metrics the collection schedule is not available on the Metric and Collection Settings page. Detailed steps to update the collection intervals are listed in the following table:
Table 12-4 Metric and Collection Settings
| Target Type | Metric Name | Collection Interval Update Steps |
|---|---|---|
|
SOA Infrastructure |
Response |
Navigate to the associated weblogic server where SOA is deployed, to do so, follow these steps:
Note: This change is applicable to all the applications deployed in that WebLogic server. |
|
SOA Composite |
Response |
For SOA PS5 (11.1.1.6.0) or earlier, follow these steps:
For SOA PS6 (11.1.1.7.0) onwards, navigate to the associated SOA Infrastructure where SOA composite is deployed. To do so, follow these steps:
Note: This change is applicable to all the SOA composites which are deployed in that SOA Infrastructure |
|
SOA Composite |
SOA Composite - Component Detail Metrics |
Navigate to the associated SOA Infrastructure where soa composite is deployed. To do so, follow these steps:
|
|
SOA Composite |
SOA Composite - Recoverable And Rejected Messages |
Navigate to the associated SOA Infrastructure where soa composite is deployed. To do so, follow these steps:
|
12.6.1 Viewing Application Dependency and Performance (ADP) Metrics
If the SOA instance is being monitored by the ADP Manager, additional metrics such as Arrival Rate, Minimum, Maximum, and Average Response Time will be collected.
Tip:
The ADP Manager must be registered before it can collect the metric data. For details on registering the ADP Manager, see Oracle Enterprise Manager Cloud Control Advanced Installation and Configuration Guide.12.7 Setting Up and Using SOA Instance Tracing
Instance Tracing allows you to trace the message flow across SOA Composites and SOA Infrastructures monitored by Oracle Enterprise Manager Cloud Control. The flow of message can be traced across servers, clusters, and WebLogic domains.
The section contains the following topics:
12.7.1 Configuring Instance Tracing (SOA 11g Targets Only)
Before enabling Instance Tracing, ensure that you meet the following prerequisites:
-
Ensure that the SOA infrastructure is monitored by an Oracle Management Agent (Management Agent).
-
Set the following as preferred credentials:
-
Credentials of the host on which the SOA server is running.
-
Administrator credentials of the Oracle WebLogic Domain.
-
To enable Instance Tracing for any SOA Infrastructure 11g instances involved in executing composite instances:
-
Set the preferred credentials for the WebLogic Domain. To do so, follow the steps listed in Section 12.5.2.
-
To view the state of the listed SOA instances, enable the Capture Composite State flag on the instance tracing page as follows:
-
On the SOA Infrastructure home page, from SOA Infrastructure menu, select Fusion Middleware Control.
-
Navigate to the home page of the SOA Infrastructure target.
-
From SOA Infrastructure menu, select SOA Administration, and then click Common Properties.
-
On the SOA Infrastructure Common Properties page, select the Capture Composite Instance State check box.
-
12.7.2 Setting Search Criteria for Tracing an Instance
Select the appropriate search link based on the version of your SOA target:
Instance Tracing for SOA 11g Targets
To search for faults and messages, enter details as described in the following table, and click Search.
Table 12-5 Setting Search Criteria
| Field | Description |
|---|---|
|
Instance ID |
Specify the ID of the instance that is to be traced. The flow trace is a runtime trail of a message flow identified by an Instance ID. It enables you to track a message flow that crosses instances of different composites. |
|
Start Time From - To |
The time period the instances were initiated. |
|
Name |
The name of the instance. |
|
Conversation ID |
The conversation ID of the instance. |
|
Instance Count |
The number of instances that should be retrieved by the Search. |
|
ECID |
The ECID enables you to track the message flow across different SOA Composite instances that span across SOA Infrastructure. |
|
Composite Name |
The name of the composite. Use this to restrict your search for business flows to a specific composite. Note that wild-card search is supported. For example, ( |
Click Search after you have specified the required criteria. A list of Instance IDs that meet the criteria are displayed. Click Trace to generate trace data for the specified instance and period.
Note: To trace an instance, credentials must be set for the WebLogic domain of each SOA Infrastructure monitored by Oracle Enterprise Manager Cloud Control and for the host on which the Management Agent monitoring each SOA Infrastructure application is present.
Click the Instance ID link to see the flow trace which includes the list of SOA Infrastructure instances involved in the flow, faults, the domain, and the list of faults.
Instance Tracing for SOA 12c Targets
To search for faults and messages, enter details as described in the following table, and click Search.
Table 12-6 Setting Search Criteria
| Field | Description |
|---|---|
|
Time |
Use this filter to restrict your query to a specific time in the past. A time filter is required to search for faults. Ensure that you enter appropriate values in Instance Created From and Instance Created To fields. By default, all the instances created in the last one day are displayed. Additionally, you can add the following filters: Instance Updated If you set this value to None, then it means that instance updated filter is not set at all. Fault Occurred |
|
Composite |
Use to restrict your search for business flows to a specific composite. If you trace an instance at the composite level, then the Composite value is pre-populated. However, if you trace an instance at SOA infrastructure level, then select any of the following:
Click the torch icon. In the Search and Select Targets wizard, select the target name from the table and click Select. A faults search is performed on the selected composite. |
|
Sensor |
Ensure that you select a composite to view the sensors associated with it. |
|
Flow Instance |
Flow ID: use this to search for the flow ID of the business flow instance. Flow Correlation ID: use this to search for the flow correlation ID of the business flow instance. Initiating ECID: use this to search for the ECID of the business flow instance. Flow Instance Name: use this to search for unique system and business identifiers that help you isolate a specific flow instance Composite Instance Name: use this to specify the name or title of the composite instance name. |
|
State |
Select one of the following states: Select Active to search active instances. If you select a blank, then the filtering is ignored.
Select Inactive to search inactive instances. If you select a blank, then the filtering is ignored.
|
|
Fault |
Use to limit your search for business flows to only those with faults. If you leave this field blank, the Fault filter is ignored. To search for faults in any state, select All. To search for faults in a particular state, select one of the following:
|
|
Fault Type |
To search for all types of faults, select All To search for a particular type of fault, select one of the following:
|
|
Fault Owner |
Use the Name field to enter a fault owner name. Ensure that the name entered is in the following format:
Use this to further filter your search for faulted business flows to stuck flows awaiting a particular type of recovery action from the administrator. To search for faults belonging to all the owners, select All. To drill down to a particular fault owner, select one of the following:
|
|
Fault Details |
You can fine grain your search parameters to drill down to granular result by providing all or some of the following details:
Expand Other to display additional fields for filtering:
|
|
Restrict Search Rows |
By default, the search results are restricted to 10 rows in the table. If you want to modify this limit or restriction, enter a suitable value. The highest value you can enter as the limit depends on the limit set on the OMS. When no limit is set on the OMS, the limit that is honored by default is 2000, so the default range you can enter in the Restrict Search Result (rows) field is 1 to 2000. To modify this maximum limit set on the OMS, run the following command: Note: The higher the value you set as the limit, the longer the time it takes to retrieve the faults, and that entering a higher value than the default in Restrict Search Result (rows) can lead to longer time to get the faults, and hence a longer load time. |
12.7.3 Tracing an Instance Within a SOA Infrastructure
To trace an instance within the context of a SOA Infrastructure, follow these steps:
-
In Cloud Control, from the Targets menu, select Middleware.
-
On the Middleware page, click the target you are interested in. For example, SOA Infrastructure.
-
From the SOA Infrastructure menu, select Trace Instance.
-
On the Instance Tracing page, perform instance search. To do so, see Table 12-6.
-
To trace an instance across composites, do the following:
-
For a SOA 12c target, click Flow Instance ID.
-
For a SOA 11g target, click Composite Instance ID.
You can further drill down to the component audit trail by clicking the component instance available in the trace table.
-
-
Click OK.
12.7.4 Tracing Instance Across SOA Infrastructures
To trace an instance across SOA Domains, follow these steps:
-
In Cloud Control, from the Targets menu, select Middleware.
-
On the Middleware page, click the target you are interested in. For example, SOA Infrastructure.
-
From the SOA Infrastructure menu, select Trace Instance.
-
On the Instance Tracing page, perform instance search. To do so, see Table 12-6.
-
Select an instance, and Click Trace.
-
In the Trace Instance dialog box, click Add to add the other SOA Infrastructure targets where this SOA instance has been executed.
-
In the Search and Add targets dialog box, select the other SOA Infrastructure targets, and click Select.
-
Click Set to set the WebLogic Domain Credentials, and Host Credentials if you haven't already set them.
-
Click OK. A flow trace job is scheduled to run immediately to collect the instance trace data across domains. On completion, a status is displayed in Trace Job Status column. Click the status link to drill down to the Flow Trace page.
-
Click OK.
12.8 Monitoring Dehydration Store
The Dehydration Store Diagnostics feature provides a dedicated view that allows you to analyze the behavior of the SOA Dehydration database. You can monitor SQL performance metrics and table growth specifically in the context of the SOA Suite's use of the database. The view displays both throughput and wait bottleneck data which allows you to monitor the general health of the target database instance. Using Active Session History, you can track usage data and display it as a table space chart, a growth rate chart, or an execution chart.
Note:
In addition to monitoring Oracle standalone database, the Dehydration Store now supports reviewing the general health of the RAC database engine, and identifying problems that are causing performance bottlenecks.You can also monitor Real Application Cluster (RAC) databases. For RAC, you can monitor Multi Data Source and GridLink Data Sources. In RAC scenario, the dehydration store tab lists all the associated database nodes in the form of a drop down menu. You can select any particular instance from the Show Database Instance menu, and view the associated metric data.
12.8.1 Enabling Monitoring of the SOA Dehydration Store
To configure and enable monitoring of the SOA Dehydration Store, follow these steps:
-
From the Targets menu, select Databases to check if the database target representing the SOA Dehydration Store has been discovered in Enterprise Manager.
-
Check if at least one configuration for the SOA Infrastructure and WebLogic Server targets is available.
-
On the monitoring configuration for the SOA Infrastructure target, the following fields related to SOA Repository must be configured:
-
SOA Repository Connection Descriptor: The connection URL string specified for the JDBC data source on the WebLogic server. This configuration is collected as part of the configuration collection mechanism for the SOA Server instance. For example,
On Single Instance Database
host:port/sid(or service_name)On RAC Database
-
Multi Data Source:
(DESCRIPTION=(ADDRESS_LIST=(ADDRESS=(PROTOCOL=TCP)(HOST=<Host
1>)(PORT=<Port 1>)))(CONNECT_DATA=(SERVICE_NAME=<Service
Name>)(INSTANCE_NAME=<Instance 1>)));(DESCRIPTION=(ADDRESS_LIST
=(ADDRESS=(PROTOCOL=TCP)(HOST=<Host 2>)(PORT=<Port 2>)))(CONNECT_DATA
=(SERVICE_NAME=<Service Name>)(INSTANCE_NAME=<Instance 2>)))
-
GridLink:
(DESCRIPTION=(ADDRESS_LIST=
ADDRESS=(PROTOCOL=TCP)(HOST=<Host>)(PORT=<Port>)))
(CONNECT_DATA=(SERVICE_NAME=<Port>)))
-
-
SOA Repository Host Name: The database listener host for the SOA database instance. This is optional if the connection string has already been configured.
-
SOA Repository Port: - The database listener port for the SOA database instance. This is optional if the connection string has already been configured.
-
SOA Repository Schema Name: The schema name configured for SOA Dehydration Store.
-
SOA Repository User Name: The schema name configured for SOA Dehydration Store.
-
SOA Repository Password: The password for the SOA schema user.SOA Repository SID: The SID for the SOA database instance.
-
If you do not see data after these configuration details have been specified, you must wait for the next collection interval.
12.8.2 Viewing the SOA Dehydration Store Data
To view the dehydration diagnostics data, follow these steps:
-
From the Targets menu, select Middleware, then click on a SOA Infrastructure target.
-
In the SOA Infrastructure Home page, click the Dehydration Store tab.
-
The following details area displayed:
-
Throughput indicators that provide details of the general health of the database instance.
-
Wait bottleneck issues related to the CPU, I/O, and Wait events.
-
Tablespace utilization for the SOA schema.
-
Performance data recorded by the ASH.
-
Key SOA tables and tablespace details related to the SOA schema.
-
12.9 Viewing the Service Topology
The Service Topology provides a graphical end to end view of the composite applications. It depicts the various application components and their interactions happening at runtime. It allows you to view the service level dependencies among the components and provides key performance statistics and incidents information for them. Composite applications are distributed in nature and this view helps you quickly visualize the structure, status, availability, dependencies, configuration changes, and performance of business-critical distributed applications from one place and easily identify any availability or performance issues.
The Service Topology Viewer shows the following:
-
Service to Service Calls: It allows you to view the Service to Service calls between any two SOA entities (Composites/J2EE Applications/OSB/BPEL 10g instances) by clicking the link between the entities.
-
Dependency Highlighting: It allows you to view the dependencies for any service. If you click on a service, all the services that it is dependent on and vice versa are highlighted.
-
Database Associations: Shows all the databases used by the SOA Composites, BPEL 10g instance and J2EE applications.
-
External Services: Shows the services that are used by a SOA Composite application but are external to it or not managed by Enterprise Manager Cloud Control.
12.10 Publishing a Server to UDDI
To publish a service to UDDI, navigate to the Services and References Home page, select a service from the table and click Publish to UDDI from the menu. The Publish Service to UDDI window is displayed with the following fields:
-
Service Name: The name of Web Service to be published to the UDDI Registry. This is a Read Only field.
-
Service Description: The description of the selected Web Service.
-
Service Definition Location: The URL location of the Service Definition. This is a Read Only field.
-
UDDI Source: A logical name for an external UDDI registry source. Select the UDDI Source from the drop-down list.
-
Business Name: The name of the data structure in the UDDI registry. Select a Business Name that has been registered with the UDDI from the list.
Click OK to start the process that publishes the web service to UDDI or click Cancel to cancel publishing the service.
12.11 Generating SOA Reports
This section describes the steps to use Enterprise Manager to print SOA reports using BI Publisher Enterprise Reports, or using Information Publisher.
12.11.1 Generating SOA Reports Using BI Publisher
Oracle Business Intelligence (BI) Publisher is an enterprise reporting solution for authoring, managing, and delivering highly formatted documents. Oracle BI Publisher also allows you to build custom reporting applications that leverage existing infrastructure. Reports can be designed using familiar desktop products and viewed online or scheduled for delivery to a wide range of destinations.
The following table describes the SOA reports that can be generated using BI Publisher:
| SOA Report | Description |
|---|---|
|
SOA Infrastructure Performance Report |
The SOA Infrastructure Performance Summary Report provides information about the average response time, error rate, throughput, system faults, business faults, web service policy violation faults for selected SOA Composite. It displays a chart with the top 5 SOA Composites based on average response time or throughout across the selected SOA composites for specified time period. The report can be sorted based on performance metric (average response time) or the usage metric (instance count). As part of the report parameters setting, you can use options that allow you to select the SOA Composite by Partitions or by selecting individual composites. |
|
SOA Composite Detailed Performance Report |
The SOA Composite Detailed Performance Summary Report provides information about the average response time, error rate, throughput, system faults, business faults, web service policy violation faults for each selected composite assembly part such as service, reference, and service component. This is an in-depth report that provides complete details about the each assembly part in the SOA Composite.It displays a chart with the top 5 SOA Composites based on average response time or throughout across the selected SOA Composites for a specified time period. The report can be sorted based on performance metric (average response time) or the usage metric (instance count). As part of the report parameters setting, you can use options that allow you to select the SOA Composite by Partitions or by selecting individual composites. |
|
Top 5 SOA Composites (From Dehydration Store) |
This report shows how the SOA Composites have been performing over a period of time. Charts listing the top 5 SOA composites are displayed and critical metric data for all the SOA composites are displayed in a table. |
To print SOA reports using BI Publisher, follow these steps:
-
From the Enterprise menu, select Reports, then select BI Publisher Enterprise Reports.
Enterprise Manager Cloud Control displays the login page for BI Publisher Enterprise Reports.
-
Enter your credentials to log into BI Publisher.
-
The BI Publisher Enterprise page displays, showing you Recent reports, Others, and Favorites. You can use this page to create a new report, submit a report job, and perform other tasks.
-
Click the Report you want to view.
-
You can select different filters such as SOA Composite Name, Partition Name, Date Range, and so on to view the report. You can also select a Sort By option to sort the report on Composite Name, Sorted Instances, and so on.
-
You can refresh the report anytime by clicking the Refresh icon on the upper right side of the SOA Report tab. You can hide or display the search parameters by clicking the Parameters icon. You can choose to view the report in various formats such as HTML, PDF, RTF, Excel, and PowerPoint by clicking the View Report icon. Likewise you can display more available actions by clicking the Actions icon. For more help about using BI Publisher, click the help icon.
12.11.2 Generating SOA Reports Using Information Publisher
This section describes the procedure to create SOA Reports.
Note:
These reports can be generated only for SOA 11g targets. Information Publisher reports are not supported for SOA 12c targets.-
From the Targets menu, select Middleware, and click on a SOA Infrastructure target. The SOA Infrastructure Home page appears.
-
From the SOA Infrastructure menu, select the Information Publisher Reports.
The out-of-box SOA reports are displayed under the SOA Performance Reports section.
-
Select a report from the section (for example, you can select Pending Instance Statistics) and click Create Like. The Create Report Definition page is displayed.
-
In the General page, enter the following details:
-
Enter the BPEL Process Name as the title.
-
Click the Set Time Period to set the time interval for the report.
-
Click the Run report using target privileges of the Report Owner (SYSMAN) check box in the Privileges section.
-
-
Click the Elements tab and click the Set Parameters icon for the Pending Instance Statistics Element in the table.
-
In the Set Parameters page, click the torch icon to select a Composite Name. The Result Set Size with default values for the Pending Instance Statistics report is displayed.
-
Select a Component Name from the list, enter the Result Set Size and click Continue to return to the Elements page.
-
The selected target name is displayed in the Elements table.
-
To schedule periodic report generation, click the Schedule tab.
-
Specify the schedule type and other details and click OK.
-
You will return to the Report Home page where the newly scheduled report is displayed in the table. Click the report name to view the details.
12.11.3 Generating SOA Diagnostic Reports
To collect the SOA diagnostics data from SOA Dehydration Store, and generate report, follow these steps:
-
Ensure that you set the SOA Database Host Credentials and SOA Database user Credentials before scheduling a SOA diagnostics job.
-
From the Targets menu, select Middleware.
-
On the Middleware page, select a SOA Infrastructure target. The SOA Infrastructure home page is displayed.
-
From the SOA Infrastructure target menu, select Diagnostics, then click Schedule SOA Diagnostics Job.
-
In the General section, enter a name and description for the job.
-
In the Target section, select a database instance from the table. To add an instance, click Add. From the target selector dialog box, select a database instance, and click Select.
-
In the Parameters section, enter the following details:
-
Report Time Period is the period for which you want to collect the diagnostic data. This is a mandatory field. By default, data for last one week is collected.
-
Optionally, you can select a desired value for System Backlog Report.
-
To get details about open instances, completed instances, or rolled back instances for a product, you must choose the Instance Growth Report.
-
To get a report on invoke process delays, callback delays, callback processing delays, select BPEL Execution Report, and BPEL Performance Report
-
To understand invoke delays, and engine time better, select Mediator reports like Mediator Execution Report, and Mediator Performance Report.
-
To understand pending events in an event queue, select EDN Report.
-
To get a summary of all the faults, select Fault Summary Report and Detailed Fault Report
-
To view the human workflow tasks, select Human Workflow Report.
-
To receive a SOA Diagnostic report through an email, select Email Notification.
-
Subject, enter a subject for your email.
-
E-mail To, add contacts to whom this report must be sent.
-
E-mail Cc add contacts who must be copied on the diagnostics report email.
-
-
In the Credentials section, provide the SOA Infra Dehydration Store user Credentials, and host credentials for the SOA Dehydration Store.
-
In the Schedule section, you can choose to either run job once or repeatedly. You can additionally schedule to run the job immediately or at a later point.
-
The Access table gives a summary of all the users and roles who have access to this job.
-
Click Submit.
12.11.4 Viewing SOA Diagnostics Jobs
To view all the SOA diagnostics jobs, follow these steps:
-
Ensure that you set the SOA Database Host Credentials and SOA Database user Credentials before scheduling a SOA diagnostics job.
-
From the Targets menu, select Middleware.
-
On the Middleware page, select a SOA Infrastructure target. The SOA Infrastructure home page is displayed.
-
From the SOA Infrastructure target menu, select Diagnostics, then click All SOA Diagnostics Job.
This page displays all the diagnostics jobs that have run already, and are scheduled to run.
12.12 Provisioning SOA Artifacts and Composites
The SOA Artifacts Deployment Procedure allows you to:
-
Provision SOA Artifacts from a reference installation or from a gold image
-
Create a gold image of the SOA Artifacts
-
Provision SOA Composites either from the Software Library or from another accessible location.
For more details on the SOA Artifacts Deployment Procedure, see the Enterprise Manager Administrator's Guide for Software and Server Provisioning and Patching.
12.13 Diagnosing Issues and Incidents
To access the diagnostic data for problems and incidents, access the Support Workbench page. To do so, navigate to the SOA Infrastructure Home page, and from the SOA Infrastructure menu, select Diagnostics, then select Support Workbench.
Enter the credentials for the host on which the WebLogic server is running and the WebLogic credentials for the WebLogic server. Click Continue to log into the Support Workbench page. On this page, you can do the following:
-
View problem or incident details.
-
View, create, or modify incident packages.
-
View health checker findings
-
Close resolved problems.
12.14 Verifying Target Monitoring Setup
As a prerequisite, verify the target monitoring setup before you perform any operations on the SOA infrastructure. Use the Target Setup Verification page to run a series of diagnostic scans and verify if you have met all functional as well as system-level prerequisites required for monitoring targets in Enterprise Manager. This helps you discover and repair all target monitoring setup-related issues beforehand.
This section describes the following:
Note:
If you see the following error when you try to access the Target Setup Verification page, then you must upgrade the Management Agent version to 12.1.0.3 or higher:Current agent version is not supported for Functionality Check scan. Upgrade to 12.1.0.3.0 agent version or higher for performing this scan.
Note:
You will not be able to click on the torch icon available next to the database system field in Dehydration Store repair pop-up if an association exists between the database system and SOA infrastructure. It is enabled only when the association is missing. When the association is missing, you can select appropriate database system target from target selector popup. Pop-up can be launched by clicking on the torch icon.12.14.1 Running Functionality-Level Diagnostic Checks
To run diagnostic scans on the functionalities associated with an Enterprise Manager target and to identify any setup issues, follow these steps:
-
From the Targets menu, select Middleware.
-
On the Middleware page, click the target you are interested in. For example, SOA Infrastructure.
-
On the Home page of the target, from the target-specific menu, select Target Setup, and click Verification.
-
On the Target Setup Verification page, in the Functionality Check section, click Scan.
-
If setup problems are detected, repair them. See Section 12.14.3.
12.14.2 Running System-Level Diagnostic Checks
To run diagnostic scans on the system components that monitor an Enterprise Manager target and check their availability rate, follow these steps:
-
From the Targets menu, select Middleware.
-
On the Middleware page, click the target you are interested in. For example, SOA Infrastructure.
-
On the Home page of the target, from the target-specific menu, select Target Setup, and click Verification.
-
On the Target Setup Verification page, in the System Check section, click Scan.
Note:
-
The Availability(%) column shows the availability rate of the target types. Click the rate to drill down and view more details.
-
The Time since last collection (min) column shows the total time elapsed since the last metric collection for the target.
-
12.14.3 Repairing Target Monitoring Setup Issues
To repair any target monitoring setup-related issues, follow these steps:
-
Run functionality-level diagnostic scan to identify setup-related issues. See Section 12.14.1.
-
If setup issues are found in the Functionality Check section, click the repair icon against the functionality that requires to be fixed.
In the dialog that appears, enter the required details, and click Re-Scan and Save to validate the credentials, run the functionality check again, and save the details in Enterprise Manager. If you are sure the credentials are correct, then click Save to save the details without running the check again.
Note:
-
The host credentials you are expected to provide are credentials of the host where the Management Agent, which monitors the SOA Infrastructure, is running.
-
While repairing dehydration store issues, you are required to provide SOA dehydration store configuration details such as the database system and the SOA repository credentials.
If the configuration information has been collected, and if the association between the database system and the SOA infrastructure already exist, then the database system is prepopulated by default, and you need to enter only the credentials of the SOA repository. Otherwise, click the torch icon and manually select the database system with which the SOA infrastructure communicates, and enter the credentials of the SOA repository.
The connection descriptor is prepopulated by default is an editable field, and appears in multiple rows if it is an Oracle RAC database. Do not modify the descriptor unless you want to correct it.
The data source type is displayed only if the database system is an Oracle RAC database. The data source type can be either Multi Data Source or GridLink Data Source. Also note, that the data source type appears as 'NA' if details of the database system do not match with the connection descriptor.
-
12.15 Searching Faults in the SOA Infrastructure
This section describes how you can search faults in the SOA infrastructure. In particular, you can perform the following tasks:
12.15.1 Overview of Faults and Fault Types in SOA Infrastructure
The following are the types of SOA composite application faults displayed in Enterprise Manager Cloud Control:
-
Business: Application-specific faults that are generated when there is a problem with the information being processed (for example, a social security number is not found in the database).
-
System: Network errors or other types of errors such as a database server or a web service being unreachable.
-
Oracle Web Service Manager (OWSM): Errors on policies attached to SOA composite applications, service components, or binding components. Policies apply security to the delivery of messages.
The following are the categories of SOA composite application faults in Enterprise Manager Cloud Control:
-
Recoverable
-
Business faults and some specific system faults
-
Oracle Mediator input file path and output directory mismatch
-
An Oracle BPM Worklist user is not authorized to perform relevant (expected) actions
-
-
Nonrecoverable
-
Rejected messages
-
Most system faults
-
Non-existent references
-
Service invocation failures
-
Policy faults
-
-
Rejected Messages
A fault is classified as a rejected message based on where it occurs. If a fault occurs before entering a SOA composite, without generating a composite instance, it is classified as a rejected message. A system or a policy fault can be identified as a rejected message.
12.15.2 Overview of the Recovery Actions for Resolving Faults
Recovery actions enable you to recover or resolve the SOA composite application faults. The following describes the recovery actions supported for different SOA engines.
Table 12-8 Overview of the Recovery Actions for Resolving Faults
| Recovery Action | Description | Applicable To SOA Engine Type |
|---|---|---|
|
Retry |
Retries the instance directly. An example of a scenario in which to use this recovery action is when the fault occurred because the service provider was not reachable due to a network error. The network error is now resolved. |
|
|
Abort |
Terminates the entire instance. |
|
|
Continue |
Ignores the fault and continues processing (marks the faulting activity as a success). |
|
|
Rethrow |
Rethrows the current fault. BPEL fault handlers (catch branches) are used to handle the fault. By default, all exceptions are caught by the fault management framework unless an explicit rethrow fault policy is provided. |
|
|
Replay |
Replays the entire scope again in which the fault occurred. |
|
12.15.3 Prerequisites for Searching, Viewing, and Recovering Faults
Meet the following prerequisites before searching, viewing, and recovering SOA composite application faults:
-
Ensure that the SOA infrastructure is monitored by an Oracle Management Agent (Management Agent) that is running on the same host as the SOA infrastructure. At the moment, there is no support for searching, viewing, and recovering faults from a SOA infrastructure that is monitored by a remote Management Agent.
-
Set the following as preferred credentials. These credentials can be set from the Target Setup Verification page. To do so, from the Targets menu, select Middleware. On the Middleware page, click the target you are interested in. For example, SOA Infrastructure. On the Home page of the target, from the target-specific menu, select Target Setup, and click Verification:
-
Credentials of the host on which the SOA server is running.
-
Administrator credentials of the Oracle WebLogic Domain.
-
12.15.4 Searching and Viewing Faults
To search and view SOA composite application faults, follow these steps:
-
Meet the prerequisites. See Section 12.15.3.
-
From the Targets menu, select Middleware.
-
On the Middleware page, click the SOA Infrastructure target.
-
On the SOA Infrastructure target page, click Faults and Rejected Messages.
-
In the Faults and Rejected Messages tab, set the search criteria. See Section 12.15.4.1.
-
Click Search.
-
View the faults:
-
To know the total faults in the SOA infrastructure, see Total Faults in SOA Infrastructure, which is placed in the footer of the results table.
-
To know the number of faults displayed in the table (out of the total number of faults in the SOA infrastructure), see Displayed Faults, which is placed in the footer of the results table.
-
To view details of each fault, see the results table.
-
To hide or unhide columns in the table, from the View menu, select Columns, then select the column name you want to hide or unhide.
-
To filter or perform a fine search for a particular column, enter a search keyword in the textbox placed above the column header. See Section 12.15.4.7
For example, to filter and list all faults related to the BPEL engine type, in the Engine Type column, type
bpel. -
To sort the fault details alphabetically, click the column header based on which you want to sort the details.
-
To find out the number of rows to which the search results have been restricted, see the note below the table.
For example, the following note appears if the rows were restricted to 20.
This table of search results is limited to 20 fault instances. Narrow the
results by using the search parameters.
-
12.15.4.1 Setting Search Criteria
To search for faults and messages, enter details as described in the following table, and click Search.
Table 12-9 Setting Search Criteria
| Field | Description |
|---|---|
|
Time |
Use this filter to restrict your query to a specific time in the past. A time filter is required to search for faults. Ensure that you provide values in the Fault Time From and Fault Time To fields. For example, enter 1/13/14 5:33:25 AM and 2/13/14 5:33:25 AM in the respective fields to query for all the faults that have occurred in this one month time window. |
|
Composite |
Use to restrict your search for business flows to a specific composite. Click the torch icon. In the Search and Select Targets wizard, select the target name from the table and click Select. A faults search is performed on the selected composite. |
|
Flow Instance |
Enter the Flow ID to isolate a specific flow instance. For each workflow involving different composites a unique flow ID gets generated. When there is an error in any component in a particular flow, the ID gets listed on the Faults and Rejected Messages tab. This ID is useful in assessing the error trend. |
|
Fault |
Use to limit the search for business flows to only those with faults. If you leave this field blank, the Fault filter is ignored. To search for faults of any type, select All or blank. To search for faults in a particular type, select one of the following:
|
|
Fault Type |
To search for all types of faults, select All To search for a particular type of fault, select one of the following:
|
|
Fault Owner |
Use this to further filter your search for faulted business flows to stuck flows awaiting a particular type of recovery action from the administrator. To search for faults belonging to all the owners, select All. To drill down to a particular fault owner, select one of the following:
|
|
Fault Details |
You can fine grain your search parameters to drill down to granular result by providing all or some of the following details:
Expand Other to display additional fields for filtering:
|
|
Restrict Search Rows |
By default, the search results are restricted to 10 rows in the table. If you want to modify this limit or restriction, enter a suitable value. The highest value you can enter as the limit depends on the limit set on the OMS. When no limit is set on the OMS, the limit that is honored by default is 2000, so the default range you can enter in the Restrict Search Result (rows) field is 1 to 2000. To modify this maximum limit set on the OMS, run the following command: Note: The higher the value you set as the limit, the longer the time it takes to retrieve the faults, and that entering a higher value than the default in Restrict Search Result (rows) can lead to longer time to get the faults, and hence a longer load time. |
12.15.4.2 Finding Total Faults in the SOA Infrastructure
To find the total faults in the SOA infrastructure, follow these steps:
-
Search for faults in the SOA infrastructure. See Section 12.15.4.
-
Once the search results appear, see Total Faults in SOA Infrastructure, which is placed at the bottom-right corner, below the table.
Note:
While retrieving the total faults in the SOA infrastructure, the Restrict Search Result (rows) field in the search criteria is not considered. For example, if there are a total of 700 faults, and if you enter 500 for this field, then the search is performed to list only 500 faults in the table, but the Total Faults in SOA Infrastructure field displays 700.
12.15.4.3 Limiting Faults Searched and Retrieved from the SOA Infrastructure
When you search for faults in the SOA infrastructure, the search might result in numerous faults. By default, the search results are restricted to 500 rows in the table. However, you can choose to modify this limit if you want.
To modify the limit, set the Restrict Search Result (rows) field to a suitable value while setting the search criteria (see Section 12.15.4.1). Then search.
The highest value you can enter as the limit depends on the limit set on the OMS. When no limit is set on the OMS, the limit that is honored by default is 2000, so the default range you can enter in the Restrict Search Result (rows) field is 1 to 2000.
To modify the maximum value set on the OMS, run the following command:
emctl set property -name oracle.sysman.core.uifwk.maxRows -value <max_limit_value>
Caution:
The higher the value you set as the limit, the longer it takes to retrieve the faults. Entering a higher value than the default in Restrict Search Result (rows) field can lead to longer time to get the faults, and therefor result in a longer load time.12.15.4.4 Searching Only Recoverable Faults
There might be numerous faults in the SOA infrastructure, but you can search and view only the recoverable faults. For example, there might be 700 faults in total, but there may be only 550 recoverable faults; you can search and list only those 550 faults if you want.
To search only for recoverable faults, while searching for faults (see Section 12.15.4), set the search criteria with the Fault State list set to Recoverable. If you set it to All, then faults that are recoverable and not recoverable are searched and listed.
12.15.4.5 Searching Faults in a Particular Service Engine
There might be faults across various service engines such as BPEL, BPMN, Mediator, Business Rules, and Human Workflow. You can search and view only faults occurred in a particular service engine.
To search for faults in a particular service engine, set the search criteria with the Component Type list set to a particular service engine of interest (see Section 12.15.4.1). Then search.
12.15.4.6 Searching Faults by Error Message
There might be numerous errors in the SOA infrastructure, but you might be interested only in those errors that contain some keywords of your interest. For example, you might be interested only in errors that contain the word ORAMED. You can search and view faults with such keywords.
To search faults by error messages, set the search criteria with the Error Message Contains field set to some keywords of your interest (see Section 12.15.4.1). Then search.
Note:
-
By default, the entered keywords are searched anywhere in the error message.
-
The keywords you enter are case sensitive.
-
The only wildcard character permitted is
%,which signifies all or anything after, before, or between two keywords. For example,BPEL%faultwill result in faults with the error messageBPEL is a fault.
12.15.4.7 Filtering Displayed Search Results
When you set the search criteria and search for faults in the SOA infrastructure, and when the search results appear in the results table, you can filter the search results further to show only those rows or fault instances that interest you, based on a keyword entered in the column header.
For example, from the displayed fault instances, to filter and view only the bpel service engine's results, enter the keyword bpel in the textbox placed above the Component Type column header. This is essentially the value shown in the bpel fault instance row for the Component Type column.
To filter the displayed search results, follow these steps:
-
Search for faults in the SOA infrastructure. See Section 12.15.4.
-
Once the results appear in the table, in the textbox placed above the header of the column you want to filter, enter a search keyword.
For example, to filter and list all faults related to the BPEL engine type, in the textbox placed above the Engine Type column header, type
bpel.
12.15.5 Recovering a Few Faults Quickly (Simple Recovery)
To recover only a few SOA composite application faults quickly, follow these steps:
-
Meet the prerequisites. See Section 12.15.3.
-
From the Targets menu, select Middleware.
-
On the Middleware page, click the SOA Infrastructure target.
-
On the SOA Infrastructure target page, click Faults and Rejected Messages.
-
In the Faults and Rejected Messages tab, set the search criteria. See Section 12.15.4.1.
-
Click Search.
-
In the table, select one or up to 5 faults at a time, and from the Recovery Options menu, select an appropriate recovery action that matches your requirement. For information on the recovery actions, see Section 12.15.2.
-
Enterprise Manager displays an informational message with one of the following mentioned to confirm whether or not it can submit the recovery job successfully. Click OK, and take the necessary action if required.
-
If you have selected more than 5 faults, then the recovery job is not submitted. Select 5 or fewer faults, and try again. Alternatively, select 5 or more, and try a bulk recovery. See Section 12.16.
-
If there are no recoverable faults, then the recovery job is not submitted.
-
If there are faults that are recoverable and not recoverable, then the recovery job is submitted only for recoverable jobs. You can track the recover job. See Section 12.16.4.1.
-
-
Perform Step (1) to Step (5) again to verify if the faults you selected for recovery still appear in the search results. If they do not appear, then the recovery operation for those faults has been successfully submitted.
12.16 Recovering Faults in Bulk
The process of recovering similar type of faults in a single operation is called Bulk Recovery. In case of SOA 11g targets all the Recoverable faults can be recovered through bulk recovery option, and similarly for SOA 12c targets, all the Recovery required faults can be recovered through bulk recovery.
Note:
For SOA 12c targets, you can supply either the composite details or the fault details to recover faults. It is mandatory that you supply at least one of these parameters, if not, bulk recovery cannot be performed. For SOA 11g targets, you must supply the composite details.Bulk recovery can be performed when the following criteria are met:
-
All faults to be recovered are in the same partition.
-
The recovery required count is greater than zero.
-
The Fault Owner type of the selected row is bpmn, mediator or bpel.
-
A state for the fault is specified.
You can perform bulk recovery from Faults and Rejected Messaged tab, or Error Hospital tab available on the SOA Infrastructure home page. This way, the context of the fault is maintained, and is accordingly pre-populated on the Create Bulk Recovery Page. However, if you access it from the Bulk Recovery Jobs page, you will need to enter all the details afresh.
In particular, this section covers the following:
12.16.1 Performing Bulk Recovery from the Bulk Recovery Jobs Page
To directly recover a large number of faults from the SOA database, follow these steps to perform a bulk recovery:
-
Meet the prerequisites. More
-
From the Targets menu, select Middleware.
-
On the Middleware page, select a SOA Infrastructure target.
-
On the SOA Infrastructure target page, from the SOA Infrastructure menu, select Fault Management, then select Bulk Recovery.
-
On the Bulk Recovery Jobs page, click Create Job.
-
On the Create Bulk Recovery Job, in the Composite section, enter the following details:
-
Select Initiating or Participating composite type from the menu.
-
Click Add to add additional composites for which faults must be searched. In the Search and Select dialog box, select all the targets that you want to add to the list, and click Select.
-
Click Remove to delete a composite.
Note:
You can add only up to 10 composites. -
-
In the Time section, enter the suitable values in the following fields to filter out the faults that you want to recover: Instance Created From, Instance Created To, Instance Updated, Fault Time To, and Fault Time From.
-
In the Fault Details section, set the details of the faults you want to recover. To do so, see Table 12-9.
-
In the Recovery Options section, set the recovery and batch parameters. To do so, see Section 12.16.1.2.
-
In the Job Parameters section, schedule the bulk recovery job. To do so, see Section 12.16.1.3.
-
To verify the number of faults that will be recovered for the given criteria, click Estimate Faults.
A pop-up appears informing you of the total number of faults in the SOA Infrastructure based on the criteria you have set. Based on the count, you can decide whether or not you want to proceed. If required, you can adjust the settings. For example, you can modify the fault time period.
-
Click Submit.
-
Track the status of the bulk recovery job. For more information, see Section 12.16.4.1.
Note:
For a SOA 12c target, faults with following recovery states are recovered:-
Admin Recovery
-
Mediator Recovery
-
BPEL Invoke Message Recovery
-
BPEL Callback Message Recovery
-
BPEL Activity Message Recovery
However, faults with recovery states EDN Recovery, Rejected Messages Recovery, and Human Workflow Recovery, cannot be recovered.
For a SOA 11g target, all faults with state Recoverable are recovered. However, faults with recovery states BPEL messages, rejected messages, and human workflow faults cannot be recovered.
12.16.1.1 Setting Fault Details for Recovering Faults in Bulk
To set the fault details while recovering faults in bulk, follow these steps:
-
In the Fault Details section, from the Engine Type menu, select an engine, so that fault search could be restricted to the selected type.
-
From the Fault Type menu, select the type of fault you want to recover. This could be, System Faults, Business Faults, or OWSM Faults.
-
In the Error Message Contains field, enter a keyword you are looking for in the error messages so that only faults with such error messages are recovered.
-
In addition to this, you can refine your fault search by providing details like Fault Name, Fault Code, HTTP Host, and JNDI Name.
12.16.1.2 Setting Recovery and Batch Details for Recovering Faults in Bulk
To set the recovery and batch details for recovering faults in bulk, follow these steps:
-
In the Recovery Options section, from the Recovery Action list, select a recovery action.
-
By default, Batch by Fault Time is enabled so that faults can be grouped into multiple, smaller units or batches based on the time they were created, and run sequentially. Oracle recommends that you keep the option enabled to simplify the fault recovery process. However, if you do not want to create batches for some reason, then deselect this option.
-
If you keep the Batch by Fault Time option enabled, then do the following:
-
By default, the batches are created with faults that occurred within every 60 minutes. If you want to change this time period, then enter a value in minutes in the Batch Time Period field. The minimum time period is 5 minutes and the maximum time period is 360 minutes.
-
By default, the delay time between two batches is set to 300 seconds. If you want to change this delay time, then enter a value in seconds in the Delay between batches (sec) field. The minimum delay time is 5 seconds and the maximum delay time is 900 seconds.
-
Batch Recovery esures that all the faults that occurred in the specified fault time period are recovered in a phased manner. For example, lets assume:
Fault time period: 1 Mar 2013  2.00am to 1 Mar 2013 3.00am
Batch time period: 10mins
Batch Delay: 300secs (i.e 5mins)

This means, there are 60mins/10mins = 6 batches in all. The first batch recovers
faults between 2.00am to 2.10am. The second batch recovers faults between 2.10am
to 2.20am, and so on. After each batch runs, there is a delay of 300secs (5mins),
after which the next batch execution begins.
12.16.1.3 Scheduling Bulk Recovery Jobs to Run Once or Repeatedly
To schedule bulk recovery jobs, on the Create Bulk Recovery page, in the Job Parameters section, select one of the following options:
-
To run the jobs only once, select one of these options:
-
Immediately, if you want to run the job immediately.
-
Later, if you want to run the job just once, at a schedule date and time, and not immediately.
-
-
To run the jobs repeatedly at a set frequency, select an appropriate value from the Repeat menu, and set the corresponding frequency.
Note: For a repeating job, ensure that you do not set a custom time period. If you do so, the job cannot track the faults properly, and in-turn recovers the same faults again and again. Instead, you can set a relative time period. For example, select Last 1Day from the Fault Occurred menu.
-
To set a grace period, select Do not run if it cannot start within, and set an appropriate grace period.
A grace period is a period of time that defines the maximum permissible delay when attempting to run a scheduled job. If the job system cannot start the execution within a time period equal to the scheduled time + grace period you set, then it skips the job. By default, all jobs are scheduled with indefinite grace periods.
12.16.2 Performing Bulk Recovery from Faults and Rejected Messages Tab
To recover a large number of faults from the SOA database, follow these steps:
-
From the Targets menu, select Middleware.
-
On the Middleware page, select a SOA Infrastructure target.
-
On the SOA Infrastructure target page, click Faults and Rejected Messages tab.
-
In the Faults and Rejected Messages tab, set the search criteria. To do so, see Table 12-9.
-
Click Search.
-
In the table, select one or more faults, and click Bulk Recover.
-
In the Navigate to Bulk Recovery wizard, select the details that you want to carry forward from the selected faults in the table to the Create Bulk Recovery page. Select one of more from the following list: Composite, Fault start time, Fault end time, and Error message for the fault, and click OK.
-
In the Composites section, the composite name and partition field is pre-populated with the values passed from the Faults and Rejected Messages tab. If you want to add additional composites that need recovery, then click Add. You can add only up to 10 composites.
-
In the Time section, if you have passed custom values for Faults Start Time and Fault End Time, then the Instance Created From and Instance Created To fields are also updated with the same values. You can change these values if required. However, if you select Last 1 Day, then all the faults that have occurred across instances in the last one day since the previous bulk recovery job was submitted are displayed.
-
In the Fault Details section, the Error Message field may appear pre-populated if you have passed error message attribute using the Navigate to Bulk Recovery dialog box. If not, you can update this section. For more information, see Section 12.16.1.1.
-
In the Recovery Options section, set the recovery and batch parameters. To do so, see Section 12.16.1.2.
-
In the Job Parameters section, schedule the bulk recovery job. To do so, see Section 12.16.1.3.
-
To verify the number of faults that will be recovered for the given criteria, click Estimate Faults.
A pop-up appears informing you of the total number of faults in the SOA Infrastructure based on the criteria you have set. Based on the count, you can decide whether or not you want to proceed. If required, you can adjust the settings. For example, you can modify the fault time period.
-
Click Submit.
-
Track the status of the bulk recovery job. For more information, see Section 12.16.4.1.
-
Search for faults again (How?) to verify if the faults you selected for recovery still appear in the search results.
If they do not appear, then the recovery operation for those faults has been successful.
Note:
For a SOA 12c target, faults with following recovery states are recovered:-
Admin Recovery
-
Mediator Recovery
-
BPEL Invoke Message Recovery
-
BPEL Callback Message Recovery
-
BPEL Activity Message Recovery
However, faults with recovery states EDN Recovery, Rejected Messages Recovery, and Human Workflow Recovery, cannot be recovered.
For a SOA 11g target, all faults with state Recoverable are recovered. However, faults with recovery states BPEL messages, rejected messages, and human workflow faults cannot be recovered.
12.16.3 Performing Bulk Recovery from the Error Hospital Tab
To recover a large number of faults from the SOA database, follow these steps:
-
Meet the prerequisites. Section 12.15.3.
-
From the Targets menu, select Middleware.
-
On the Middleware page, click the SOA Infrastructure target.
-
On the SOA Infrastructure target page, click Error Hospital.
-
In the Error Hospital tab, set the search criteria. To do so, see Table 12-11.
-
Click Search.
-
In the table, select one or more faults, and click Bulk Recover.
-
The composite section appears pre-populated with Composite, Composite type, and Fault Owner details. You cannot add more composites or edit this section.
-
In the Time section, details like Instance Created From and Instance Created to are picked up from the Error Hospital page. Additionally, if you had provided Fault Created From, Fault Created To, Instance Updated From and Instance Updated To values, then these values will also appear pre-populated on this page. If not, you can enter these values to refine your search.
-
In the Fault Details section, usually, one of the fault parameters appear pre-populated, by default, it is fault name. However, if you have grouped your Error Hospital Report by other categories, then those values are populated accordingly. To refine your search, you may update the other fields in this section. For more information, see Section 12.16.1.1.
-
In the Recovery Options section, set the recovery and batch parameters. To do so, see Section 12.16.1.2.
-
In the Job Parameters section, schedule the bulk recovery job. To do so, see Section 12.16.1.3.
-
To verify the number of faults that will be recovered for the given criteria, click Estimate Faults.
A pop-up appears informing you of the total number of faults in the SOA Infrastructure based on the criteria you have set. Based on the count, you can decide whether or not you want to proceed. If required, you can adjust the settings. For example, you can modify the fault time period.
-
Click Submit.
-
Track the status of the bulk recovery job. For more information, see Section 12.16.4.1.
-
Search for errors again (How?) to verify if the errors you selected for recovery still appear in the search results.
If they do not appear, then the recovery operation for those errors has been successful.
Note:
For a SOA 12c target, faults with following recovery states are recovered:-
Admin Recovery
-
Mediator Recovery
-
BPEL Invoke Message Recovery
-
BPEL Callback Message Recovery
-
BPEL Activity Message Recovery
However, faults with recovery states EDN Recovery, Rejected Messages Recovery, and Human Workflow Recovery, cannot be recovered.
For a SOA 11g target, all faults with state Recoverable are recovered. However, faults with recovery states BPEL messages, rejected messages, and human workflow faults cannot be recovered.
12.16.4 Tracking Bulk Recovery Jobs
This section describes the following:
12.16.4.1 Tracking Bulk Recovery Jobs, and Viewing Their Results and Errors
To track bulk recovery jobs and view their results and errors, follow these steps:
-
From the Targets menu, select Middleware.
-
On the Middleware page, click the SOA Infrastructure target.
-
On the SOA Infrastructure target page, from the SOA Infrastructure menu, select Fault Management, then select Bulk Recovery.
-
On the Bulk Recovery Jobs page, you can view details such as the job name, the date and time when it ran or is scheduled to run, the user who scheduled the job, the current status of the job, the faults that were recovered and not recovered.
Note:
-
This page lists only those jobs that ran in the last three days, and only for the current user. The list also include jobs submitted via EM Command Line Interface (EM CLI).
-
The Recovered Faults column displays the number of faults for which the recovery has been attempted by the SOA Suite so far for the job. The Not Recovered Faults column displays the number of faults for which the recovery could not be attempted by the SOA Suite due to some errors.
-
-
Click the name of the job for which you want to view more details such as its actual results, the job failure errors, and the recovery errors.
Enterprise Manager displays the Bulk Recovery Job Details page that provides the following information.
Section Name Description Results Provides the status of the recovery job, essentially details such as the composite selected for recovery, the ID of the faults selected for recovery, and the recovery attempt status of the faults, which can be either Recovered or Not Recovered. Note: The recovery status indicates only the recovery attempt status, and not the actual recovery status of the fault. To know the actual recovery status, search for the fault ID. How?
Job Failure Error Provides details of the failed recovery jobs. The errors are shown from the last point of failure of the job. The details include:
-
Failed Step Name, the name of the step of the recovery job that failed. The job has two steps, mainly pre-check and recover_faults. The recover_faults step runs once for every batch of the job, or only once if batching is not enabled.
-
Failed Step Output, the output of the failed job step.
-
Parsed Error Message, any known error message that is as part of the step output.
-
Composite, the name of the composite selected for the recovery job.
-
Fault Time From, the start date and time from when faults occurred and for which the recovery job was submitted
-
Fault Time To, the end date and time till when faults occurred and for which the recovery job was submitted
-
Error Details, the error indicating that the status of the recovery job could not be retrieved. This means that the recovery was attempted for the given composite and time period, but there was a time-out while retrieving the status.
To verify if the faults were recovered, search for the faults for the given composite and time period again. How?
To run the recovery job again, reduce the batch time period to a value lower than the value you entered earlier, and submit the bulk recovery job again (see Section 12.16).
-
12.16.4.2 Creating Bulk Recovery Jobs Using EMCLI and Web Services
You can create Bulk Recovery Jobs for a SOA Infrastructure Target from the command line using EM CLI, from EM Job Systems using Web-Service Interface, or from Cloud Control UI.
This section contains the following sections:
12.16.4.2.1 Creating Bulk Recovery Jobs Using EMCLI
In EM CLI, use EM job system's get_jobs command to submit bulk recovery jobs. The inputs to the job are supplied using a properties file.
To create the bulk recovery job using EMCLI, follow these steps:
-
Log in to EMCLI. For example:
emcli login -username=sysman
-
Find out the input parameters to be entered in the property file to run the bulk recovery job. To do so, run the following command:
emcli describe_job_type -type=SOABulkRecovery
-
Use any editor to open the properties file, and provide your inputs. You can then save and close the properties file.
Using any editor, create a new text file. For example,
temp.propertiesHere's a sample Property File: target_list=<soa-infra target name>:oracle_soainfra variable.CompositeList=<composite1 target name>, <composite 2 target name> variable.BatchDelay=300 variable.BatchSize=10 variable.EnableBatching=1 variable.EngineType=BPEL variable.ErrorMsg=xxxx variable.FaultStartTime=01-01-2013 00:00:00 PST variable.FaultEndTime=01-02-2013 00:00:00 PST variable.FaultTimePeriod=Custom variable.RecoveryAction=ContinueNote:
Currently, Oracle supports only one SOA-Infrastructure target to be entered in the target_list property. -
Run the following command to submit a bulk recovery job with the updated property file as an input:
emcli create_job -name=bulk522 -job_type=SOABulkRecovery -input_file=property
file:/tmp/temp.properties
-
Set the preferred credentials or named credentials for the WebLogic Domain and SOA Server Host. By default, the job uses the preferred credentials, that is, WebLogic Administrator Credentials for the WebLogic domain and Normal Host Credentials for the SOA Server hosts.
To set the preferred credentials, run the following commands:
Setting WebLogic Domain Credentials:
emcli set_preferred_credential -target_type=weblogic_domain -target
name=<weblogic domain target name> -set_name=WLCredsNormal -credential
name=<existing named credential name> -credential_owner=<user>

Setting SOA Host Credentials:
emcli set_preferred_credential -target_type=host -target_name=<host target
name> -set_name=HostCredsNormal -credential_name=<existing named credential
name> -credential_owner=<user>
Alternately, you can override the preferred credentials by supplying the named credentials as an input to the property file for the current submission.
Following example describes how to set the named credentials for the WebLogic Domain and SOA Server host:
target_list=<SOA-Infra TargetName>:oracle_soainfra
cred.SOAAgentHostCred.<slc01nbo.us.example.com>:<host>=NAMED:xxxx
cred.SOADomainCreds.<target_name>:<target_type>=NAMED:xxxx
12.16.4.2.2 Viewing the Submitted Jobs and Outputs Using EMCLI
The following table describes certain other operations that can be performed using EMCLI commands.
Table 12-10 EMCLI Commands For Bulk Recovery
| EMCLI Command | Description | Example |
|---|---|---|
|
|
This EMCLI command to view all the Bulk Recovery Jobs that have been submitted. |
|
|
|
This EMCLI command to view the output of the Bulk Recovery job execution. To view the details of the job steps, you need to supply the Execution ID of the job. Note: The output of the job that is displayed using the EMCLI command is unstructured. For a complete and structured report of the output, log in to Enterprise Manager Cloud Control. From Enterprise menu, select Job, and then click Activity. On the Job Activity Page, in the Advanced Search region, enter the name of the job, and then click Go. Select the job, and drill down to the steps by click Expand All. |
Run the following command to get the Execution ID of the job:
Use the Execution ID in the following command to view the details of the job submitted:
|
12.16.4.2.3 Creating Bulk Recovery Jobs through Web-Service
In addition to EM User Interface and EMCLI, you can also use Web-Service Interface provided by EM job system to create Bulk Recovery Jobs. The web-service interface of the Job System is available by default in an EM installation, and the URL for the WSDL is as follows:
<protocol>://<machine>:<port>/em/websvcs/extws/JobControlService?wsdl
The EM job system web services are implemented as Simple Object Access Protocol (SOAP) end-points. Client programs can access these end-points using a variety of languages like Java, C++, and Ruby. The web service is used by sending a SOAP request message to one of the end-points, and retrieving the corresponding response message.
Typically, the operations exposed by Job system in the Web-Service Interface is very similar to the EMCLI operations such as create_job, describe_job_type, and so on.
12.16.5 WorkFlow Examples for Bulk Recovery
This section covers the following examples:
Running Bulk Recovery Job Every Night
To schedule a bulk recovery job that runs at 12.00am every night, to recovers faults that have occurred through the day:
-
In the composites section, add the desired composites.
-
In the Time section, enter the following values:
-
For a SOA 12c target, from Instance Created menu, select Custom, and provide the custom values. To recover instances created during the day alone, select Last 1 Day.
-
From the Fault Occurred menu, select Last One Day.
-
Click Estimate Faults to view the number of faults that will be recovered.
-
-
In the Fault Details section, enter appropriate values.
-
In the Recovery Option section, enter the following values:
-
Select Batch by Fault Time.
-
In Batch Time Period, enter 10 mins. This would mean that, every batch would recover faults in 10mins time window. Since you have already selected Last One day (Fault Time From value), there will be 24*60 / 10 = 124 batches in all.
-
In Delay Between Batches, enter 200 secs. This will be the delay between each batch. The main intention behind a delay is to allow the SOA System time to stabilize after each recovery.
-
-
In the Job Parameters section, enter the following values:
-
Select Immediately to start the job as soon as it is submitted.
-
From repeat menu, select Every N Days.
-
Enter Frequency as 1 day.
-
-
Click Submit.
One Time Job With Specific Time Interval to Recover Faults
To schedule a bulk recovery job that runs one time, and recover faults in a specific time interval, follow these steps:
-
In the composites section, add the desired composites.
-
In the Time section, enter the following values:
-
For a SOA 12c target, from Instance Created menu, select Custom, and provide the custom values. To recover instances created during the day alone, select Last 1 Day.
-
From the Fault Occurred menu, select Custom. Enter 3:00 am in Fault Time From field, and 4:00 am in Fault Time To fields.
-
Click Estimate Faults to view the number of faults that will be recovered.
-
-
In the Fault Details section, enter appropriate values.
-
In the Recovery Option section, enter the following values:
-
Select Batch by Fault Time.
-
In Batch Time Period, enter 10 mins. This would mean that, every batch would recover faults in 10mins time window. Since you have selected a time window of one hour (3:00 am to 4:00 am), there will be 60 / 10 = 6 batches in all.
-
In Delay Between Batches, enter 200 secs. This will be the delay between each batch. The main intention behind a delay is to allow the SOA System time to stabilize after each recovery.
-
-
In the Job Parameters section, enter the following values:
-
Select Later, and provide a date and time to schedule the job.
-
From repeat menu, select Do not repeat.
-
Enter Frequency as 1 day.
-
-
Click Submit.
12.17 Generating Error Hospital Reports
Use the Error Hospital page to view an aggregate count of errors that have occurred in all SOA Composites deployed in the SOA Infrastructure. This page does not list out individual faulted instances. To view the individual flows that have faults, go to the Faults and Rejected Messages tab on the SOA Infrastructure Home page.
The Error Hospital page is available at the SOA Infrastructure level, where system-wide faults data is aggregated. When accessed at the partition level, the Error Hospital page is limited to faults data associated only with that partition.
The Error Hospital page is arranged in the following sections:
-
Search Region: You can update the necessary filters available in the Search section to drill down to a more granular result that meets your requirements. By default, the total faults that have occurred across all instances created in the last 24 hours is displayed. You must provide the Instance Created From and Instance Created To values as they are mandatory fields. In addition to these values, you may specify a time window for the fault to restrict your query to a specific time in the past.
Additionally, you can select the fault attribute by which data is aggregated. For example, if you select Fault Code, each row in the first column represents a specific code and the remaining columns show the fault statistics aggregated for each code.
-
Error Hospital Report Table: This table displays a report based on the filters specified in the search region. The data is always aggregated by one of the primary fault attributes selected from the list such as Fault Name, Fault Code, and so on. The default aggregation is by Fault Name. This report enables you to assess the error trends. For example, aggregate by Fault Code to see which code has the most faults. You can then select a single row which has maximum faults from the table, and perform a bulk recovery.
-
Charts Region: The details of the Error Hospital Report are also available in a chart form. Essentially, the top faults aggregated by Fault Name are represented in a bar chart. The pie chart depicts the recovery required faults as against non-recoverable faults.
The major advantages are:
-
Error Hospital Report acts as a quick view of fault count for administrators to determine the error trends.
-
A consolidated report with all an aggregate error count is available on a single page.
-
You can also perform bulk recovery on a selected group of similar faults in a single operation.
-
Autoretries feature allows system to continuously retry a recoverable fault. When a fault is in recovery required state and an autoretry is setup, then a automated system call is generated at a certain interval to try and recover the error. This feature greatly benefits the Administrator as they have lesser faults to manually track.
To set the search criteria for Error Hospital, enter details as described in the following table, and click Search.
Table 12-11 Setting Search Criteria for Error Hospital
| Field | Description |
|---|---|
|
Time |
Use this filter to restrict your query to a specific time in the past. A time filter is required to search for faults. Ensure that you enter appropriate values in Instance Created From and Instance Created To fields. By default, all the instances created in the last one day is displayed. Additionally, you can add the following filters: Instance Updated Fault Occurred |
|
Composite |
Use to restrict your search for business flows to a specific composite. You can select the following option:
Click the torch icon. In the Search and Select Targets wizard, select the target name from the table and click Select. A faults search is performed on the selected composite. |
|
State |
Select one of the following states: Select Active to search active instances. If you select a blank, then the filtering is ignored.
Select Inactive to search inactive instances. If you select a blank, then the filtering is ignored.
|
|
Fault |
Use to limit the search for business flows to only those with faults. If you leave this field blank, the Fault filter is ignored. To search for faults of any type, select All or blank. To search for faults in a particular type, select one of the following:
|
|
Fault Type |
To search for all types of faults, select All To search for a particular type of fault, select one of the following:
|
|
Fault Owner |
Use the Name field to enter a fault owner name. Ensure that the name entered is in the following format:
Use this to further filter your search for faulted business flows to stuck flows awaiting a particular type of recovery action from the administrator. To search for faults belonging to all the owners, select All. To drill down to a particular fault owner, select one of the following:
|
|
Fault Details |
You can fine grain your search parameters to drill down to granular result by providing all or some of the following details:
Expand Other to display additional fields for filtering:
|
|
Restrict Search Rows |
By default, the search results are restricted to 10 rows in the table. If you want to modify this limit or restriction, enter a suitable value. The highest value you can enter as the limit depends on the limit set on the OMS. When no limit is set on the OMS, the limit that is honored by default is 2000, so the default range you can enter in the Restrict Search Result (rows) field is 1 to 2000. To modify this maximum limit set on the OMS, run the following command: Note: The higher the value you set as the limit, the longer the time it takes to retrieve the faults, and that entering a higher value than the default in Restrict Search Result (rows) can lead to longer time to get the faults, and hence a longer load time. |
In particular, you can perform the following tasks from this page:
12.17.1 Generating an Error Hospital Report
To generate and view an error counts that have occurred across all SOA Composites using the search fields, follow these steps:
-
Meet the prerequisites. See Section 12.15.3
-
From the Targets menu, select Middleware.
-
On the Middleware page, click the SOA Infrastructure target.
-
On the SOA Infrastructure target page, click Error Hospital.
-
In the Error Hospital tab, set the search criteria. For more information, see Table 12-11.
-
Click Search.
-
View the results:
-
To view the aggregate count of errors for each fault, see the Total Faults column in the results table.
-
To hide or unhide columns in the table, from the View menu, select Columns, then select the column name you want to hide or unhide.
-
To filter or perform a fine search for a particular column, enter a search keyword in the text-box placed above the column header. For more information, see Section 12.15.4.3.
-
To group the faults by different categories, select the relevant category. For more information, see Section 12.17.2.
-
To recover the faults in bulk, click Bulk Recover. For more information, see Section 12.16.3.
-
12.17.2 Customizing the Error Hospital Report
After generating the report, if you want to group the results by some other category, then follow these steps:
-
Create an error report. See Section 12.17.1.
-
In the Error Hospital page, select the fault attribute by which data is aggregated. To do so, from the Group By menu select one of the following fault attributes. By default, the faults are aggregated by the Fault Name. However, you can select any of the following options:
-
Fault Code: Aggregates the fault code.
-
Fault Name: Aggregates the fault name. This aggregation option is selected by default.
-
Fault Type: Aggregates the fault type:
-
System: Network errors or other types of errors such as a database server or a web service being unreachable.
-
Business: Application-specific faults that are generated when there is a problem with the information being processed (for example, a social security number is not found in the database.
-
OWSM: Errors on Oracle Web Service Manager (OWSM) policies attached to SOA composite applications, service components, or binding components. Policies apply security to the delivery of messages.
-
-
JNDI Name: Aggregates the JNDI name (for example,
eis/FileAdapter). -
Composite: Aggregate faults by the SOA composite application name. -
Fault Owner: Aggregate faults by the name of the service component, service binding component, or reference binding component that handled the fault. In some cases, this can be both the fault owner and fault location.
-
Fault Owner Type: Aggregates the type of component, service, or reference that handled the fault (for example, if a BPEL process service component owns the fault, BPEL is displayed).
-
Partition: Aggregates the partition of the SOA composite application in which the fault occurred.
-
HTTP Host: Aggregates the HTTP host on which the fault occurred.
-
12.18 Recovering BPEL/BPMN Messages
To find recoverable instances of the BPEL or BPMN Service Engine, follow these steps:
-
From the Targets menu, select Middleware.
-
On the Middleware page, click the SOA Infrastructure target.
-
On the SOA Infrastructure target page, from the SOA Infrastructure menu, select Service Engine, then select BPEL/BPMN. Based on the selection, the home page of the service engine is displayed.
-
On the home page, select the Recovery tab.
-
To recover messages in which faults occurred, select one or more messages in the table, up to a maximum of 5 messages at a time, and click Recover.
Search again to verify if the faults you selected for recovery still appear in the search results. If they do not appear, then the recovery operation for those faults has been successfully submitted.
Note:
To mark messages so that they are never delivered, select one or more message in the table, and click Cancel.
12.19 Troubleshooting
This section describes the errors you might encounter while discovering the SOA Suite 11g and the workaround steps you can follow to resolve each of them.
This section covers the following:
12.19.1 Discovery
The following error occurs when the SOA instances are being discovered.
| Error Message | Workaround Steps |
|---|---|
New SOA Composite deployed on the SOA Server from JDeveloper are not displayed automatically in Enterprise Manager Cloud Control. |
To discover the newly deployed SOA Composites in Enterprise Manager Cloud Control, you must run the Refresh Farm menu option for the associated WebLogic Domain. |
12.19.2 Monitoring
The following error occurs when the collection frequency causes a delay in the collection of configuration data.
12.19.3 Instance Tracing
The following error occurs when the instance is traced.
Instance Search Fails - Same reason as BPEL first column. If Management Agent is down or unreachable.
| Error Message | Workaround Steps |
|---|---|
Instance Tracing Job Fails |
|
12.19.4 Recent Faults
The following errors occur when:
-
All instances with faults are not displayed as only the last 10 values are collected.
-
The most recently collected fault instances do not appear in the Faults and Messages page.
| Error Message | Workaround Steps |
|---|---|
All instances with faults are not populated in Enterprise Manager Cloud Control. |
By default, you can only view the latest 10 faults collected during the last 15 minutes. To view additional faults, navigate to Fusion Middleware by clicking the link in the General section on the target Home page. |
12.19.5 Fault Management
This section contains the troubleshooting information for fault management:
12.19.5.1 Bulk Recovery
In general when there is a Bulk Recovery Error, follow these steps to navigate to the page that describes the errors:
-
In Cloud Control, from the Targets menu, select Middleware.
-
On the Middleware page, click the SOA Infrastructure target.
-
On the SOA Infrastructure target page, from the SOA Infrastructure menu, select Fault Management, then select Bulk Recovery.
-
On the Bulk Recovery Jobs page, select the job that has failed.
-
On the Bulk Recovery Job Details page, in the Job Failure Error section, check the Parsed Error Message and Error Details fields to understand about the error because of which the job failed.
The following are some of the error messages that you may see in the Parsed Error Message field along with their suggested fixes:
| Error Message | Workaround Steps |
|---|---|
java.lang.IllegalArgumentExcept
on: Invalid Job Identifier! The
specified identifier does not
match any valid fault recovery
jobs.
java.lang.IllegalStateException The results job xxxx are not available because the processing has not yet completed. |
|
t3://slc03dms.us.example.com:8001 javax.naming.CommunicationExce ption [Root exception is java.net.ConnectException: t3://slc03dms.us.example.com:8001 /soa-infra: Destination unreachable; nested exception is: java.net.ConnectException: Connection refused; No available router to destination] |
Ensure that the SOA Infrastructure is up and running, and submit another bulk recovery job with the same parameters. |
12.19.5.2 Fault Search and Recovery
The following error occurs when you are unable to connect to the SOA Infrastructure target:
12.19.5.3 Fault Management and Instance Tracing Errors
The following errors occur when the SOA database is not functional:
| Error Message | Workaround Steps |
|---|---|
Error occured when getting faults Java.rmi.RemoteException: EJB Exception: ; nested exception is: java.lang.RuntimeException: java.lang.RuntimeException: weblogic.jdbc.extensions.PoolD isabledSQLException: weblogic.common.resourcepool.R esourceDisabledException: Pool SOALocalTxDataSource is Suspended, cannot allocate resources to applications. |
Ensure the SOA Database is up and running. |
t3://slc03dms.us.example.com:80 01 javax.naming.CommunicationExce ption [Root exception is java.net.ConnectException: t3://slc03dms.us.example.com:80 01/soa-infra: Destination unreachable; nested exception is: java.net.ConnectException: Connection refused; No available router to destination] |
Ensure the SOA Database is up and running. |
Error occured when getting faults oracle.sysman.emSDK.agent.comm .exception.ConnectException: Unable to connect to the agent at https://slc03dms.us.example.com :3872/emd/main/ [Connection refused] |
Ensure the SOA Database is up and running. |
12.19.6 Application Dependency and Performance Integration
When you click on the Application Dependency and Performance link in the SOA Instance Home page, you may see a blank page. This error may occur if:
-
Application Dependency and Performance is not being used to monitor the SOA instance.
-
Application Dependency and Performance has not been registered in Enterprise Manager Cloud Control.
12.19.7 Information Publisher Reports
This section lists report related errors.
| Error Message | Workaround Steps |
|---|---|
Report generation fails due to invalid database details. |
|
No targets found message for Oracle SOA Composite Reports. |
You cannot use the out-of-box reports directly. You must use the Create Like option to generate custom reports based on the SOA Composite Target type. |
Report generation fails due to invalid host details. |
Set valid credentials for the host target on which the SOA Infrastructure instance is running. |
12.19.8 BI Publisher Reports
This section lists BI Publisher report related errors.
| Error Message | Workaround Steps |
|---|---|
Exception Encountered For One of SOA BIP Report If SOA Dehydration Is Not Configured |
If the SOA Dehydration store details are not configured in BI Publisher, the SOA Composite Report (from Dehydration Store) is not generated, and the following exception message is displayed:
To work around this issue, you must manually create the SOA database connection by choosing JDBC Connection from the Administration menu after the BI Publisher setup has been configured. The name of the data source name should be EMSOA. Use the following steps to create the EMSOA data source:
Once you have created the EMSOA data source, the issue should be resolved. |
12.19.9 Systems and Services
The following error occurs when you try to refresh a service that has not been created.
| Error Message | Workaround Steps |
|---|---|
Create Service option does not work. |
System and service creation depends on the configuration collection of the SOA Infrastructure and related targets. Check the log file for details. |
Refresh Service option does not work. |
The Refresh Service function works for an existing Infrastructure service. In case the service does not exist, it should be created using the Create Service menu option. |
12.19.10 BPEL Recovery
The following error occurs when invalid credentials are provided.
12.19.11 SOA License Issue
The following error occurs if the SOA Management Pack EE has not been enabled.
| Error Message | Workaround Steps |
|---|---|
The page requested is part of the SOA Management Pack EE. |
The SOA Management Pack EE must be enabled for the specific SOA Infrastructure target. To enable the license, follow these steps:
|
12.19.12 Dehydration Store Issue
Data is not displayed on the Dehydration Store page.
| Error Message | Workaround Steps |
|---|---|
Data is not displayed in the Dehydration Store page. |
This error may occur if there is a data mismatch between the values specified for the database target and the WebLogic Server Datasource. To resolve this issue, follow these steps:
|