4 Managing Oracle AVDF in Cloud Control
This chapter describes the various regions displayed on the Audit Vault and Database Firewall (AVDF) plug-in home page and includes the monitoring capabilities. The following topics are provided:
4.1 Installing the AV Agent
As part of the set up of Enterprise Manager Cloud Control 12c, most hosts and targets are already discovered by Enterprise Manager. As part of Enterprise Manager, you can use this setup to install Audit Vault Agents and Sources:
To install an Audit Vault Agent:
-
On the Audit Vault listing page, click Install.
A new page will display which has a hosts table and an Add/Remove button. Initially, the host table is blank.
-
Click Add to bring up a pop-up window to search and add hosts for which the installation should happen. The pop-up window should only show those hosts where the AVDF plug-in is installed and where the host does not yet have the AV Agent installed.
-
Enterprise Manager will auto compute the AV Agent installation directory based on the Enterprise Manager Agent installation directory. You will have an option to change the directory.
-
Select the hosts you want to install the AV Agent. For those hosts you select, Enterprise Manager will show:
-
Host name, operating system, and platform details.
-
Agent installation directory.
-
A drop-down with all the credentials stored in Enterprise Manager. If none of those are credentials for the particular host, then click on the new credential and provide new credential information in the pop-up window. This information will be saved for future reference.
You can either chose credentials for each host individually or click the default host credential and provide one credential applicable on all hosts.
Note:
If you choose the default host credential and still provide a credential for some other host in the host details table, then the credential provided in the column will override the default credential.
-
-
Click Submit to initiate the job (one per host) for the AV Agent setup.
After the job is submitted, the AV listing page is displayed.
-
To monitor the progress, click the refresh button to see the new AV Agents added to the system.
For any jobs that fail, use the EM Jobs page to diagnose the failure. As part of the job execution, Enterprise Manager will log any relevant information to aid the AV Administrator for diagnosing the issue.
4.2 The AVDF Plug-in Home Page
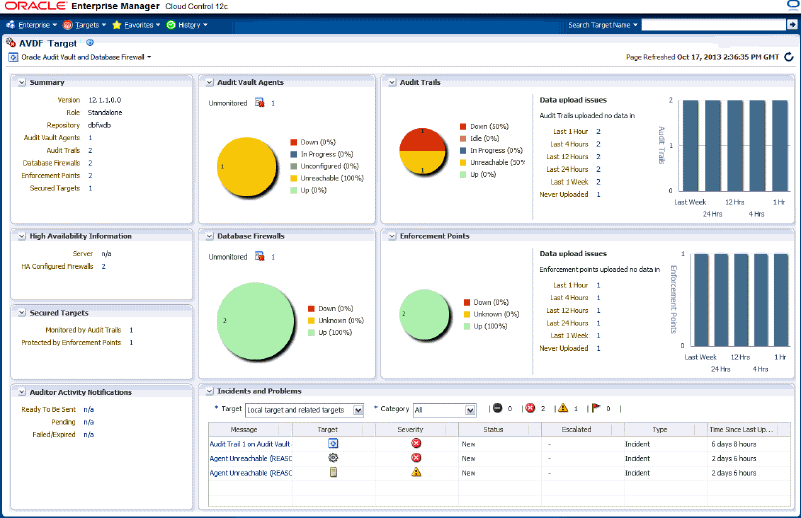
Once installed and configured, you can monitor Oracle Audit Vault and Database Firewall from Enterprise Manager Cloud Control, as shown in Figure 4-1. Each section and region of this page is described in Primary AVDF Plug-in Monitoring Overview.
4.3 Primary AVDF Plug-in Monitoring Overview
The regions described below provide high-level information about the status or performance of the Audit Vault Server and Database Firewall Appliance.
From the Oracle Audit Vault and Database Firewall plug-in home page, you can monitor the following information:
4.3.1 Audit Vault Agents
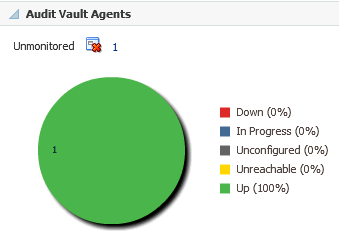
This region shows the status information and configuration issues of all Audit Vault Agents monitored by Audit Vault and Database Firewall, not only monitored by Enterprise Manager as an Enterprise Manager target. It also shows the information about the Audit Vault Agents not monitored by Enterprise Manager as an Enterprise Manager target.
A graph shows if the agent is down, in progress, unreachable, or up. (See Figure 4-2.)
For a detailed report (Audit Vault Agents List), select Audit Vault Agents from the Oracle Audit Vault and Database Firewall menu or click the Audit Vault Agents title on the Oracle AVDF home page.
4.3.1.1 Audit Vault Agents List
This page lists all of the Audit Vault Agents monitored by Audit Vault and Database Firewall. The following information is available:
-
Name: The name of the Audit Vault Agent. Click the link in this column for a detailed Audit Vault Agent Summary Page of the Audit Vault agent.
-
Version: The version of the Audit Vault Agent
-
Status: Identifies if the agent is Up, Down, Unreachable, Not Activated, etc.
-
Audit Vault Agent Location: The directory path for where the Audit Vault Agent is located.
-
Activation Key: Key using which Audit Vault Agent has been activated.
-
Activation Time: Time since when the Audit Vault Agent has been activated.
-
Incidents: The number of incidents logged against a particular agent (it may or may not be monitored by Enterprise Manager Cloud Control) and all the audit trails managed by it. Incidents have a state of Fatal, Critical, Warning, and Escalated.
4.3.1.2 Audit Vault Agent Summary Page
This page provides detailed information about a particular Audit Vault Agent.
From the Audit Vault Agent home page, you can monitor the following information:
This region shows a high-level list of any important messages about the status and activity of the Audit Vault Agent.
This region shows high-level information about the Audit Vault Agent, including:
-
Name: the name of the Audit Vault Agent
-
Version: the version of the Audit Vault Agent
-
Audit Vault Server: the name of the Audit Vault Server to which the Audit Vault Agent is associated
-
Creation Time:
-
Activation Time:
-
Activation Key:
-
Platform: the operating system of the Audit Vault Agent
-
Audit Trails: the number of audit trails associated with the Audit Vault Agent
-
Secured Targets: the number of secured targets monitored by the Audit Vault Agent
This region provides a high-level summary of any audit trail available for the Audit Vault Agent. The following information is provided:
-
Audit Trail ID: the unique identifier for any audit trail available for the Audit Vault Agent. Click the link in this column for a detailed audit trail summary.
-
Secured Target
-
Status
-
Type
-
Time Since Last Upload
-
Throughput (records/sec): the number of records per second the Audit Trail is uploading to the Audit Vault Server
-
Incidents
This region provides a summary of any reported incident or problem. If there is an incident or problem listed, click the link in the Message column to show details in the Incident Manager feature of Enterprise Manager Cloud Control.
4.3.2 Audit Trails
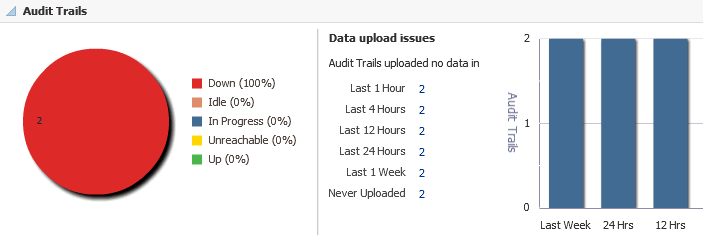
Like Audit Vault Agents region, the Audit Trails region (Figure 4-3) shows status information for all the audit trails in the Audit Vault and Database Firewall system. It shows since how long the data upload issues exist.
For a detailed report (Audit Trails List), select Audit Trails from the Oracle Audit Vault and Database Firewall menu or select the Audit Trails title from the Oracle AVDF home page.
4.3.2.1 Audit Trails List
This page lists all of the audit trails monitored by the Audit Vault and Database Firewall plug-in. The following information is available:
-
Audit Trail ID: the unique identifier for any audit trail available for an Audit Vault Agent. Click the link in this column for a detailed Audit Trail Summary Page.
-
Location:
-
Secured Target:
-
Status: identifies if the secured target is Up, Down, Idle, Unreachable, Not Activated, etc.
-
Audit Vault Agent: lists the host name of the Audit Vault Agent. Click the link to display that agent's home page summary.
-
Type:
-
Time Since Last Updated: The elapsed time since the last upload. This represents the time since when the audit trails has not uploaded any audit data into Audit Vault and Database Firewall repository.
-
Throughput: shows the number of queries audited per second.
-
Incidents: Identifies the number of incidents logged against an audit trail. Incidents have a state of Critical, Warning, and Escalated.
4.3.2.2 Audit Trail Summary Page
This page provides detailed information about a particular audit trail for an Audit Vault Agent. The following sections are provided:
This region shows high-level information about the audit trail of an Audit Vault Agent, including
-
Audit Trail Status: identifies if the Audit Vault Agent is Up, Down, Unreachable, Not Activated, etc.
-
Unreachable Since: shows a timestamp of when the Audit Vault Agent was first identified as unreachable
-
Audit Trail Type:
-
Audit Trail Location:
-
Time Since Last Upload: the elapsed time since the last upload. This represents the time since when the audit trails has not uploaded any audit data into Audit Vault and Database Firewall repository
-
Audit Vault Server: the name of the server where the Audit Vault Agent is installed
This region shows a high-level summary of a particular Secured Target, including:
-
Name: the name of the Secured Target
-
Type: the type of the Secured Target
-
Host: the IP address of the Secured Target
-
Port:
This region provides a graph of the throughput per second data over a particular time. Click the Duration drop-down menu to select a time frame.
This region shows a high-level list of any important messages about the status and activity of the Audit Vault Agent.
This region provides a summary of any reported incident or problem. If there is an incident or problem listed, click the link in the Message column to show details in the Incident Manager feature of Enterprise Manager Cloud Control.
4.3.3 Database Firewalls
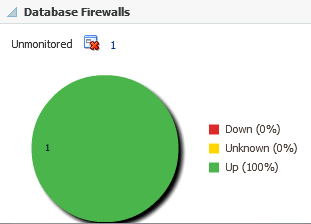
Like the Audit Vault Agents region, the Database Firewalls region (Figure 4-4) shows all of the firewalls in the Audit Vault and Database Firewall system, not only the one monitored by Enterprise Manager as an Enterprise Manager target. This section also shows the count of Database Firewalls not monitored by Enterprise Manager as an Enterprise Manager target.
For a detailed report (Database Firewalls List), select Database Firewalls from the Oracle Audit Vault and Database Firewall menu.
4.3.3.1 Database Firewalls List
This page lists all of the Database Firewalls monitored by the Audit Vault and Database Firewall plug-in. The following information is available:
-
Firewall: The Database Firewall name for all Database Firewalls in the Audit Vault and Database Firewall system - whether they are monitored by Enterprise Manager or not. Click the link for a detailed Database Firewall Summary Page for the selected Database Firewall.
-
Status: Identifies if the firewall is Up, Down, Idle, Unreachable, Not Activated, etc.
-
Firewall Host: Depending on the information available, this field displays:
-
The host name when available. The IP address of the Database Firewall host is shown as a tooltip of the host name.
-
The IP address of the Database Firewall host.
-
-
Role: This field shows whether the firewall has primary or secondary role in a High Availability (HA) configuration. If the Database Firewall is not HA configured, then this would be standalone.
-
Incidents: Identifies the number of incidents logged against a particular Database Firewall, whether monitored by Enterprise Manager Cloud Control or not. Incidents have a state of Critical, Warning, and Escalated
4.3.3.2 Database Firewall Summary Page
This page provides detailed information about a particular Database Firewall. The following sections are provided:
This region shows high-level information about the Database Firewall, including:
-
Name: the name of the Database Firewall
-
Version: the version of the Database Firewall
-
Audit Vault Server: the name of the server where the Database Firewall is installed
-
Firewall Host: Depending on the information available, this field displays:
-
The host name when available. The IP address of the Database Firewall host is shown as a tooltip of the host name.
-
The IP address of the Database Firewall host.
-
-
Role: This field shows whether the firewall has primary or secondary role in a High Availability (HA) configuration. If the Database Firewall is not HA configured, then this would be standalone.
-
Enforcement Points: the number of enforcement points associated with the Database Firewall
-
Secured Targets: the number of secured targets protected by the Database Firewall
This region shows a high-level, table summary for all enforcement points associated with a particular Database Firewall. The information displayed includes:
-
Enforcement Point: the name of the enforcement point for a particular Database Firewall. Click the link for a detailed summary of the enforcement point.
-
Status: identifies if the enforcement point is Up, Down, Idle, Unreachable, Not Activated, etc.
-
Monitoring Mode:
-
Database Activity Monitoring (DAM): monitors the activity of the database.
-
Database Policy Enforcement Mode (DPM): blocks activity if a policy violation occurs.
-
-
Firewalls: lists the Database Firewalls associated with a particular enforcement point.
-
Secured Target: identifies the name of the secured target. Click the link for a pop-up window with a detail summary.
-
Time Since Last scan: The time since the enforcement point last scanned any query.
-
Throughput: shows the number of queries audited per second.
-
Incidents: Identifies the number of incidents logged against an enforcement point. Incidents have a state of Critical, Warning, and Escalated
This region shows a high-level summary of the high availability (HA) support provided for the Database Firewall, including:
-
Secondary Firewall:
-
Secondary Firewall Host: Depending on the information available, this field displays:
-
The host name when available. The IP address of the secondary Database Firewall host is shown as a tooltip of the host name.
-
The IP address of the secondary Database Firewall host.
-
This region provides a summary of any reported incident or problem. If there is an incident or problem listed, click the link in the Message column to show details in the Incident Manager feature of Enterprise Manager Cloud Control.
4.3.4 Enforcement Points
This region (Figure 4-5) shows a high-level status of the enforcement points in the Audit Vault and Database Firewall system data. A timestamp shows since how long enforcement points have not scanned any queries (from the last hour to the last week).
For a detailed report (Enforcement Points List), select Enforcement Points from the Oracle Audit Vault and Database Firewall menu.
4.3.4.1 Enforcement Points List
This page lists all of the enforcement points monitored by the Audit Vault and Database Firewall plug-in. The following information is available:
-
Enforcement Point: the name of the enforcement point for a particular Database Firewall. Click the link for a detailed Enforcement Points Summary Page of the enforcement point.
-
Status: identifies if the enforcement point is Up, Down, Idle, Unreachable, Not Activated, etc.
-
Monitoring Mode:
-
Database Activity Monitoring (DAM): monitors the activity of the database.
-
Database Policy Enforcement Mode (DPM): blocks activity if a policy violation occurs.
-
-
Firewalls: lists the Database Firewalls associated with a particular enforcement point.
-
Secured Target: identifies the name of the secured target. Click the link for a pop-up window with a detail summary.
-
Time Since Last scan: The time since the enforcement point last scanned any query.
-
Throughput: shows the number of queries audited per second.
-
Incidents: Identifies the number of incidents logged against an enforcement point. Incidents have a state of Critical, Warning, and Escalated
4.3.4.2 Enforcement Points Summary Page
This page provides detailed information about a particular enforcement point associated with a Database Firewall. The following sections are provided:
This region shows high-level information about the enforcement points for a Database Firewall, including:
-
Status: identifies if the enforcement point is Up, Down, Idle, Unreachable, Not Activated, etc.
-
Active Since: the time the enforcement point was made active.
-
Monitoring Mode:
-
Database Activity Monitoring (DAM): monitors the activity of the database.
-
Database Policy Enforcement Mode (DPM): blocks activity if a policy violation occurs.
-
-
Firewalls: lists the Database Firewalls associated with a particular enforcement point.
-
Time Since Last scan: The time since the enforcement point last scanned any query.
-
Audit Vault Server: the name of the server to which the Database Firewall is associated.
This region provides a high-level summary of the enforcement point associated with a Database Firewall, including:
-
Source Name
-
Type
-
Source Host
-
Port
This region provides a graph of the throughput per second data over a particular time. Click the Duration drop-down menu to select a time frame.
This region provides a summary of any reported incident or problem. If there is an incident or problem listed, click the link in the Message column to show details in the Incident Manager feature of Enterprise Manager Cloud Control.
4.3.5 Secured Targets
This region (see Figure 4-6) shows number of Secured Targets:
-
Contained in the Audit Vault and Database Firewall system.
-
Monitored by the Audit Trails in Audit Vault and Database Firewall system.
-
Protected by the enforcement points in the Audit Vault and Database Firewall system.
For a detailed report (Secured Targets Summary Page), select Secured Targets from the Oracle Audit Vault and Database Firewall menu or click the Secured Targets title on the Oracle AVDF home page.
4.3.5.1 Secured Targets Summary Page
Secured targets can be supported databases or operating systems that Audit Vault and Database Firewall monitors. You must register all secured targets in Oracle Audit Vault and Database Firewall.
On the Secured Targets list page, the following information is available:
-
Secured Target: name of the target.
-
Type: the type of the supported database or operating system (such as, Oracle Database or Microsoft SQL Server).
-
Status: shows whether the database is Up or Down.
-
Connection String:
-
Monitored by: identifies the Audit Vault Agent and Audit Trails that are monitoring this Secure Target.
-
Protected by: identifies the Database Firewall and enforcement points that are protecting this Secure Target.
4.4 Other AVDF Plug-in Monitoring
The regions described below may provide links for additional information about the target. For example, the links in the Summary Region takes you to the corresponding component listing page which has the summary of all the components of that type. Other link and chart sections are also clickable, which will take you to the corresponding component listing page after applying the appropriate filter.
From the Oracle Audit Vault and Database Firewall plug-in home page, you can monitor the following information:
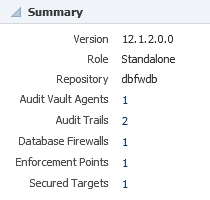
4.4.1 Summary Region
This region shows high-level information including the Oracle Audit Vault Server version and the number and type of components monitored by the plug-in (as shown in Figure 4-7).
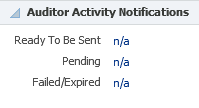
4.4.2 Auditor Activity Notifications
This region (Figure 4-8) shows the number of Auditor Activity Notifications. A notification can be Ready to be Sent, Pending, or Failed/Expired. These notifications are generated by Audit Trails in the Audit Vault and Database system.
4.4.3 High Availability Information
This region shows the associated high-availability pair of IP address for the Audit Vault Server and shows the number of high-availability configured Database Firewalls.
If the paired high-availability server is added to Enterprise Manager as an Enterprise Manager target, this region would show the Enterprise Manager target name (instead of the IP addresses) and would provide a link to navigate to that target. (See Figure 4-9.)
4.4.4 Incidents and Problems
This region (Figure 4-10) provides a summary of any incident or problem for the components monitored by the plug-in. If there is an incident or problem listed, click the link in the Message column to show details in the Incident Manager feature of Enterprise Manager Cloud Control.
4.5 Upgrading the Plug-in
The Self Update feature allows you to expand Enterprise Manager's capabilities by updating Enterprise Manager components whenever new or updated features become available. Updated plug-ins are made available via the Enterprise Manager Store, an external site that is periodically checked by Enterprise Manager Cloud Control to obtain information about updates ready for download. See the Updating Cloud Control chapter in the Oracle Enterprise Manager Cloud Control Administrator's Guide for steps to update the plug-in:
http://docs.oracle.com/cd/E24628_01/doc.121/e24473/self_update.htm
4.6 Undeploying the Plug-in
See the Managing Plug-ins chapter in the Oracle Enterprise Manager Cloud Control Administrator's Guide for steps to undeploy the plug-in:
http://docs.oracle.com/cd/E24628_01/doc.121/e24473/plugin_mngr.htm#CJGEFADI
