12 Troubleshooting the Enterprise Server
This chapter contains the following topics:
-
Section 12.1, "Understanding Enterprise Server Troubleshooting"
-
Section 12.2, "Viewing Enterprise Server Logs from the Workstation"
-
Section 12.4, "Setting Up the Enterprise Server jdedebug.log"
-
Section 12.7, "Troubleshooting the Enterprise Server Processes"
-
Section 12.9, "Troubleshooting the UNIX/Linux Enterprise Server"
-
Section 12.10, "Troubleshooting the Microsoft Windows Enterprise Server"
12.1 Understanding Enterprise Server Troubleshooting
Using these techniques, you can troubleshoot batch applications and business functions that process on the Oracle JD Edwards EnterpriseOne enterprise server. Platform-specific procedures are presented in other sections of this guide.
You might encounter these types of general problems on a JD Edwards EnterpriseOne enterprise server. The information presented applies to all operating systems:
-
Communication failure when submitting a UBE or when trying to run business function logic on the server.
-
Error message appearing at the bottom of a form (press F8 or click Bitmap to view an error description).
You should be familiar with the various logs used to troubleshoot problems on the server. Using these logs, you can troubleshoot batch applications and business functions that are executing on the enterprise server.
Types of Enterprise Server Log Files
In general, logs on JD Edwards EnterpriseOne enterprise servers are classified as either logic processing logs or batch processing logs.
Logic Processing Logs
You can use these two major log file sources for troubleshooting processing faults on the enterprise server:
-
This log displays fatal errors. It can track any fault that might occur within JD Edwards EnterpriseOne.
-
This log tracks API calls and SQL statements as well as other messages. You can use this file to determine the point in time when normal execution stopped. The system does not use jdedebug.log to track errors; instead, this log is used to track the timing of JD Edwards EnterpriseOne processes.
Batch Processing Logs
You can use the batch process log to identify faults in JD Edwards EnterpriseOne processing related to batch processes. This log can contain event rule (ER) references, batch application process flow, and SQL statements, as well as other messages.
12.1.1 The Enterprise Server jde.log File
You can use the enterprise server jde.log to track fatal error messages generated by batch applications and business functions that are executing on the enterprise server. The jde.log tracks any fault that might occur within JD Edwards EnterpriseOne. When you are looking for startup errors, you should read the jde.log from the top down. For other errors, you should read from the bottom up.
If jde.log is enabled, a uniquely identified log file is created each time you start a JD Edwards EnterpriseOne job (including JD Edwards EnterpriseOne startup) on the enterprise server. These logs are associated with an enterprise server process ID (Job Number for IBM i).
The process ID (Job Number for IBM i) is appended to the file name, before the .log extension, with an underscore character (for example, jde_442.log).
jde.log File Creation
The enterprise server jde.log file is created (if it does not exist) or overwritten (if it exists) at the start of every JD Edwards EnterpriseOne session. For a Microsoft Windows enterprise server jde.log file, JD Edwards EnterpriseOne appends new information to the end of the jde.log.
Troubleshooting: Enabling and Disabling jde.log
Normally, the enterprise server should be set to enable the jde.log and disable the jdedebug.log. This example has combinations for the jde.ini parameter setting for enabling or disabling server logs.
Enable jde.log
This is an example of the jde.log file with debug logging enabled:
[DEBUG]
Output=NONE
LogErrors=1
JobFile=valid location/name (1)
DebugFile=valid location/name (2)
Enable jde.log and jdedebug.log
This is an example of the jde.log file with debug logging enabled and output to a file:
[DEBUG]
Output=FILE
LogErrors=1
JobFile=valid location/name (1)
DebugFile=valid location/name (2)
Disable jde.log
This is an example of the jde.log file with debug logging disabled:
[DEBUG]
Output=NONE
JobFile=blank/invalid location/name (1)
DebugFile= blank/invalid location/name (2)
Files and members generated by the jde.log will be located in JobFile. JD Edwards EnterpriseOne uses these naming conventions:
jde_process_ID.log
Where jde is the file or member name prefix, process_ID is a uniquely named process ID, and log is the file or member suffix or extension.
For non-IBM i enterprise servers, files generated by the jdedebug.log will be located in DebugFile. JD Edwards EnterpriseOne uses these naming conventions:
jdedebug_process_ID.log
Where jdedebug is the file name prefix, process_ID is a uniquely named process ID, and log is the file suffix or extension.
Note:
Verify whether the paths for the JobFile and the DebugFile settings are valid. If the paths for these settings are invalid, JD Edwards EnterpriseOne does not create logs.For IBM i enterprise servers, the members generated by jdedebug will be located in DebugFile. JD Edwards EnterpriseOne uses these naming conventions:
jdedebug_process_ID
Where jdedebug is the file name prefix and process_ID is a uniquely named process ID.
Troubleshooting: Recommendations for the Enterprise Server jde.log
You can create a normal (successful) jde.log by signing on to JD Edwards EnterpriseOne and then immediately signing off. Use this log of successful startup statements to compare against logs that have a problem.
You can also rename the log to indicate the nature of the problem. For example, you might delete the jde.log and then run a report that causes an error condition. Then you could rename the jde.log to report.log.
If you are the only user running an instance of JD Edwards EnterpriseOne, you can add comment lines to the jde.log indicating the sequence of events you are performing. For example, you might be running an application that you know causes an error. Before you run the application, you could edit the jde.log to add a comment line stating you are about to start the suspect application.
Troubleshooting: Recommendations for Setting Up Server Locations
JD Edwards EnterpriseOne recommends that you create a separate directory on the enterprise server for logs. You should set up the jde.ini file to explicitly direct log files to that directory. For jde.log, the location and name of the log file are controlled by this default setting:
[DEBUG]
JobFile=jde.log
Files generated by the jde.log are located in JobFile. JD Edwards EnterpriseOne uses this syntax for naming files:
jde_process_ID.log (jde_jobnumber.log for IBM i)
If you do not specify a location, JD Edwards EnterpriseOne places the log files in the directory where you ran the JD Edwards EnterpriseOne startup executable (the default). On a UNIX machine, if you start JD Edwards EnterpriseOne with these commands and if logging is enabled, the system places the log files in the /u13/JDEdwards/E900/system/bin32 directory:
cd /u13/JDEdwards/E900/system/bine32
RunOneWorld.sh
If you start JD Edwards EnterpriseOne with these commands and if logging is enabled, the system places the log files in the /usr/JDEdwards directory because that is the working directory:
cd /usr/JDEdwards
/u13/JDEdwards/E900/system/bin32/RunOneWorld.sh
If you set up the UNIX machine to automatically start JD Edwards EnterpriseOne when the machine is started, it is especially important that you specify the full path of the log file in the jde.ini file.
Naming Conventions for jde.log
JD Edwards EnterpriseOne processes create logs as jde_processID.log (jde_JobNumber.log for IBM i), where processID is the process ID of the process that creates the log.
Non-IBM i JD Edwards EnterpriseOne processes move logs for batch jobs to the PrintQueue directory and rename them as report_version_date_time.log, where report is the report name and version is the version name; for example, R014021_XJDE0001_D990312_T161854215.log.
Example: Enterprise Server jde.log
This example of the jde.log from the enterprise server displays errors caused by signon tables that were not properly closed after fetching data. Normally, the only way this can happen is if a business function program did not close the table. Therefore, generated code applications cannot have this problem.
Most entries in the jde.log file are significant, and you should examine them closely. This information is also used by developers to indicate problems with the application that need to be addressed.
Troubleshooting: Recommendations for the Enterprise Server jde.log when a fatal crash occurs
If a fatal crash occurs on a JD Edwards EnterpriseOne Windows Server the Call Stack will be automatically be dumped into the jde.log file. This information in the jde.log file will contain a fully qualified path to the system install location. Therefore, you should take the necessary steps to ensure that the install path information is secured.
12.1.2 The Enterprise Server jdedebug.log File
You can use the enterprise server jdedebug.log to determine the point in time when normal execution stopped. The system does not use jdedebug.log to track errors. Instead, it uses this log to track the timing of JD Edwards EnterpriseOne processes. The log contains API calls and SQL statements as well as other messages.
You can use jdedebug.log to find out where a process ended. For example, log data can include what ODBC was trying to connect to, the SQL statement that was being executed for a specific table, and whether memory has been freed.
If jdedebug is enabled, each jdenet_n job and batch process started on a server creates a uniquely identified jdedebug.log. These logs are associated with an enterprise server process ID. Each time JD Edwards EnterpriseOne is started on the enterprise server and each time a batch process job is executed on the enterprise server, a new jdedebug.log is created.
For enterprise servers, the process ID (Job Number for IBM i) is appended to the file name with an underscore character before the .log extension. For example, the file name might be jdedebug_442.log. The enterprise server jdedebug.log is created (if it doesn't exist) or overwritten (if it exists) at the start of every JD Edwards EnterpriseOne session. For a Microsoft Windows enterprise server jde.log file, JD Edwards EnterpriseOne appends new information to the end of jde.log.
Note:
Server administrators are responsible for clearing and deleting jde.log and jdedebug_*.log files from the enterprise server.Troubleshooting: Reading the jdedebug.log
If the process failed and you have logging turned on, look in the jdedebug.log for these messages:
-
Not Found
-
Failure
Also, look at the end of the log to see what task was executed last. In general, important lines in the log are:
-
SELECT
The SELECT lines indicate which table you are selecting. The log tells you where the table resides. For the IBM i, this location is a library. For non- IBM i servers, this location is an environment. You should verify that the selected libraries and environments are correct.
-
ODBC Version
The ODBC lines indicate whether you are having problems connecting to the driver.
Troubleshooting: Enabling and Disabling jdedebug.log
Normally, the enterprise server should be set to enable the jde.log and disable the jdedebug.log. This example has valid setting combinations for enabling or disabling server jdedebug.log.
Troubleshooting: Enabling and Disabling jdedebug.log
These are the settings for enabling the jdedebug.log file:
[DEBUG]
Output=FILE
LogErrors=1
JobFile=valid location/name (1)
DebugFile=valid location/name (2)
Enable jde.log and jdedebug.log
These are the settings for enabling the jde.log and jdedebug.log files:
[DEBUG]
Output=BOTH
LogErrors=1
JobFile=valid location/name (1)
DebugFile=valid location/name (2)
Disable jdedebug.log
These are the settings for disabling the jdedebug.log file:
[DEBUG]
Output=NONE
LogErrors=0
JobFile=valid location/name (1)
DebugFile=valid location/name (2)
The [DEBUG] section of the jde.ini file contains the files and members generated by the jde.log. JD Edwards EnterpriseOne uses these naming conventions:
jde_<pid>.log
Where jde is the file or member name prefix and <pid> is a uniquely named process ID.
For enterprise servers, the files generated by the jdedebug.log will be located in the jde.ini file. JD Edwards EnterpriseOne uses these naming conventions:
jdedebug_<pid>.log (jdedebug_<JobNumber>.log)
Troubleshooting: Recommendations for the Enterprise Server jdedebug.log
You can create a normal (successful) jdedebug.log (JDEDEBUG for IBM i) by logging on to JD Edwards EnterpriseOne and then immediately logging off. Use this log of successful start up statements to compare against logs that have a problem.
You can also rename the log to indicate the nature of the problem. For example, you might delete the jdedebug.log and then run a report that causes an error condition. Then you could rename the jdedebug.log to report.log.
Another alternative is to add comment lines to the jdedebug.log that indicate the sequence of events you are performing. For example, you might be running an application that you know causes an error. Before you run the application, you could edit the jde.log to add a comment line stating that you are about to start the suspected application.
Troubleshooting: Recommendations for Setting Up Server Locations
We recommend that you create a separate directory on the enterprise server for logs. You should set up the jde.ini file to explicitly direct log files to that directory. For jdedebug.log, these setting controls the location:
[DEBUG]
DebugFile=jdedebug.log
For enterprise servers, the files generated by the jdedebug.log will be located in DebugFile. JD Edwards EnterpriseOne uses these naming conventions:
jdedebug_process_ID.log (jdedebug_JobNumber.log for IBM i)
Where jdedebug is the file name prefix and process_ID is a uniquely named process ID.
By default, JD Edwards EnterpriseOne places the log files in the directory where you ran the startup executable. For example, on a UNIX machine, if you start JD Edwards EnterpriseOne with this command:
cd /u13/JDEdwards/E900/system/bin32 RunOneWorld.sh
and assuming that logging is enabled, the system places the log files in the /u13/JDEdwards/E900/system/bin32 directory. Similarly, on a UNIX machine, if you start JD Edwards EnterpriseOne with this command:
cd /usr/JDEdwards /u13/JDEdwards/E900/system/bin32 RunOneWorld.sh
and assuming that logging is enabled, the system places the log files in the /usr/JDEdwards directory. This is the working directory. If you set up the UNIX machine to automatically start JD Edwards EnterpriseOne when the machine is booted, it is especially important that you specify the full path of the log file.
Naming Conventions for jdedebug.log on the Enterprise Server
JD Edwards EnterpriseOne processes create logs as jdedebug_process_ID.log, where process_ID (Job Number for IBM i) is the process ID of the process creating the log. For example, a batch report running on a UNIX server as process 123456 would produce a file named jdedebug_123456.log.
12.1.3 The Batch Process Log File
Whenever you run a batch process requested from a workstation, an individual log file is created in the JD Edwards EnterpriseOne print queue directory (E900\PrintQueue) on that workstation. For any batch process request issued from a workstation, this file is created even if you have specified that the batch process report is to run on the enterprise server. For batch processes requested from a server, the jdedebug.log file is created on the server in the print queue directory.
Based on the setting of the UBESaveLogFile parameter in the [UBE] section of the jde.ini file, this log file is deleted or saved on successful completion of batch processes. This log file displays different types of messages that can help track errors in the batch process. The messages are:
-
Section Level Process
-
Object Level Process
-
ER Level Process
-
DB Level Process
The batch process log can contain ER references, batch process flow, and SQL statements, among other messages. You can use the batch process log file to determine when normal execution stopped.
The batch process log file displays the process flow in batch processes. This example describes the event flow within the batch engine and provides sample messages that would be written to the log at each point in the event flow, assuming UBEDebugLevel is set to 6. Note that each message written to the log file displays the error level of that message in brackets. For example, -UBE--[2]-indicates a section-level message.
When a UBE processes a section, it begins by opening the business view for that section within the INIT section event. As a result, a SELECT statement follows directly after the INIT section for each section.
--UBE--[2]-- 355/392 Process Init Section
--UBE--[2]-- 355/392 InitSection for Business Unit Report Driver
--UBE--[2]-- 355/392 InitSection for Business Unit Report LBH
--UBE--[4]-- 355/392 SELECT T0.MCMCU, T0.MCSTYL, T0.MCLDM, T0.MCCO, T0.MCAN8,
T0.MCCNTY, T0.MCADDS, T0.MCFMOD, T0.MCDL01, T0.MCDL02, T0.MCDL03, T0.MCDL04,
T0MCRP01, T0.MCRP02, T0.MCRP03, T0.MCRP04, T0.MCRP05, T0.MCRP06, T0.MCRP07,
T0.MCRP08, T0.MCRP09, T0.MCRP10, T0.MCRP11, T0.MCRP12, T0.MCRP13, T0.MCRP14,
T0.MCRP15, T0.MCRP16, T0.MCRP17, T0.MCRP18, T0.MCRP19, T0.MCRP20, T0.MCRP21,
T0.MCRP22, T0.MCRP23, T0.MCRP24, T0.MCRP25, T0.MCRP26, T0.MCRP27, T0.MCRP28,
T0.MCRP29, T0.MCRP30, T0.MCPECC, T0.MCALS, T0.MCALCL, T0.MCSBLI, T1.CCCO,
 T1.CCNAME,
T1.CCRCD FROM F0006 T0,F0010 T1 WHERE ( T1.CCCO=T0.MCCO ) ORDER BY T0.MCCO ASC,
T0.MCMCU ASC
After INIT Section, the engine calls Advance Section to retrieve a record from the SELECT statement:
--UBE--[2]-- 355/392 Process Adv Section
--UBE--[2]-- 355/392 Processing Adv Section for Page Header
After the retrieve, the engine performs the DO Section processing. This includes any event rules attached to the DO Section event:
--UBE--[2]-- 355/392 Process DO Section
--UBE--[2]-- 355/392 Processing DO Section for Page Header
--UBE--[4]-- 355/392 --ER: Line(1): Loading Data Structure for BSFN
--UBE--[4]-- 355/392 --ER: Line(1): Processing BSFN : GetCompanyAndReportDesc
--UBE--[4]-- 355/392 --ER: Line(1): Done Processing BSFN : GetCompanyAndReportDesc
--UBE--[4]-- 355/392 --ER: Line(1): Unloading Data Structure for BSFN
--UBE--[4]-- 355/392 --ER: Line(1): Done Processing ER BSFN
Within DO Section, each object is processed and eventually printed in INIT, DO, and END object order:
--UBE--[3]-- 355/392 Process Init Object
--UBE--[3]-- 355/392 Processing Init Item SystemTime in Section Page Header
--UBE--[3]-- 355/392 Process DO Object
--UBE--[3]-- 355/392 Processing Do Object SystemTime in Section Page Header
--UBE--[6]-- 355/392 Printing Object Value = 14:35:46
--UBE--[3]-- 355/392 Process End Object
--UBE--[3]-- 355/392 Process Init Object
--UBE--[3]-- 355/392 Processing Init Item SystemDate in Section Page Header
--UBE--[3]-- 355/392 Process Do Object
--UBE--[3]-- 355/392 Processing Do Object SystemDate in Section Page Header
--UBE--[6]-- 355/392 Printing Object Value = 3/6/00
--UBE--[3]-- 355/392 Process End Object
After all the objects for a section have been processed, the engine calls Process Last Object and then begins processing for the next section in the report:
--UBE--[3]-- 355/392 Processing Do Object
ModelAccountsandConsolid in Section Page Header
--UBE--[6]-- 355/392 Printing Object Value = MD
--UBE--[3]-- 355/392 Process End Object
--UBE--[3]-- 355/392 Process Last Object
--UBE--[2]-- 355/392 Process End Page Header Section
--UBE--[2]-- 355/392 Process Do Section
--UBE--[2]-- 355/392 Process Do Section for Business Unit Report Driver
When all sections have been processed, if the report finishes without errors, these messages are displayed at the end of the log:
--UBE--[6]-- Successfully Finishing Engine
...
UBE Job Finished Successfully.
The level of detail provided by the batch process log is controlled by the UBEDebugLevel parameter of the jde.ini file. These are values for UBEDebugLevel:
| Value | Description |
|---|---|
| 0 | No error messages. |
| 3 | Object-level messages. |
| 4 | Event rule messages and SQL statements (plus levels 1-3). |
12.2 Viewing Enterprise Server Logs from the Workstation
You must log on to the server to view logs for the server. You can also view portions of log files from the workstation that initiated the calls to the server.
To view server logs from the workstation:
-
In the [DEBUG] section of the enterprise server jde.ini file, set the ClientLog parameter to 1.
This setting enables the server to send logs to workstations. For example:
[DEBUG]
ClientLog=1
-
In the [DEBUG] section of the Workstation jde.ini file, set the ServerLog parameter to 1.
This setting enables the workstation to receive log information from the enterprise server. For example:
[DEBUG]
ServerLog=1
12.3 Setting Up the Enterprise Server jde.log
To set up the enterprise server jde.log:
-
Locate the enterprise server jde.log file (JDE member for IBM i) using Server Manager.
-
In Server Manager, in the Management Console, select the Logging hyperlink from the Configuration pane.
-
In the Error and Debug Logging pane, enable or disable the logging of errors to the jde.log file by modifying the Enable JDE.LOG field.
Setting Purpose Enable JDE.LOG A parameter controls whether the logging function is enabled. Valid values are: -
Disabled (Default)
-
Enabled
-
-
Click the Apply button to save the changes.
See Also:
Server Manager Guide12.4 Setting Up the Enterprise Server jdedebug.log
To set up the enterprise server jdedebug.log:
-
Locate the enterprise server jdedebug.log file (JDE member for IBM i) using Server Manager.
-
In Server Manager, in the Management Console, select the Logging hyperlink from the Configuration pane.
-
In the Error and Debug Logging pane, verify or change the name for the debug file using the JDEDEBUG.LOG Filename parameter field.
The JDEDEBUG.LOG Filename specifies the name of the jdedebug.log file (JDEDEBUG member for IBM i). For non-IBM i enterprise servers, the default value is jdedebug.log. For IBM i enterprise servers, the default value is JDEDEBUG.
-
In the Error and Debug Logging pane, enable or disable the logging of errors to the jde.log file by modifying the Enable JDE.LOG field.
Setting Purpose Enable Debug Logging A parameter controls whether the logging function is enabled. Valid values are: -
NONE — No Debug Logging
-
FILE — Enable Debug Logging
-
-
-
Click the Apply button to save the changes.
See Also:
-
Server Manager Guide
12.5 Setting Up the <batch process>.log File
To set up the <batch_process>.log file:
-
Locate the workstation jde.ini file.
The JD Edwards EnterpriseOne setup program places this file in the working Windows directory (for example, c:\WINNT40\jde.ini). If you are unsure of the workstation's working Microsoft Windows directory, use the Find command to locate the jde.ini file.
-
Use an ASCII editor (such as Microsoft Notepad or Microsoft Wordpad) to open the file.
-
Set the level of batch report debugging information that you want written to the batch process log file and whether you want the file to be saved.
These settings are controlled by these parameters in the [UBE] section:
Setting Purpose UBEDebugLevel= A parameter that specifies the level of UBE debug logging. Valid values are: -
0 (default): No error messages.
-
1: Warnings and high-level information.
-
2: Section-level messages (plus Level 1 messages)
-
3: ER messages and database mapping messages (plus Level 1-2 messages)
-
4: SQL statements (plus Level 1-3 messages)
-
5: Database output (plus Level 1-4 messages)
-
6: Batch process function calls and printed output values (plus Level 1-5 messages)
UBESaveLogFile= A parameter that specifies whether the batch_report.log file will be saved. Valid values are: -
0: The batch_report.log file is not saved.
-
1: The batch_report.log file is saved in the workstation's JD Edwards EnterpriseOne print queue directory (E900\PrintQueue).
-
-
Save the changes and close the jde.ini file.
12.6 Troubleshooting the Enterprise Server
This section discusses how to:
-
Troubleshoot general problems.
-
Troubleshoot communication problems.
-
Troubleshoot server map problems.
12.6.1 Troubleshooting General Problems
You can troubleshoot general enterprise server problems using the Server Manager which enables you to monitor server components, processes, and resources.
To troubleshoot general problems:
-
Use Server Manager to verify that you are looking at the correct port and the server is operational on that port.
-
Verify the netTrace setting in the enterprise server jde.ini file:
[JDENET]
netTrace=0/1 (disabled/enabled)
When the variable netTrace=0, JD Edwards EnterpriseOne does not generate Net log information. When netTrace=1, JD Edwards EnterpriseOne generates Net log information.
Note:
Using Server Manager, you can turn logging on or off for a particular kernel process. -
Return to JD Edwards EnterpriseOne and duplicate the problem.
The trace facilities write debugging information to the jde.log and jdedebug.log files.
-
After running the business function again, look at the jde.log files on the server.
Search for these message (you must search for lower case): "jdenet_n process."
If you cannot find this message, bring the server down and back up. If you do find this message, look at the jde.log file with the same process ID as the net process.
-
Verify that the user is running in the correct environment or path code; for example PD900 or DV900.
If this environment is not set up on the server, you receive errors on the workstation jde.log as well as the enterprise server jde.log.
-
In the jde.logs on the enterprise server, look for a JDENET_SendMSg Failed Error=12 message.
This message means that the JDENET server is down and you must restart it.
-
In the jde.log file on non-IBM i enterprise servers, look for any "Unable to connect to Oracle" messages. Search on ORA-.
If you find messages, they indicate problems connecting to Oracle. You get an indication of an Oracle connection problem if, in a business function, you select find/browse, data is not found, and no errors are received from the application. You need help from an Oracle database administrator at this point. To debug this problem, see the section in this document about sql.log.
-
Look in the jdexxx.log file (where xxx is the ID of the process that created the log) on the server for these message: "Could not find symbol in the <BSFN dll name>."
If present, this message might mean that the business function did not build on the enterprise server.
-
If you have not found a problem indicating why you are unable to run an application on the enterprise server, you will need to debug it on the server.
Note:
For Microsoft Windows enterprise servers, if you cannot identify a problem by reading the log, you need to put the business function through debug on the server. This action requires knowledge of C++ and how to debug. See Microsoft documentation for Debugging C++.
12.6.2 Troubleshoot Communication Problems
When you submit an application to an enterprise server through an override of the master business function set in Object Configuration Manager, you might experience communication problems with the enterprise server. The business function then runs locally on the client workstation. JD Edwards EnterpriseOne displays a window to inform you that the business function is running in a new location.
To troubleshoot communication problems:
Note:
Use this procedure if JD Edwards EnterpriseOne displays a window to inform you that a business function is running in a new location.-
Check the jde.ini on the workstation to make sure the JDENET service name (port number) is correct and valid.
This port number must match the settings in the server jde.ini file, and the JD Edwards EnterpriseOne server must be running to successfully submit reports or to run business logic on a server. Security services and transaction management services also require the JD Edwards EnterpriseOne server to be running:
[JDENET]
serviceNameListen=service name
serviceNameConnect=service name
If serviceNameListen=service name specifies the communications service port on the TCP/IP network, JD Edwards EnterpriseOne uses this port address to listen for requests on the network. Using a file called services, you can associate the port number with a unique name. The default value is jde_server (port number 6003).
If serviceNameConnect=service name specifies the communications service port on the TCP/IP network, JD Edwards EnterpriseOne uses this port address to connect to the network. Using a file called services, you can associate the port number with a unique name. The default value is jde_server (port number 6003).
-
On the workstation, exit JD Edwards EnterpriseOne and turn logging on in the jde.ini.
-
Run the application on the server again, and then check the jde.log file to see if any of these errors are logged:
-
JDENET_SendMsg Failed Error=8
This error can mean you are not using the correct TCP/IP service port or that the enterprise server does not have that JDENET listing.
-
JDENET_SendMsgFailed Error=5, 11, or 12
These errors can mean that the message is being sent to the correct port, but the enterprise server JDENET is down.
-
-
From within Server Manager, change the port address to determine if both the workstation and server are using the same port.
-
Check the services file on the workstation (located in the operating system directory\System32\drivers\etc for Windows).
Ensure that a blank line exists at the end of the file and that you have the service name mentioned in Step 1 (for example, jde_server) going to the correct port address on the server. Verify the port address with the server administrator.
-
If you receive a Communication Failure message, try resubmitting the application.
A time-out may have occurred.
[JDENET]
netTrace=0/1 (disabled/enabled)
-
Look in the log file for this message:
Could not find symbol in the <BSFN dll name>
12.6.3 Troubleshooting Server Map Problems
If you change the Object Configuration Manager or the Data Source Master files in the Server Map data source, you can test the changes using the PORTTEST program. This test is designed to validate the environments.
See the section specific to the platform type for more information about the PORTTEST program.
12.7 Troubleshooting the Enterprise Server Processes
This section provides an overview of resource utilization and performance and discusses how to evaluate JD Edwards EnterpriseOne server performance.
12.7.1 Understanding Resource Utilization and Performance
This section discusses:
-
Requirements
-
Configuration Setup
The EnterpriseOne Kernel can sometimes encounter certain complex issues which have proved intractable to resolve. Some of these intractable issues are Kernel Crashes, Deadlocked UBEs, or OutMemory conditions that require specialized code to determine the root cause. In addition, the kernel and batch processes utilize resources and place demands on memory and the CPU and execute in the context of other processes that also demand memory and CPU resources. Each process has its own level of impact on the system, and the cumulative effect of all processes currently running will impact performance. Appropriate data can be captured and used with measurement tools to evaluate overall performance as well as the impact of individual processes. When utilization or performance exceeds certain thresholds, it is critical to have tools that can diagnose which process is creating the resource overload in order to correct the problem and restore the performance to normal levels before the system crashes.
A new administration tool called Kernel Resource Management (KRM) has been added to Server Manager to enable you to isolate and determine root causes of CPU and Memory issues, increase system stability and simplify the troubleshooting process. Graphs allow you to quickly identify processes with high resource consumption and recycling allows the ability to reclaim system resources.
There are graphs for the following:
-
Summary Graphs for entire Enterprise Server that displays memory and CPU usage.
-
At Enterprise Server level, there are graphs that display the Top 10 Processes by Memory and CPU.
-
At the Individual Process Level there are graphs for CPU, Memory, caches and DB connections.
New diagnostics allows you to quickly identify root cause of resource consumption issues. For Diagnostics, information about the current resource usage is written to the jdedebug.log:
Cache information:
-
Cache name
-
Number of records in the cache
-
Indices
Database Transactions:
-
Commitment type
-
User
-
Application
KRM enables you to monitor kernel and batch processes and to diagnose CPU and memory usage issues.
12.7.1.1 Requirements
Kernel Resource Management requires JD Edwards EnterpriseOne 8.98.2.0 to be able to capture the diagnostic information. Server Manager 8.98.2.0 or above is required to display the diagnostic information.
If an older Server Manager version is used to monitor a newer Enterprise Server, the new diagnostic data will be captured but will not be viewable from Server Manager. Similarly, if a newer Server Manager version is used to monitor an older Enterprise Server, then the new diagnostic data will not be captured nor be viewable from Server Manager.
12.7.1.2 Configuration Setup
The Kernel Resource Management includes several new graphs of different attributes of the Enterprise Server instance. The interval of the data in these graphs is defined by Server Manager monitors. By default, each monitor collects up to 1440 data points. In the monitor configuration, the user can specify at what interval these data points will be collected. By default, the collection interval is 60 seconds. This default value allows the collection of 24 hours worth of data points. These are two graphs used to present the data for all CPU or memory processes. These graphs can be accessed by selecting an enterprise server in Server Manager.
If a less granular data set is desired, you can increase the collection interval. If more granular data set is desired, you can lower the collection interval. However, it is not recommended to set the collection interval less than 20 seconds. The embedded Server Manager agents (in the Enterprise Server, for example) are designed to collect runtime metrics every 20 seconds. Setting the monitor collection interval to less than 20 seconds will result in duplicate (or stale) data points as well as higher CPU usage on the Enterprise Server.
Note:
When the Server Manager Console (SMC) services are stopped and restarted, the collection of data for these monitors is reset. Also, any changes made to the collection interval and to the number of data points are NOT maintained and the default value of 60 seconds is used.Note:
If there are mandatory multiple EnterpriseOne instances, one may want to reduce the number of collection data points and increase the collection frequency. For more information please refer to the solution document on My Oracle Support titled:E1: SVM: Server Manager Console running out of memory with java.lang.OutOfMemory exception. 1082765.1. (Doc ID 1082765.1).
Overhead on Server Manger Console
The data for graphs is saved in XML format in <install_location>/jde_home/data. The XML files are relevant for graphical display purposes until the SMC is bounced. The stale XML files (from a previous run) may be purged or archived. Previously saved XML graph files cannot be viewed.
Server Manager Security Permission Role
A new server manager security permission called enterpriseServerDeveloper is available which will allow you to create memory, CPU and all diagnostics. This security permission will also allow you to start, dump, parse and stop JADE. The buttons used in the JADE section will be disabled if the Server Manager user does not have the enterpriseServerDeveloper Server Manager security permission. This security permission is always assigned to the jde_admin user.
Figure 12-1 Permissions for Server Groups
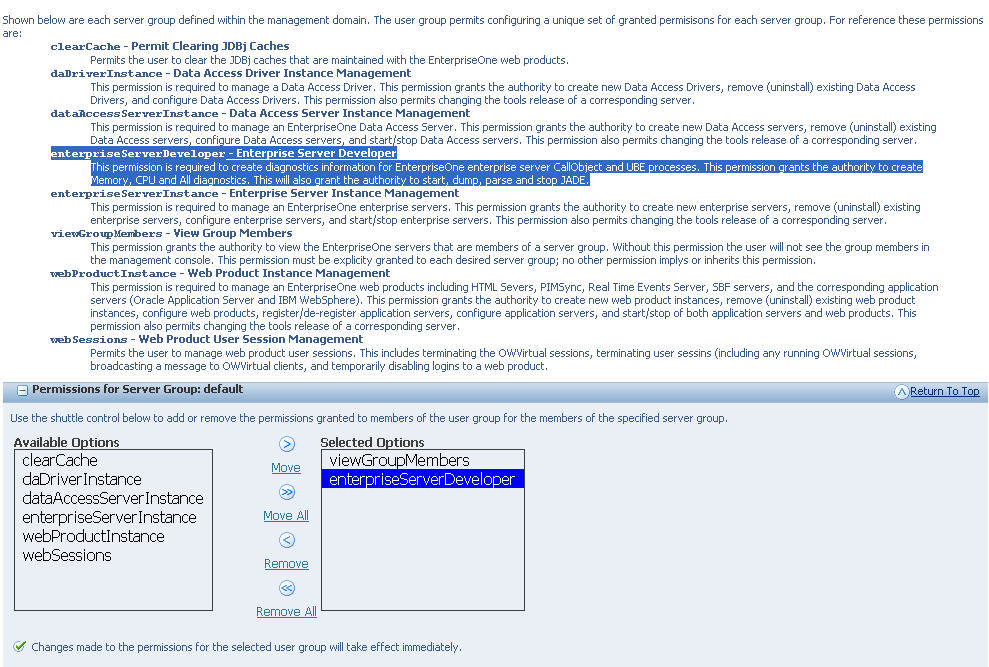
Description of "Figure 12-1 Permissions for Server Groups"
12.7.2 Evaluating EnterpriseOne Server Performance
Kernel Resource Management is a set of diagnostic tools implemented in Server Manager 8.98.2.0 that utilizes historical data captured at specific intervals. You can use KRM to drill down through different levels of detail information and isolate the process, user, and attribute to determine the critical decision-making factors when diagnosing and troubleshooting memory problems and CPU issues. KRM functions as a central dashboard regardless of the platform that it is running on.
In order to evaluate JD Edwards EnterpriseOne server performance, you will need to follow a process that will isolate the problem. In this process you will:
-
Determine if the CPU or memory is abnormal
-
Identify the abnormal process
-
Evaluate the individual process
-
Get the memory or CPU diagnostics
-
Log off or recycle
-
Use Advanced Profiling
This is a flow chart of the process using KRM to diagnose the root cause of a problem:
Figure 12-2 Evaluating Server Performance
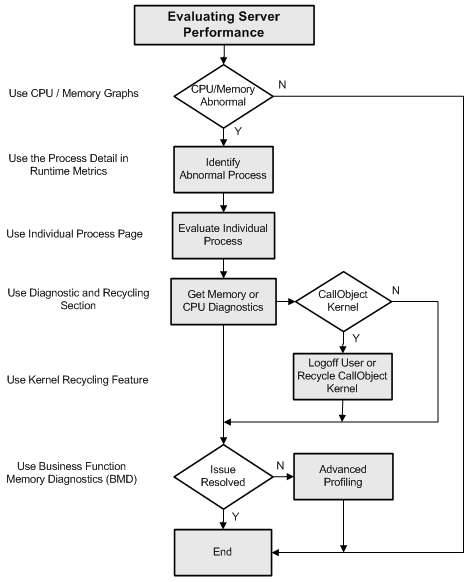
Description of "Figure 12-2 Evaluating Server Performance"
12.7.2.1 Determine if CPU or Memory is Abnormal
To help you determine what constitutes "abnormal" memory usage, new functionality has been added to the server command-line program porttest. This new functionality will simulate a memory leak until the process can no longer allocate memory. The output of the program will be the number of bytes that the porttest program was able to allocate before failure. This number can be used by the administrator to estimate when an EnterpriseOne process may fail due to excessive memory consumption.
The porttest program can be run in two modes: single-threaded (simulates runbatch and subsystem UBE's) and multi-threaded (simulates CallObject kernels). Since the memory model on the IBM i platform is single-level store, a maximum-limit cannot be determined in this way.
Note:
If you are running EnterpriseOne Services on the IBM i platform, please work with your IBM representative to determine the maximum temporary storage that a job can use before failure.Automatic Method for Memory Limit
To calculate the memory limits:
-
Stop the EnterpriseOne server by clicking the Stop button.
-
Click the Calculate Memory Limit button.
-
Start the EnterpriseOne server by clicking the Start button.
Figure 12-3 General and Instance Properties section - before calculating memory limit
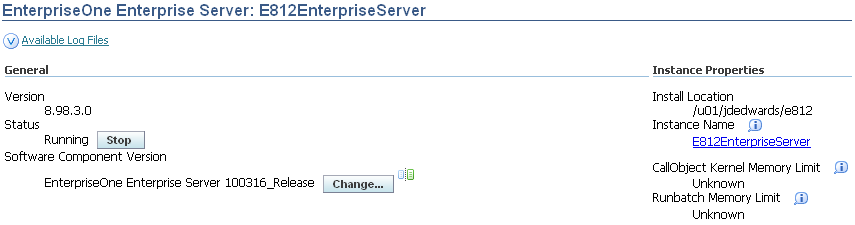
Description of "Figure 12-3 General and Instance Properties section - before calculating memory limit"
Figure 12-4 Instance Properties section - after calculating memory limit
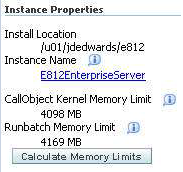
Description of "Figure 12-4 Instance Properties section - after calculating memory limit"
What constitutes a normal CPU consumption is entirely dependent on the vendor sizing of the EnterpriseOne instance. As a rule of thumb, high sustained CPU usage could indicate under-sized hardware. Determining abnormal CPU usage is challenging because it depends on the load on the server and average usage patterns. For example, it may be normal for the CPU usage to drop below 10% overnight on an application server when no interactive users are on the system. However, if the server is used for nightly batch runs, then dropping below 10% overnight when the batch ube jobs are running might be abnormal. Likewise, it would probably be abnormal for the CPU usage to drop below 10% during the middle of the day on an application server. However, it might be normal if this occurred during lunch hour for most interactive users.
What is "normal" and "abnormal" will be different for each customer and the administrator may need to monitor their EnterpriseOne server usage for a month or so to get a feel for what their normal usage pattern is.
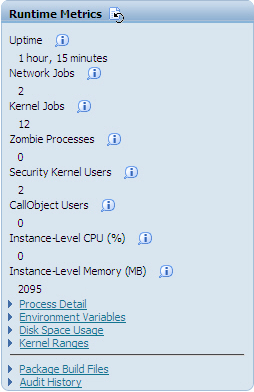
Two metrics have been added to the Runtime Metrics section to provide information on Instance-level CPU and memory. The new metrics are:
| Metric | Description |
|---|---|
| Instance-level CPU (%) | The total CPU usage of all processes running in this enterprise server instance. |
| Instance-level Memory (MB) | The total Memory usage of all processes running in this enterprise server instance. |
The instance-level summary page is used to evaluate instance-level data and has a new section called Resource Charts - Sum of All EnterpriseOne Processes. The instance level summary graphs are used to determine if the CPU or Memory have exceeded normal thresholds.
These are the navigation steps to access the instance-level summary page:
-
Select the enterprise server instance in server manager.
-
You should see the <EnterpriseOne Enterprise Server> instance.
-
Make sure that the server is up and running.
The instance-level summary page has the following sections:
-
General and Instance Properties (not modified).
-
Resource Charts - Sum of All Instance Level EnterpriseOne Processes (New).
-
Available Log Files (not modified).
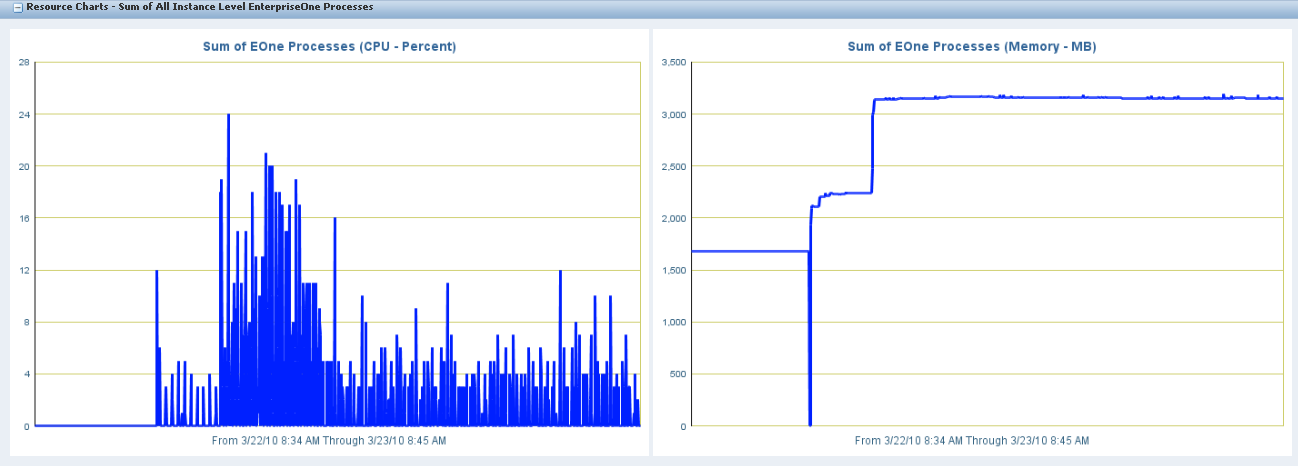
In the Resource Charts - Sum of All Processes section, the instance level summary graph displays the sums of CPU Usage - Percent and Memory Usage - in MB for all processes in the EnterpriseOne Server instance. The time-frame of the data collected is indicated along the x-axis of the graphs. How much data is represented depends on when the Server Manager Console services were started and the collection intervals for the monitors that were specified (refer to Configuration Setup).
Figure 12-6 Resource Charts - Sum of All Instance Level EnterpriseOne Processes
Description of "Figure 12-6 Resource Charts - Sum of All Instance Level EnterpriseOne Processes"
If you want to get more information about processes in the EnterpriseOne Server instance and see where a likely problem might be, you can click on the "Process Detail" link on the navigation pane on the left-ehand side of the Server Manager screen.
12.7.2.2 Identify Abnormal Process
The Enterprise Server Processes page is used to identify abnormal processes through evaluating kernel-level data.
These are the navigation steps to access the enterprise server process page:
-
Select the enterprise server instance in server manager.
-
You should see the <EnterpriseOne Enterprise Server> instance.
-
Make sure that the server is up and running.
-
Go to the <Runtime Metrics> section.
-
Click on the <Process Detail> link.
-
You should see the <Enterprise server Processes> page.
The enterprise server process has the following sections:
-
Process and Batch Summary (not modified).
-
Resource Charts – Top EnterpriseOne Processes (New).
-
Processes (modified).
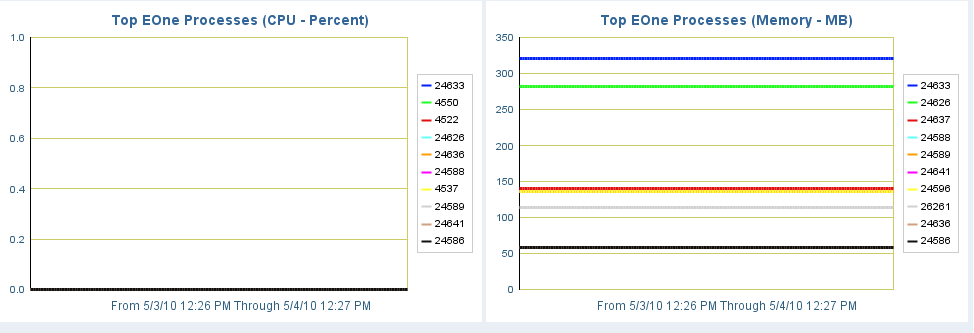
This page has a new section called Resource Charts - Top EnterpriseOne Processes and a modified section called Process List. The enterprise server process detail page will have the top ten individual processes for percent CPU usage and memory usage (in MB) designated in graph format. The top ten processes are chosen from all currently running EnterpriseOne Server processes. The time-frame of the data collected will be indicated along the x-axis of the graphs. How much data is represented will depend on when the Server Manager Console services were started and the collection intervals for the monitors that were specified (refer to Configuration Setup).
This graph enables the administrator to visually determine which process to troubleshoot, by providing an easy reference for the top memory or CPU consuming processes. The Process ID can be identified and then used to identify the process entry in the table in the Process List section to access more detail.
Figure 12-7 Resource Charts -Top EnterpriseOne Processes
Description of "Figure 12-7 Resource Charts -Top EnterpriseOne Processes"
Next on this page is a table of all Enterprise Server processes. Six columns have been added to this table that can be sorted on. This is the Process List section:
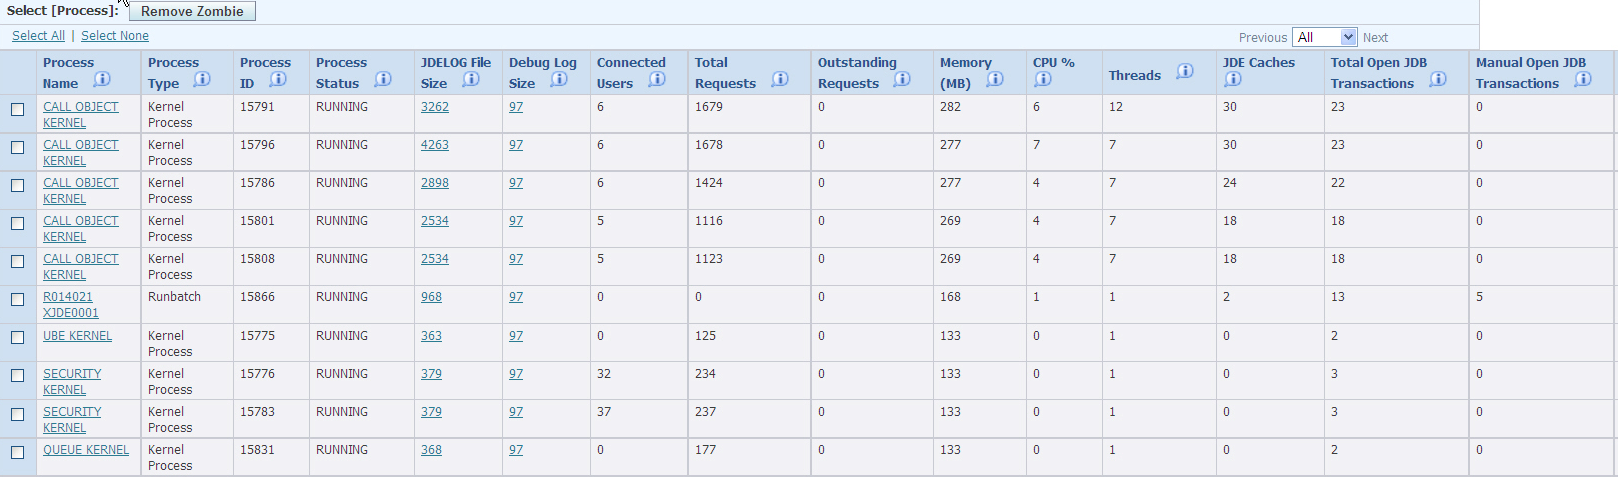
The columns in the Process List are:
| Field | Description |
|---|---|
| Process Name | The name of the kernel process. The name indicates which kernel definition the kernel belongs to. |
| Process Type | The description of the Enterprise Server process type. |
| Process ID | The operating system assigned process identifier for the kernel process. |
| Process Status | The current state of the processes. May be RUNNING, STOPPED, or ZOMBIE. |
| JDE Log File Size | The size of the error log file commonly referred to as jde.log for the enterprise server process. The size is specified in bytes. |
| Debug Log Size | The size of the debug log file commonly referred to as jdedebug.log for the enterprise server process. The size is specified in bytes. |
| Connected Users | The number of users that are currently connected to this kernel. This is applicable to security and callobject kernels only; other kernels do not maintain persistent connections with a particular user. |
| Total Requests | The total number of JDENET messages that have been processed by the process. |
| Outstanding Requests | The number of JDENET messages 9requests) that are queued up for the kernel process. |
| Memory (MB)* (applies to all E1 processes) | The virtual memory usage in megabytes for the process. An increase in this value over time could indicate a leak that needs to be analyzed. |
| CPU %* (applies to all E1 processes) | The amount of %CPU consumed by EnterpriseOne server process. The %CPU is reported directly for SUN and HP platform and is a calculated value in WINDOWS, DB2 for IBM i, AIX and LINUX platform. For example, on a 4-processor machine, a process using all of 1 CPU might be reported as using 25% or 100%. |
| Threads* (applies to all E1 processes) | The number of OS threads stared in the EnterpriseOne server process including any Java threads if the process loads a JDEJVM. |
| JDE Caches* (does not apply to jdenet_n processes) | The cache count for the process. This is the total number of JDE Caches in the EnterpriseOne server process which are opened by calling jdeCacheInit API. These caches are generally created by EnterpriseOne Business Functions. They are necessary for Business Functions to do their work. But an increase in this value over time could indicate a leak that needs to be analyzed. The application developer should call jdeCacheTerminate API in business function code to fix the JDECache leak. |
| Total Open JDB Transactions* (does not apply to jdenet_n processes) | The total number of open JDB transactions which includes both AUTO and MANUAL transaction. This resource is opened by calling JDB_InitUser API which is either called with JDEDB_COMMIT_AUTO or JDEDEB_COMMIT_MANUAL. An increase in this value over time could indicate a leak that needs to be analyzed. The application developer should call JDB_FreeUser API in business function code to fix the JDB Transactions leak. |
| Manual Open JDB Transactions* (does not apply to jdenet_n processes) | The number of MANUAL open JDB transactions are opened by calling JDB_InitUser API with JDEDEB_COMMIT_MANUAL. The number of manual open JDB transactions is directly linked with manual-commit database connections. This number should be zero in a normal environment. If this number is growing then it may result in database connection leaks and may cause the enterprise database to reach the maximum number of connections which will bring the entire EnterpriseOne environment (enterprise server and JAS servers) to a halt and consequently no EnterpriseOne user can get their work done. The application developer should call JDB_FreeUser API in business function code to fix the JDB Transactions leak. |
| Database Connections** | The total number of open Database Connections includes AUTOcommit, Select For Update (SFU) and MANUAL-commit connections. An increase in this value over time could indicate a leak that needs to be analyzed. The AUTO and SFU connections have a small maximum limit whereas the MANUAL commit connections have no limit and can grow really high and will eventually hit the maximum global connections available in the database server. The manual commit open Database Connections are tied with the number of open manual commit jdb transactions. The next step should be to capture Memory Diagnostics or All Diagnostics from the server manager process detail page. The JDB transactions for different user sessions logged in the process should be reviewed and all of the open manual JDB transactions should be reviewed for a suspect where the apps BSFN code or tools code has called JDB_InitUser with MANUAL COMMIT MODE but has not called the JDB_FreeUser. The JDB transactions has the file name, line number and function name which should help the developer to locate the code faster and review if the specific code does not call JDB_FreeUser at all or does not call when the code returns with an error or exception path. |
| JDE Cache Records** | This is the total number of JDE Cache Records in the EnterpriseOne server process for the specific user which is created by calling the jdeCacheAdd API, for example. These cache records are generally created by EnterpriseOne Business Functions. They are necessary for Business Functions to do their work. But an increase in this value over time could indicate a leak that needs to be analyzed. The application developer should call the jdeCacheDelete (to delete cache records) or jdeCacheTerminate (to remove the entire cache) API in business function code to fix the JDE Cache Record leak. |
Note:
The items with an * have been added in the 8.98.2.0 release.The items with an ** are new in the 8.98.3.0 release.
All of the columns in the table are sortable. To sort rows in the table based on a particular column, simply click the column header. Clicking the column header again will sort the rows in the table in the reverse order. Using the sort capability, the administrator can identify EnterpriseOne Server processes that are using an "abnormal" amount of memory, CPU, JDE caches, or open JDB transactions (manual-commit OR total).
If there is a process that the administrator wants to analyze in more detail, they should click on the link for the process (in the "Process Name" column) to be taken to the Individual Process page.
12.7.2.3 Evaluate Individual Processes
The individual process pages are used to evaluate user-level data to drill down further in order to diagnose and isolate issues.
These are the navigation steps to access the individual enterprise server process page:
-
Select the enterprise server instance in server manager.
-
You should see the <EnterpriseOne Enterprise Server> instance.
-
Make sure that the server is up and running.
-
Go to the <Runtime Metrics> section.
-
Click on the <Process Detail> link.
-
You should see the <Enterprise server Processes> page.
-
Select the link for specific process under the <Process Name> column.
-
This will present you the <ProcessID> page.
The individual process page has the following sections:
-
General Information (modified).
-
Resource Charts (New).
-
Connected Users (modified).
-
Diagnostics and Recycling (New).
-
Logging and Configurations (not modified).
-
Thread Details (not modified).
The enterprise server will have an individual process page for all E1 processes. There are several new data items as displayed in the graphic and table below.
The information is collected every 20 seconds. However, new data is presented only when the screen is refreshed.
The individual process page begins with a General Information section. The relevant information for the process selected is presented.
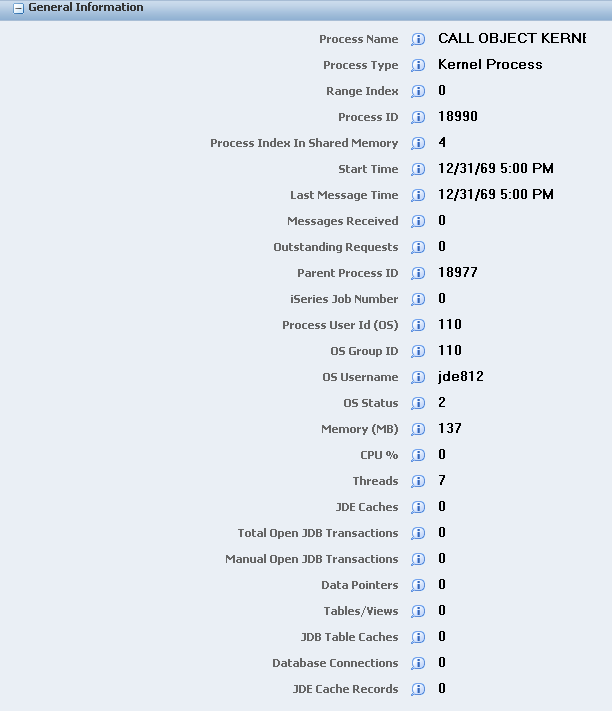
The items in the General Information section are:
| Field | Description |
|---|---|
| Process Name | The name of the kernel process. The name indicates which kernel definition the kernel belongs to. |
| Process Type | The description of the Enterprise Server process type. |
| Kernel Range | The kernel definition index. The Enterprise Server is composed of kernels that process messages from other servers and clients. There are more than thirty different types of kernels. The range index indicates which kernel group this kernel belongs to. |
| Process ID | The operating system assigned process identifier for the kernel process. |
| Process Index In Shared Memory | An internal identifier used to locate the process's position in the shared memory resources that track kernel and network processes. |
| Start Time | The time the process was created. |
| Last Message Time | The last time the kernel performed any activity such as processing incoming JDENET messages. |
| Messages Received | The total number of messages (requests) that have been processed by the kernel process. |
| Outstanding Requests | The number or requests that are queued and are waiting to be processed by the kernel process. |
| Parent Process ID | The operating system assigned process identifier of the parent process. |
| IBM i Job Number | The job number of the process, valid on the IBM i platform only. |
| Process User ID (OS) | The operating system user id under which the process is running. |
| OS Group ID | The group identifier of the os user running the process; valid only on unix based platforms. |
| OS Username | The operating system user name under which the process is running. |
| OS Status | The status of the process as reported by the operating system:
0 = Sleeping 1 = Running 2 = Stopped 3 = Zombie 4 = Other |
| Memory (MB)* (applies to all E1 processes) | The virtual memory usage in megabytes for the process. An increase in this value over time could indicate a leak that needs to be analyzed. |
| CPU %* (applies to all E1 processes) | The amount of %CPU consumed by EnterpriseOne server process. The %CPU is reported directly for SUN and HP platform and is a calculated value in WINDOWS, DB2 for IBM i, AIX and LINUX platform. For example, on a 4-processor machine, a process using all of 1 CPU might be reported as using 25% or 100%. |
| Threads* (applies to all E1 processes) | The number of OS threads stared in the EnterpriseOne server process including any Java threads if the process loads a JDEJVM. |
| JDE Caches* (does not apply to jdenet_n processes) | The cache count for the process. This is the total number of JDE Caches in the EnterpriseOne server process which are opened by calling jdeCacheInit API. These caches are generally created by EnterpriseOne Business Functions. They are necessary for Business Functions to do their work. But an increase in this value over time could indicate a leak that needs to be analyzed. The application developer should call jdeCacheTerminate API in business function code to fix the JDECache leak. |
| Total Open JDB Transactions* (does not apply to jdenet_n processes) | The total number of open JDB transactions which includes both AUTO and MANUAL transaction. This resource is opened by calling JDB_InitUser API which is either called with JDEDB_COMMIT_AUTO or JDEDEB_COMMIT_MANUAL. An increase in this value over time could indicate a leak that needs to be analyzed. The application developer should call JDB_FreeUser API in business function code to fix the JDB Transactions leak. |
| Manual Open JDB Transactions* (does not apply to jdenet_n processes) | The number of MANUAL open JDB transactions are opened by calling JDB_InitUser API with JDEDEB_COMMIT_MANUAL. The number of manual open JDB transactions is directly linked with manual-commit database connections. This number should be zero in a normal environment. If this number is growing then it may result in database connection leaks and may cause the enterprise database to reach the maximum number of connections which will bring the entire EnterpriseOne environment (enterprise server and JAS servers) to a halt and consequently no EnterpriseOne user can get their work done. The application developer should call JDB_FreeUser API in business function code to fix the JDB Transactions leak. |
| Data Pointers* (does not apply to jdenet_n processes) | This reports the number of data pointer slots out of 1000 slots which are used by the current EnterpriseOne server job. The business function code calls jdeStoreDataPtr API to allocate a data pointer slot. The slot index starts at 1001 and goes till a maximum of 2000 for any enterprise server process. The data pointer leak should be fixed by the application developer in the business functions by calling jdeRemoveDataPtr API other wise they will eventually receive the hard error where the process will no not create any new data pointers. |
| Tables/Views* (does not apply to jdenet_n processes) | This report the number of JDB Table handles or JDB View handles opened in the EnterpriseOne server job. This resource is opened by calling JDB_OpenTable and JDB_OpenView API. The application developer should call JDB_CloseTable API to fix the table and view handle leaks. An increase in this value over time could indicate a leak that needs to be analyzed. |
| JDB Table Caches* (does not apply to jdenet_n processes) | This reports the number of JDB Table records cached in the EnterpriseOne server manager. The tables' records are cached when the table is registered in F98613 table using P98613 application or the application BSFN code called JDB_AddTableToCache API to cache the table records. If you are seeing lot of records cached then you might have a high memory usage issue in the EnterpriseOne server job. You should review the F98613 table and make sure you do not have any table which is added for caching by mistake. Also you should review if you have any new BSFN code which is calling the JDB_AddTableToCache API. |
| Database Connections** | The total number of open Database Connections includes AUTOcommit, Select For Update (SFU) and MANUAL-commit connections. An increase in this value over time could indicate a leak that needs to be analyzed. The AUTO and SFU connections have a small maximum limit whereas the MANUAL commit connections have no limit and can grow really high and will eventually hit the maximum global connections available in the database server. The manual commit open Database Connections are tied with the number of open manual commit jdb transactions. The next step should be to capture Memory Diagnostics or All Diagnostics from the server manager process detail page. The JDB transactions for different user sessions logged in the process should be reviewed and all of the open manual JDB transactions should be reviewed for a suspect where the apps BSFN code or tools code has called JDB_InitUser with MANUAL COMMIT MODE but has not called the JDB_FreeUser. The JDB transactions has the file name, line number and function name which should help the developer to locate the code faster and review if the specific code does not call JDB_FreeUser at all or does not call when the code returns with an error or exception path. |
| JDE Cache Records** | This is the total number of JDE Cache Records in the EnterpriseOne server process for the specific user which is created by calling the jdeCacheAdd API, for example. These cache records are generally created by EnterpriseOne Business Functions. They are necessary for Business Functions to do their work. But an increase in this value over time could indicate a leak that needs to be analyzed. The application developer should call the jdeCacheDelete (to delete cache records) or jdeCacheTerminate (to remove the entire cache) API in business function code to fix the JDE Cache Record leak. |
Note:
The items with an * have been added in the 8.98.2.0 release.The items with an ** are new in the 8.98.3.0 release.
The enterprise server process ID page has a new section called Resource Charts. The charts are available for all actively running EnterpriseOne server processes. The time-frame of the data collected will be indicated along the x-axis of the graphs. How much data is represented will depend on when the Server Manager Console services were started and the collection intervals for the monitors that were specified (refer to Configuration Setup).
Figure 12-10 Resource Charts –Process ID: 21037.
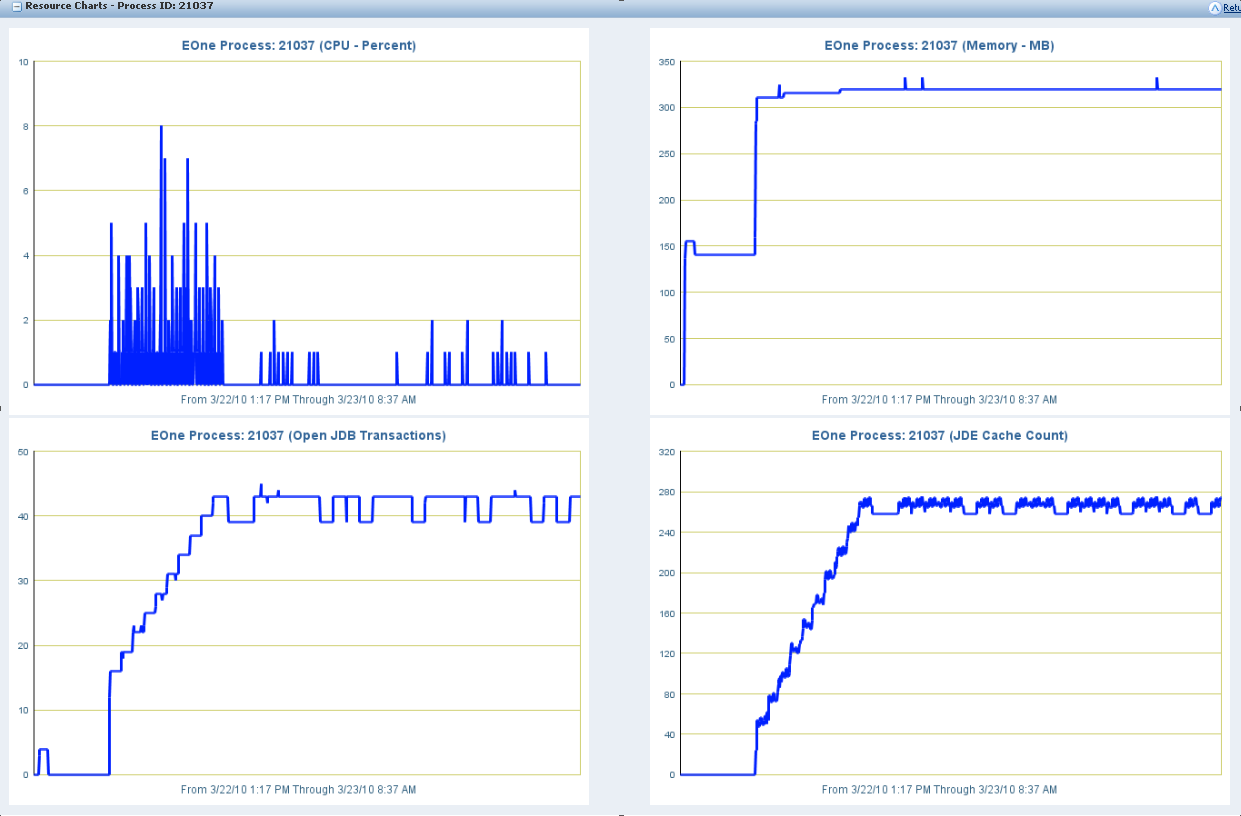
Description of "Figure 12-10 Resource Charts –Process ID: 21037."
The following two enterprise resource charts are applicable for all EnterpriseOne server process including JDENET_N, JDENET_K, RUNBATCH, PORTTEST etc.
| Chart | Description |
|---|---|
| Eone Process: Process ID (CPU Usage - Percent) | This chart reports the percent CPU used by this EnterpriseOne server process. If you see that a certain EnterpriseOne process is taking a lot of CPU over time like a CallObject kernel, you should then take CPU diagnostics to see if there is any looping pattern in a specific business function. It is normal for a RUNBATCH process to a take an entire CPU, so you should not bother about RUNBATCH unless the RUNBATCH process takes more than the normal execution time. If the percent CPU is low for a RUNBATCH process, it might be a hung RUNBATCH process and you should take CPU diagnostics to review if any specific business function is hung. |
| Eone Process: Process ID (Memory - MB) | This chart reports the memory used in megabytes by this EnterpriseOne server process. If you see an increasing trend in memory usage, then the process might be leaking memory. |
The following two enterprise resource charts are applicable to only non-jdenet_n EnterpriseOne server processes like JDENET_K, RUNBATCH, PORTTEST etc.
| Chart | Description |
|---|---|
| Eone Process: Process ID (Open JDB Transactions) | This chart reports the number of open JDB Transactions in the EnterpriseOne server process. If you see increasing number of open JDB Transactions then the process might be running business function code which is leaking JDB Transactions. |
| Eone Process: Process ID (JDE Cache Count) | This chart reports the number of open JDE Cache handles in the EnterpriseOne server process. If you see increasing number of open JDE Cache handles then the process might be running business function code which is leaking JDE Cache handles. |
The Connected Users section provides data for any users associated with the kernel process.
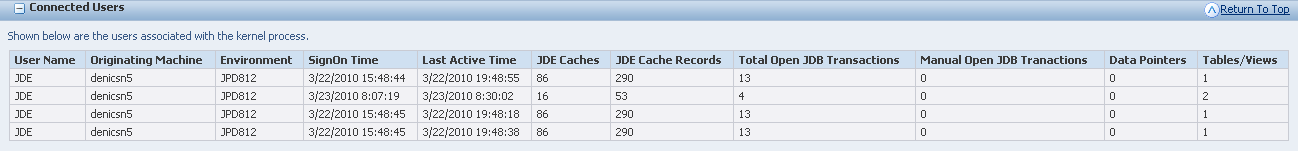
The following three attributes are the existing attributes of user session for both CallObject kernel and Security kernel:
| Field | Description |
|---|---|
| User Name | The name of the EnterpriseOne user who is signed on to the kernel process. |
| Originating Machine | The machine name from where the user signed in. For web client user, this will be the JAS server name. |
| SignOn Time | The time EnterpriseOne user signed on to this process. |
The connected user section has been modified to have eight new attributes only for CallObject kernel process:
| Field | Description |
|---|---|
| Environment | This reports environment of the logged in User in the CallObject kernel. This information will be useful to debug an issue which is specific to a path code or is specific to an environment. |
| Last Active Time | Last time the user performed any work on the CallObject kernel process. This will determine the staleness of user session and is a good metric when an EnterpriseOne user is logged for day probably from a third party integration system using EnterpriseOne Java connector, COM connector. |
| JDE Caches | This reports the number of JDE Caches opened by the specific user. If this number is high for this user compared to other users, then you should collect the memory diagnostics and review the JDE Caches opened by this user. The application developer should fix the business function code to free the JDECache leaks. |
| JDE Cache Records** | This is the total number of JDE Cache Records in the EnterpriseOne server process for the specific user which is created by calling the jdeCacheAdd API, for example. These cache records are generally created by EnterpriseOne Business Functions. They are necessary for Business Functions to do their work. But an increase in this value over time could indicate a leak that needs to be analyzed. The application developer should call the jdeCacheDelete (to delete cache records) or jdeCacheTerminate (to remove the entire cache) API in business function code to fix the JDE Cache Record leak. |
| Total Open JDB Transactions | This reports the total number of open JDB Transactions for the specific user. If this number is high for this user compared to other users, then you should collect the memory diagnostics and review the JDB Transactionsopened by this user. The application developer should fix the business function code to free the JDB Transaction leaks. |
| Manual Open JDB Transactions | This reports the total number of open Manual-Commit JDB Transactions for the specific user. If this number is high for this user compared to other users, then you should collect the memory diagnostics and review the JDB Transactions opened by this user. The application developer should fix the business function code to free the JDB Transaction leaks. |
| Data Pointers | This reports the number of Data Pointers used by the specific user. If this number is high for this user compared to other users, then you should collect the memory diagnostics and review the Data Pointers opened by this user. The application developer should fix the business function code to free the Data Pointer leaks. |
| Tables/Views | This reports the number of JDB Tables or JDB Views opened by the specific user. If this number is high for this user compared to other users, then you should collect the memory diagnostics and review the JDB Tables or JDB Views opened by this user. The application developer should fix the business function code to free the JDB Tables or JDB Views leaks. |
12.7.2.4 Get Memory / CPU Diagnostics
The enterprise server process ID page is used to evaluate on-demand diagnostics and has a new section called Diagnostics and Recycling.
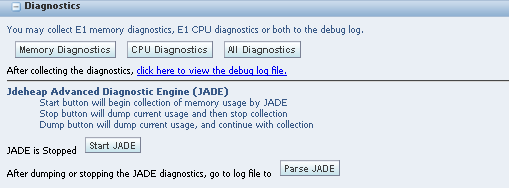
The Diagnostics section is only applicable to CallObject Kernels, RUNBATCHprocesses, and Subsystem UBE's.
The diagnostics section allows the collection of the following four types of diagnostics:
-
Memory diagnostics - Once the User clicks this, the system will write the in-memory EnterpriseOne objects diagnostics data to the EnterpriseOne server process JDEDEBUG log. This should be used to debug EnterpriseOne Object leaks causing EnterpriseOne process memory growth. The diagnostics data has the following structure.
-
Process OS data
-
Memory (megabytes)
-
CPU (percent)
-
Threads (number of threads)
-
-
Memory data
-
Process level data shared by all user sessions.
1. Environment data
2. JDB Table Cache data
3. Database Connection data
-
User Sessions
1. Open JDB Transactions
2. Open Tables or Views
3. Open JDECaches
4. Open Data Pointers
-
-
CPU Diagnostics - Once the User clicks this, the system will write the in-memory business function call stack(s) to the EnterpriseOne server process JDEDEBUG log (whether or not debug logging has been enabled). This should be used to debug hanging (low CPU) or looping (high CPU) EnterpriseOne processes. The following data will be displayed in the CPU diagnostics.
-
Process OS data
-
Memory (megabytes)
-
CPU (percent)
-
Threads (number of threads)
-
-
CPU Diagnostics
-
BSFN Call Stacks
1. BSFN call stack for thread 1
2. BSFN call stack for thread 2 (thread BSFN call stacks beyond the first thread are only applicable to CallObject Kernel processes)
3. etc.
-
OS Call Stacks
1. OS call stack for thread 1
2. OS call stack for thread 2 (thread OS call stacks beyond the first thread are only applicable to CallObject Kernel processes)
3. etc.
-
-
-
All Diagnostics - Once the user clicks this, the system will generate a combination of Memory AND CPU diagnostics. The following data will be displayed in All diagnostics.
-
Process OS data
-
Memory (megabytes)
-
CPU (percent)
-
Threads (number of threads)
-
-
Memory data
-
Process level data shared by all user sessions.
1. Environment data
2. JDB Table Cache data
3. Database connection data
-
User Sessions
Open JDB Transactions
Open Tables of Views
Open JDECaches
Open Data Pointers
-
-
CPU Diagnostics
-
BSFN Call Stacks
1. BSFN call stack for thread 1
2. BSFN call stack for thread 2 (thread BSFN call stacks beyond the first thread are only applicable to CallObject Kernel processes)
3. etc.
-
OS Call Stacks
1. OS call stack for thread 1
2. OS call stack for thread 2 (thread OS call stacks beyond the first thread are only applicable to CallObject Kernel processes)
3. etc.
-
-
-
JADE -
-
Start button will begin collection of memory usage
JADE can be set up statically in jde.ini. The functionality is similar to BMD with levels 1, 2, and 3 available (see advanced Profiling). The default setting is JADE level 2.
-
Stop button will dump current usage and then stop collection
-
Dump button will dump current usage and then stop collection
-
Parse JADE button will bring up the log file after dumping or stopping JADE diagnostics.
-
After the diagnostics have been collected for Memory Diagnostics, CPU Diagnostics, or All Diagnostics, then click on the click here to view the debug log file link to view the diagnostics.
Here is a sample All Diagnostics:
Apr 5 16:31:22.423254 jdb_utl1.c13553 - 5504/5 WRK:JDE_000BDB60_P4310 User initiated process dump
(CPU Diagnostics):
********** Begin OS Data **********
Memory Usage = 257MB
CPU Usage = 1%
Number of Threads = 7
********** End OS Data **********
********** Begin Detailed CPU Data **********
********** Begin BSFN Call Stacks **********
CALLSTACK,5,WRK:JDE_000BDB60_P4310,JDE,*ALL,JPD812,NONE,P4310,denicsn5,ZJDE0001
libCDIST.so/UNKNOWN/F4311EndDoc
********** End BSFN Call Stacks **********
********** Begin OS Call Stacks **********
5504: jdenet_k 6014
----------------- lwp# 2 / thread# 2 --------------------
fc340408 lwp_park (0, 0, 0)
fc33a49c cond_wait_queue (24e8d0, bd298, 0, 0, 0, 0) + 28
fc33aa1c cond_wait (24e8d0, bd298, 0, 0, 20, 0) + 10
fc33aa58 pthread_cond_wait (24e8d0, bd298, 0, 0, 20, 1) + 8
fe0f3db8 psthread_cond_wait (24e6c8, bd088, 1, 1, 1, fe10d810) + 274
fe352da4 ps_blocking_queue_dequeue (24e4a0, f637ff24, bd088, 0, fe10d7d8, 20) + 224
fe354214 psthread_pool_worker_function (24e4a0, 0, d5cd4, d5cc8, fe10d7b8, fe367de8) + 4a8
fe0f48fc threadFunctionWrapper (c3548, 204, 0, c4, c354b, fe353d6c) + f4
fc340368 _lwp_start (0, 0, 0, 0, 0, 0)
----------------- lwp# 5 / thread# 3 --------------------
fc341850 waitid (0, 15c9, f58e6ab0, 3)
fc334758 waitpid (15c9, f58e6c04, 0, 0, f58e6c5c, faa82740) + 60
fc327eec system (1b3360, fc36ff74, 20000, 1, fc368288, f58e6c5c) + 2ec
fd9e6350 jdeSystem (f58e6db8, 6a, 0, 1b3360, 4b, f58e6db8) + 50
ff30f6bc logCallStackOnUnix (1580, 0, f58e7694, f58e74b1, 24fc, 2500) + 130
ff30fb0c allocCallStackUnix (0, f58e81e4, ff316d56, 0, 2518, 2400) + 88
ff30fd7c jdeAllocCallStack (1580, f58e81e4, f58e83ec, 8c00, 50e598, f58e83ec) + 20
fed27dd8 logProcessDumpData (2, 0, 0, ffffffff, 810060, 8c00) + e04
f6571310 doQueryDiagnostics (238, 810060, 0, f74bb544, 234, 0) + 3d8
f656eaf0 performRequestInternal (82f3e0, 1, 0, ae6f88, ff0ed1c0, 0) + 51c
f656e46c dballPerformRequest (82f3e0, 8303d0, 0, 8303d0, 8303d3, 3) + 3e4
feb937a4 JDB_DBPerformRequest (aeaad8, 82f3e0, ae6f88, 18a268, 18a340, 18a268) + e4
fe13a894 TM_DBPerformRequest (65be18, 0, ae6f88, 8ab250, 7d70c0, 5) + 41c
fec083fc InsertTable (8ab250, 7d70c0, 0, ae6f88, f58eb1f0, 0) + 392c
fec0bf74 JDB_InsertTable (8ab250, f32d3854, 0, f58ed714, 0, ff338dfc) + 208
f214177c IXT4311Z1_EndDocWriteNewOrderDetail_2 (f32d3818, 7d0868, 675720, a53750, f58f4c28,
f58f6bfc) + dd4
f213efbc IXT4311Z1_EndDocProcessCurrentDetailLine (3e5d48, 7d0868, 675720, f58f770c, a53750,
f58f62e0) + 1338
f2139694 F4311EndDoc (7d0868, 675720, a53750, 31, 0, 1) + 16d4
fefb88f8 jdeCallObjectV2 (1b8df8, 7d0868, 506be0, 1, ff0c36fc, 20) + a3d0
fefae518 jdeCallObject (1b8df8, 0, 7d0868, 0, fe963658, f58feea4) + 38
fe79f4dc JDEK_ProcessCallRequest (f58fef58, 6e1018, bdb60, 3e5d48, 7d0868, 20) + 3d30
JD Edwards EnterpriseOne Tools 8.98 Update 3
Kernel Resource Management
Copyright © 2010, Oracle. All rights reserved 22
fe79a5e8 JDEK_StartCallRequest (f58ffc40, 6e1018, 0, 3e5d48, bdb60, 0) + f74
fe77db24 runBusinessFunction (94ef0, 0, 0, 7174, ff338dff, fe93c6ec) + 328
fe77dea8 runCallObjectJob (94ef0, 0, 94f00, 94f00, 94f00, 20) + 5c
fe354394 psthread_pool_worker_function (0, 0, 74, d5cc8, fe10d7b8, fe367de8) + 628
fe0f48fc threadFunctionWrapper (c34c8, 204, 0, c4, c34cb, fe353d6c) + f4
fc340368 _lwp_start (0, 0, 0, 0, 0, 0)
********** End OS Call Stacks **********
********** End Detailed CPU Data **********
Apr 5 16:32:06.733801 jdb_utl1.c13485 - 5504/3 WRK:Free Remote Env User initiated process dump
(Memory Diagnostics):
********** Begin OS Data **********
Memory Usage = 264MB
CPU Usage = 1%
Number of Threads = 7
********** End OS Data **********
********** Begin Detailed Memory Data **********
********** Begin Process Data **********
ENVIRONMENT,Ptr=0026fbd8,Env=JPD812,PathCode=PD812
JDBTABLECACHE,Ptr=005a5250,Name=JDB_BV_1270506634JPD812F4009,#Records=1
JDBTABLECACHE,Ptr=005ae618,Name=JDB_BV_1270506634JPD812F40203,#Records=2
JDBTABLECACHE,Ptr=005b8fb0,Name=JDB_BV_1270506634JPD812F40205,#Records=1
JDBTABLECACHE,Ptr=005eb458,Name=JDB_BV_1270506634JPD812F41001,#Records=2
JDBTABLECACHE,Ptr=00184f10,Name=JDB_BV_1270506637JPD812F41002,#Records=8
JDBTABLECACHE,Ptr=00647ae8,Name=JDB_BV_1270506637JPD812F7306,#Records=1
JDBTABLECACHE,Ptr=0065c138,Name=JDB_BV_1270506637JPD812F99410,#Records=2
JDBTABLECACHE,Ptr=0067c3a0,Name=JDB_BV_1270506637JPD812F0004,#Records=25
JDBTABLECACHE,Ptr=00685f60,Name=JDB_BV_1270506637JPD812F0005,#Records=27
JDBTABLECACHE,Ptr=0068b8d0,Name=JDB_BV_1270506637JPD812F0006,#Records=1
JDBTABLECACHE,Ptr=006cf0f0,Name=JDB_BV_1270506637JPD812F0008,#Records=1
JDBTABLECACHE,Ptr=006d7bc8,Name=JDB_BV_1270506637JPD812F0010,#Records=2
JDBTABLECACHE,Ptr=003c1a38,Name=JDB_BV_1270506638JPD812F1609,#Records=1
OCIDBCONN,Ptr=00426850,DBServer=densun28,DBUser=JDE,TNSDB=orcl,ConnState=AutoInUse,Comm
itMode=A,RefCount=39
OCIDBCONN,Ptr=006e2780,DBServer=densun28,DBUser=JDE,TNSDB=orcl,ConnState=ManualInUse,Co
mmitMode=M,RefCount=1
OCIDBCONN,Ptr=0052fc50,DBServer=densun28,DBUser=JDE,TNSDB=orcl,ConnState=ManualAvailable,C
ommitMode=M,RefCount=0
OCIDBCONN,Ptr=00871ec0,DBServer=densun28,DBUser=JDE,TNSDB=orcl,ConnState=ManualInUse,Co
mmitMode=M,RefCount=1
OCIDBCONN,Ptr=00abf430,DBServer=densun28,DBUser=JDE,TNSDB=orcl,ConnState=ManualInUse,Com
mitMode=M,RefCount=1
********** End Process Data **********
********** Begin Session Data **********
SESSION,Ptr=000bdb60,User=JDE,Env=JPD812,Role=*ALL,Machine=denicsn5,SignOnTime= 4/ 5/2010
16:30:38,LastActiveTime= 4/ 5/2010 16:32:06
OPENJDBTRANSACTION,Ptr=001819c0,CommitMode=Auto,Owner=InitUser,AppName=(UNKNOWN),File
=jdb_ctl.c,Function=JDB_LoadEnv,Line=5829
TABLE,Ptr=0048d0a0,Name=F0013,CommitStatus=Active,File=jdb_curr.c,Function=JDB_RetrieveF0013Ro
wUsingCurrencyCode,Line=73
TABLE,Ptr=00aa41f0,Name=F0010,CommitStatus=Active,File=jdb_curr.c,Function=JDB_RetrieveF0010Ro
wUsingCompanyNumber,Line=246
OPENJDBTRANSACTION,Ptr=007e88a0,CommitMode=Auto,Owner=InitUser,AppName=(UNKNOWN),File
=jdb_ctl.c,Function=CallStartupBusinessFunction,Line=8551
JDECACHE,Ptr=0071d1e0,Name=1XT4311Z1A,#Cursors=1,#Records=0,#Indices=1,#References=1,File=x
t4311z1.c,Function=F4311InitializeCaching,Line=23018
JDECACHE,Ptr=00743aa8,Name=1XT4311Z1B,#Cursors=1,#Records=0,#Indices=2,#References=1,File=x
t4311z1.c,Function=F4311InitializeCaching,Line=23027
JDECACHE,Ptr=008d28c0,Name=1XT4311Z1C,#Cursors=1,#Records=0,#Indices=1,#References=4,File=x
t4311z1.c,Function=IXT4311Z1_InitiateOrderCache,Line=5758
JDECACHE,Ptr=009426b0,Name=1B4302570Cache,#Cursors=1,#Records=0,#Indices=1,#References=2,F
ile=b4302570.c,Function=ApprovalsFieldConstants,Line=158
JDECACHE,Ptr=006801f0,Name=1F45UI73,#Cursors=1,#Records=0,#Indices=2,#References=4,File=b450
0200.c,Function=F4573GetNextFreeGood,Line=100
JD Edwards EnterpriseOne Tools 8.98 Update 3
Kernel Resource Management
Copyright © 2010, Oracle. All rights reserved 23
JDECACHE,Ptr=009399d8,Name=1B3201470213088,#Cursors=1,#Records=0,#Indices=7,#References=3,
File=b3201470.c,Function=I3201470_CreateInitCache,Line=732
JDECACHE,Ptr=008c87d0,Name=1B3201470213090,#Cursors=1,#Records=0,#Indices=7,#References=3,
File=b3201470.c,Function=I3201470_CreateInitCache,Line=732
********** End Session Data **********
********** End Detailed Memory Data **********
Please note that each of the memory objects listed in the Memory and All Diagnostics file will show the File, Function, and Line number for JDECACHE, TABLE/VIEW, OPENJDBTRANSACTION, and DATAPOINTER objects. For example:
JDECACHE,Ptr=0071d1e0,Name=1XT4311Z1A,#Cursors=1,#Records=0,#Indices=1,#References=1,File=x
t4311z1.c,Function=F4311InitializeCaching,Line=23018
TABLE,Ptr=01eb8a48,Name=F0013,CommitStatus=Active,File=jdb_curr.c,Function=JDB_RetrieveF0013RowUsingCurrencyCode,Line=73
OPENJDBTRANSACTION,Ptr=02d05328,CommitMode=Auto,Owner=InitUser,AppName=(UNKNOWN),File
=jdb_ctl.c,Function=JDB_LoadEnv,Line=5845
In order to get all of the added contextual information in 8.98.3.0 and higher releases on Windows Platform, please ensure that /Oy- is there under OptimizationFlags and /MAP is there under LinkFlags in [BSFN BUILD] section.
[BSFN BUILD]
OptimizationFlags=/FD /Gz /O2 /Zi /MD /W4 /EHs /Gy /Oy-
LinkFlags=/DLL /DEBUG /SUBSYSTEM:windows /FORCE:MULTIPLE
/FORCE:UNRESOLVED /INCREMENTAL:YES /VERBOSE /MAP /WARN:3
Note:
The columns with an * are new columns that have been added in the 8.98.3.0 release.12.7.2.5 Corrective Actions
Cache or Recycling actions are available in the Corrective Actions section.
The Clear Cache button is now available to clear internal tools caches for the process that has been selected. This should reduce the memory footprint of the process and may cause some performance impact while the caches are being rebuilt.
You can now recycle an individual kernel which prevents a single process from impacting or bringing down the entire system. It also prevents new users from being associated with the kernel and possibly being impacted if the kernel zombies. This allows the system to gracefully shut down the kernel and reclaim resources.
There is a new button called Recycle Kernel that is used to begin recycling CallObject kernel processes on demand. The purpose of the recycling button is to allow administrators to gracefully shut down a process that appears to have problems.
Figure 12-13 Clear Cache and Recycle Kernel corrective actions
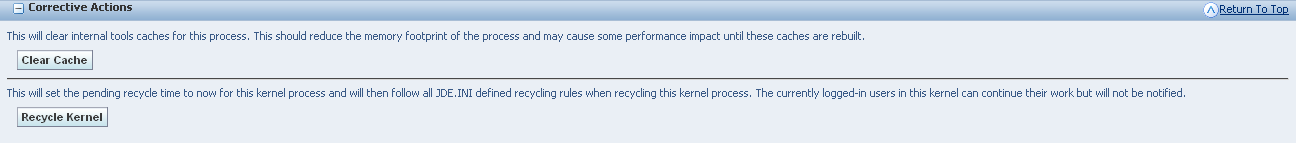
Description of "Figure 12-13 Clear Cache and Recycle Kernel corrective actions"
Previously, the only options for an administrator were to allow the process to continue running or to kill the process from the OS. If the process were allowed to continue, it could become attached to new user sessions, which may be detrimental to those sessions, and which may make the perceived problems within the kernel process even worse than what they might have been. On the other hand, if the process were killed manually, the applications that were currently running would be ungracefully stopped, which would prevent the applications from completing, and would force any open transactions to be rolled back.
The recycling option tries to avoid both of those issues. When a kernel process begins recycling, there will be no additional user sessions attached to it. But, the kernel is not stopped immediately, which allows the current users to complete their processing. When all users have completed their processing, then that kernel will be shut down. Before KRM, kernel recycling was only available based on JDE.INI settings. The CallObject kernels could be recycled at a scheduled time. With the new KRM "Recycle Kernel" button, a selected kernel process can begin recycling on demand. Because runbatch and subsystem processes cannot be recycled, the Recycle Kernel button is not available for these processes.
There are additional JDE.INI settings that can affect how the kernels are recycled. After the time to begin recycling has passed, the state of the kernel goes into a "pending recycling" state. While recycling is pending, the kernel accepts no new user sessions. When all existing user sessions have logged off the kernel will shut down. There is a JDE.INI setting that specifies the length of a period of inactivity, before each user session is considered inactive. When that is set, and there are only inactive user sessions, the kernel will also shut down. The default time for the inactivity period is six hours. Another JDE.INI setting is the length of time before a forced termination occurs. When that period expires, the kernel will shut down, even if there are active users at that time. The assumption is that those user sessions have some reason why they will never initiate their own session logoff. For instance, the user could be stuck in a deadlock, or the user could be stuck in a loop that it cannot exit. There could also be users that are intentionally never logged off (there are some use cases for this with Interop user sessions). The default time for the forced termination is twelve hours.
Within the context of the KRM Recycle Kernel button, those JDE.INI recycling parameters will apply, even if scheduled kernel recycling is not set. The beginning of the recycling period will be when the Recycle Kernel button is pressed.
12.7.2.6 Inline Corrective / Diagnostic Actions
Call Object or Runbatch Crash due to Memory Corruption
CallObject may go to a Zombie or Crashed state when it encounters a bad memory in the business function code. The same behavior is to be expected for a Runbatch process. This crash will produce an extra log file with .dmp.log as its extension. Viewing the .dmp file for a crashed CallObject will show all the threads which were running at the time of the crash. On System-i enterprise server, there will not be any .dmp file. Instead the callstacks for all threads will be logged in jde.log.
The thread which encountered the bad memory and crashed will be highlighted in "red" color and often times will serve as a good starting point for investigation of the bug.
Figure 12-14 Log .dmp files highlighted in red.
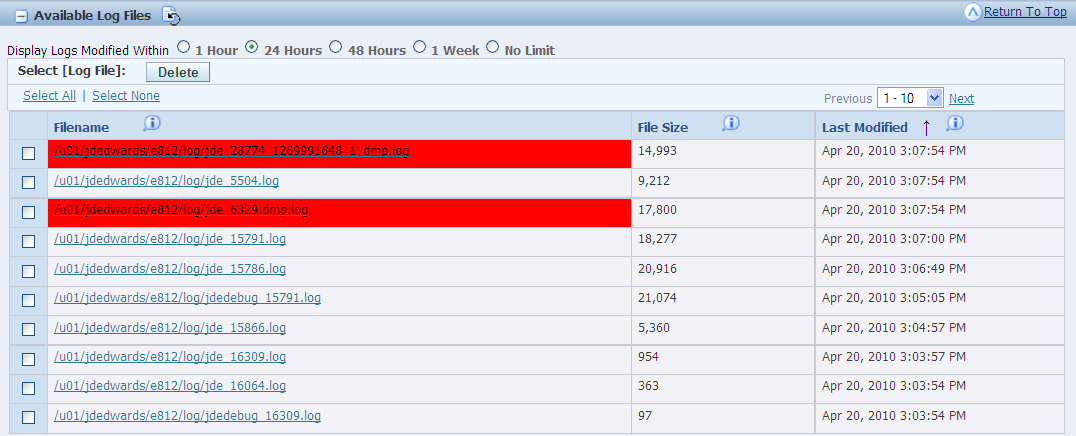
Description of "Figure 12-14 Log .dmp files highlighted in red."
When analyzing the .dmp file, begin by looking for the thread which contains the jdeLogCallStack function, as this is the thread which initiated the crash.
This thread may not always be the root cause of the problem, as it could be a victim of another thread which caused memory corruption but did not crash itself. Crashes of this kind will most likely have a message from the given Operating System in their corresponding jde.logs such as "ACCESS VIOLATION".
This is a dmp.log for a crash due to Memory Corruption:
*****************************************
Tue Mar 30 17:27:28 MDT 2010
*****************************************
Generating call stacks for PID 28774
*****************************************
28774: jdenet_k 6014
----------------- lwp# 1 / thread# 1 --------------------
fc342d74 msgsys (2, 34000023, 13f2d58, 200c, 0, 0)
fc333b84 msgrcv (34000023, 13f2d58, 200c, 0, 0, 0) + 68
ff23e7b4 receiveMessage (5, 34000023, 200c, 0, 0, 0) + 1dc
ff21d73c ipcGetQueueEntry (92d60, ffbfc0c4, ffbfc0c8, ffbfe0d4, 5, 13f2d58) + 334
ff139a24 getExternalQueueEntry (0, 5, 1, ffbff28c, fb3a00ab, ff1d1b58) + 35c
ff195c60 getKernelQueueEntry (0, 8fd68, ffbff28c, 92d60, 8fd54, 8fd58) + 49c
ff19606c processKernelQueue (ffbff28c, fb3a0000, 0, 0, 0, ff1cd2c8) + 300
ff16e250 JDENET_RunKernel (20, 8fd68, 1, ff1cd2c8, 0, 5) + 428
00011cc0 main (0, 0, 4c, 0, 2218c, 0) + 6bc
000111d4 _start (0, 0, 0, 0, 0, 0) + 108
----------------- lwp# 2 / thread# 2 --------------------
fc340408 lwp_park (0, 0, 0)
f6667034 kpuexec (f8e9d800, f1aa34, f14ce0, 0, 0, 18814c) + 2b8
f65c5e50 OCIStmtExecute (188118, f1aa34, 0, 0, 0, 0) + 2c
f657e348 BFOCIStmtExecute (188118, f1aa34, f14ce0, 0, 0, 0) + 28
f656eacc performRequestInternal (116d930, 0, 116d938, 116ca98, ff0ed1c0, 0) + 4f8
f656e46c dballPerformRequest (116d930, 116e920, 0, 116e920, 116e923, 1000) + 3e4
feb937a4 JDB_DBPerformRequest (93bc18, 116d930, 116ca98, 181240, 181318, 181240) + e4
fe13a894 TM_DBPerformRequest (17d050, 1, 116ca98, a6f318, 1b3ab8, 5) + 41c
feba75b4 SelectKeyed (a6f318, 17d050, f635eecc, 1, 1, 1) + 1ec8
febb3c00 FetchKeyed (0, 1, a7cb68, 116ca98, feddd4dc, 0) + 286c
febb114c JDB_FetchKeyed (a6f318, 1, a7cb68, ff338dfc, f636128c, 0) + 214
ee688ab4 EditSystemExistenceF99410 (a7cb68, 689800, f6367910, 3, ff976770, 110c6e0) + 30c
fefb88f8 jdeCallObjectV2 (f1f3d5ec, d38030, a73c40, 3, ff0c36fc, 20) + a3d0
fefae518 jdeCallObject (f1f3d5ec, 0, d38030, 0, 0, 0) + 38
f0b6b804 I4500250_GetGrowerSystemConstant (d38030, a9be40, f6367a80, f6367912, ff990790, 0) + e8
f0b65e50 CalculatePurchasePrice (d38030, a9be40, f6370b3c, f6367a84, ff98bfa8, f6370bda) + 220
fefb88f8 jdeCallObjectV2 (f1ff38fc, d38030, e1af50, 2, ff0c36fc, 20) + a3d0
fefae518 jdeCallObject (f1ff38fc, 0, d38030, 0, 0, 0) + 38
f0f500cc IXTF4311Z1_CalcPurchasePrice (a9be40, f63765ce, 1243948, 1243688, f6376ce8, f63756f0) +
15d8
f0f39fd0 IXT4311Z1_F4311EditLineInternalFunctions (d38030, a9be40, 1243688, f6376f38, 0, f63756f0) +
23b8
fefb88f8 jdeCallObjectV2 (6f7a20, d38030, d28008, 1, ff0c36fc, 20) + a3d0
fefae518 jdeCallObject (6f7a20, 0, d38030, 0, fe963658, f637eea4) + 38
fe79f4dc JDEK_ProcessCallRequest (f637ef58, f076b0, 7d9d08, a80f90, d38030, 20) + 3d30
fe79a5e8 JDEK_StartCallRequest (f637fc40, f076b0, 0, a80f90, 7d9d08, 0) + f74
fe77db24 runBusinessFunction (c44eb8, 0, 0, 7174, ff338dff, fe93c6ec) + 328
fe77dea8 runCallObjectJob (c44eb8, 0, c44ec8, c44ec8, c44ec8, 20) + 5c
fe354394 psthread_pool_worker_function (0, 0, 74, d5cc8, fe10d7b8, fe367de8) + 628
fe0f48fc threadFunctionWrapper (c3548, 204, 0, c4, c354b, fe353d6c) + f4
fc340368 _lwp_start (0, 0, 0, 0, 0, 0)
----------------- lwp# 3 / thread# 3 --------------------
fc340408 lwp_park (0, 0, 0)
fc33a49c cond_wait_queue (2c2350, 2fc040, 0, 0, 0, 0) + 28
fc33aa1c cond_wait (2c2350, 2fc040, 0, 0, 20, 0) + 10
fc33aa58 pthread_cond_wait (2c2350, 2fc040, 0, 0, 20, 1) + 8
fe0f3db8 psthread_cond_wait (2c2148, 2fbe30, 1, 1, 1, fe10d810) + 274
fe352da4 ps_blocking_queue_dequeue (2c1f20, f5ffff24, 2fbe30, 0, fe10d7d8, 20) + 224
fe354214 psthread_pool_worker_function (2c1f20, 0, d5cd4, d5cc8, fe10d7b8, fe367de8) + 4a8
fe0f48fc threadFunctionWrapper (c3588, 204, 0, c4, c358b, fe353d6c) + f4
fc340368 _lwp_start (0, 0, 0, 0, 0, 0)
----------------- lwp# 4 / thread# 4 --------------------
fc340408 lwp_park (0, 0, 0)
f6667034 kpuexec (f8e9d800, f84e4c, f4e190, 0, 0, 18814c) + 2b8
f65c5e50 OCIStmtExecute (188118, f84e4c, 0, 0, 0, 0) + 2c
f657e348 BFOCIStmtExecute (188118, f84e4c, f4e190, 0, 0, 0) + 28
f656eacc performRequestInternal (11c2750, 0, 11c2758, 11c0b10, ff0ed1c0, 0) + 4f8
f656e46c dballPerformRequest (11c2750, 11c3740, 0, 11c3740, 11c3743, 1000) + 3e4
feb937a4 JDB_DBPerformRequest (a6fa80, 11c2750, 11c0b10, 181240, 181318, 181240) + e4
fe13a894 TM_DBPerformRequest (3511d8, 1, 11c0b10, c93e90, 1b3ab8, 5) + 41c
feba75b4 SelectKeyed (c93e90, 3511d8, f58deecc, 1, 1, 1) + 1ec8
febb3c00 FetchKeyed (0, 1, a7ce68, 11c0b10, feddd4dc, 0) + 286c
febb114c JDB_FetchKeyed (c93e90, 1, a7ce68, ff338dfc, f58e128c, 0) + 214
ee688ab4 EditSystemExistenceF99410 (a7ce68, 689800, f58e7910, 3, ff976770, 500e90) + 30c
fefb88f8 jdeCallObjectV2 (f1f3d5ec, 112a060, a73e48, 3, ff0c36fc, 20) + a3d0
fefae518 jdeCallObject (f1f3d5ec, 0, 112a060, 0, 0, 0) + 38
f0b6b804 I4500250_GetGrowerSystemConstant (112a060, 7aa228, f58e7a80, f58e7912, ff990790, 0) + e8
f0b65e50 CalculatePurchasePrice (112a060, 7aa228, f58f0b3c, f58e7a84, ff98bfa8, f58f0bda) + 220
fefb88f8 jdeCallObjectV2 (f1ff38fc, 112a060, f07708, 2, ff0c36fc, 20) + a3d0
fefae518 jdeCallObject (f1ff38fc, 0, 112a060, 0, 0, 0) + 38
f0f500cc IXTF4311Z1_CalcPurchasePrice (7aa228, f58f65ce, a9a898, a9a5d8, f58f6ce8, f58f56f0) + 15d8
f0f39fd0 IXT4311Z1_F4311EditLineInternalFunctions (112a060, 7aa228, a9a5d8, f58f6f38, 0, f58f56f0) + 23b8
fefb88f8 jdeCallObjectV2 (b81968, 112a060, 928860, 1, ff0c36fc, 20) + a3d0
fefae518 jdeCallObject (b81968, 0, 112a060, 0, fe963658, f58feea4) + 38
fe79f4dc JDEK_ProcessCallRequest (f58fef58, 13e3c58, 8a7968, 7471c8, 112a060, 20) + 3d30
fe79a5e8 JDEK_StartCallRequest (f58ffc40, 13e3c58, 0, 7471c8, 8a7968, 0) + f74
fe77db24 runBusinessFunction (1116ff8, 0, 0, 7174, ff338dff, fe93c6ec) + 328
fe77dea8 runCallObjectJob (1116ff8, 0, 1117008, 1117008, 1117008, 20) + 5c
fe354394 psthread_pool_worker_function (0, 0, 74, d5cc8, fe10d7b8, fe367de8) + 628
fe0f48fc threadFunctionWrapper (c35c8, 204, 0, c4, c35cb, fe353d6c) + f4
fc340368 _lwp_start (0, 0, 0, 0, 0, 0)
----------------- lwp# 5 / thread# 5 --------------------
fc341850 waitid (0, 7170, f555c420, 3)
fc334758 waitpid (7170, f555c564, 0, 0, 0, f7fe0c00) + 60
ff30f39c logCallStackOnUnixSigSafe (0, ff316748, f555c581, 24dc, 7170, ff3351f4) + b8
ff310038 jdeLogCallStack (7066, ff338e64, 2400, ff338dfc, 0, ff3351f4) + 1e8  Start Here
ff1470ec krnlSignalHandler (b, 1000, 7066, ff1d217c, 3000, 1154) + 4e0
fc340494 __sighndlr (b, 0, f555ca38, ff146c0c, 0, 1) + c
JD Edwards EnterpriseOne Tools 8.98 Update 3
Kernel Resource Management
Copyright © 2010, Oracle. All rights reserved 27
fc33558c call_user_handler (b, 0, 0, 0, f7fe0c00, f555ca38) + 3b8
f66304ac kpuhhalp (f74bb544, 1774, 16c00, f73eb320, 8048, 16800) + 8ec
f708b174 ttcrbur (182c28, d6784, f662fbc0, 24, f753ac5c, d6898) + 1104
f708b6f8 ttcbur (182c28, d6784, d8b60, 24, 185, 1026) + fc
f6664740 kpuexCallback (182c28, d86e8, f753d1b8, d6784, 1, d8be8) + 1030
f69b36e8 ttcdrv (d86e8, 1894e8, d6784, 182c28, 0, ecb88) + 1da4
f6770b6c nioqwa (0, 189490, f69b1944, d86e8, d67ac, 0) + 40
f65e6f18 upirtrc (d6784, 5e, 0, 182c28, 1, 0) + 544
f66b6380 kpurcsc (188118, 0, 0, d86e8, d93bc, 0) + 6c
f6665c80 kpuexecv8 (188118, 5ad2f8, 5ad344, 17790, 0, f74bb544) + 1390
f66682c0 kpuexec (0, 5ad2f8, f85200, 0, 0, 1000) + 1544
f65c5e50 OCIStmtExecute (188118, 5ad2f8, 0, 0, 0, 0) + 2c
f657e348 BFOCIStmtExecute (188118, 5ad2f8, f85200, 0, 0, 0) + 28
f656eacc performRequestInternal (1257408, 0, 1257410, 11ce838, ff0ed1c0, 0) + 4f8
f656e46c dballPerformRequest (1257408, 12583f8, 0, 12583f8, 12583fb, 1000) + 3e4
feb937a4 JDB_DBPerformRequest (116ec18, 1257408, 11ce838, 181240, 181318, 181240) + e4
fe13a894 TM_DBPerformRequest (9e2d28, 1, 11ce838, f40f18, 4a7e48, 5) + 41c
feba75b4 SelectKeyed (f40f18, 9e2d28, f5564be4, 0, 1, 1) + 1ec8
feba3ed4 JDB_SelectKeyed (f40f18, 7, 0, a000, a118, feddd4dc) + 20c
fe1c969c RTK_CER_FIOSelect (f40f18, 7, 7, f5567620, af7a9c, 8) + ac
f0d5cab4 DetermineIfBlanketPOExists (928a28, c47588, f5571780, 0, f5571814, 24000) + 1934
fefb88f8 jdeCallObjectV2 (f1ff2c98, 928a28, 13fee98, 2, ff0c36fc, 20) + a3d0
fefae518 jdeCallObject (f1ff2c98, 0, 928a28, 0, 0, 0) + 38
f0f420c4 IXTF4311Z1_EditLineMultipleBlanketRelease (928a28, c47588, e5fc28, f5576f38, e5feb6,
f55756f0) + 7c0
f0f39be4 IXT4311Z1_F4311EditLineInternalFunctions (928a28, c47588, e5fc28, 53, 0, f55756f0) + 1fcc
fefb88f8 jdeCallObjectV2 (b81788, 928a28, 1106270, 1, ff0c36fc, 20) + a3d0
fefae518 jdeCallObject (b81788, 0, 928a28, 0, fe963658, f557eea4) + 38
fe79f4dc JDEK_ProcessCallRequest (f557ef58, dda5b8, 5a7e68, 9e2ae8, 928a28, 20) + 3d30
fe79a5e8 JDEK_StartCallRequest (f557fc40, dda5b8, 0, 9e2ae8, 5a7e68, 0) + f74
fe77db24 runBusinessFunction (c59d88, 0, 0, 7174, ff338dff, fe93c6ec) + 328
fe77dea8 runCallObjectJob (c59d88, 0, c59d98, c59d98, c59d98, 20) + 5c
fe354394 psthread_pool_worker_function (0, 0, 74, d5cc8, fe10d7b8, fe367de8) + 628
fe0f48fc threadFunctionWrapper (c3478, 204, 0, c4, c347b, fe353d6c) + f4
fc340368 _lwp_start (0, 0, 0, 0, 0, 0)
----------------- lwp# 6 / thread# 6 --------------------
fc340408 lwp_park (0, 0, 0)
f6667034 kpuexec (f8e9d800, f1492c, 5ad6ac, 0, 0, 18814c) + 2b8
f65c5e50 OCIStmtExecute (188118, f1492c, 0, 0, 0, 0) + 2c
f657e348 BFOCIStmtExecute (188118, f1492c, 5ad6ac, 0, 0, 0) + 28
f656eacc performRequestInternal (d05080, 0, d05088, d03440, ff0ed1c0, 0) + 4f8
f656e46c dballPerformRequest (d05080, d06070, 0, d06070, d06073, 1000) + 3e4
feb937a4 JDB_DBPerformRequest (93bc50, d05080, d03440, 181240, 181318, 181240) + e4
fe13a894 TM_DBPerformRequest (9e2a20, 1, d03440, 116e990, 1b3ab8, 5) + 41c
feba75b4 SelectKeyed (116e990, 9e2a20, f385eecc, 1, 1, 1) + 1ec8
febb3c00 FetchKeyed (0, 1, 1562d8, d03440, feddd4dc, 0) + 286c
febb114c JDB_FetchKeyed (116e990, 1, 1562d8, ff338dfc, f386128c, 0) + 214
ee688ab4 EditSystemExistenceF99410 (1562d8, 689800, f3867910, 3, ff976770, 618700) + 30c
fefb88f8 jdeCallObjectV2 (f1f3d5ec, 13741c8, a6fb20, 3, ff0c36fc, 20) + a3d0
fefae518 jdeCallObject (f1f3d5ec, 0, 13741c8, 0, 0, 0) + 38
f0b6b804 I4500250_GetGrowerSystemConstant (13741c8, b86dd8, f3867a80, f3867912, ff990790, 0) + e8
f0b65e50 CalculatePurchasePrice (13741c8, b86dd8, f3870b3c, f3867a84, ff98bfa8, f3870bda) + 220
fefb88f8 jdeCallObjectV2 (f1ff38fc, 13741c8, 117a878, 2, ff0c36fc, 20) + a3d0
fefae518 jdeCallObject (f1ff38fc, 0, 13741c8, 0, 0, 0) + 38
f0f500cc IXTF4311Z1_CalcPurchasePrice (b86dd8, f38765ce, 1265f00, 1265c40, f3876ce8, f38756f0) + 15d8
f0f39fd0 IXT4311Z1_F4311EditLineInternalFunctions (13741c8, b86dd8, 1265c40, f3876f38, 0, f38756f0) + 23b8
fefb88f8 jdeCallObjectV2 (6f7908, 13741c8, eb79e8, 1, ff0c36fc, 20) + a3d0
fefae518 jdeCallObject (6f7908, 0, 13741c8, 0, fe963658, f387eea4) + 38
fe79f4dc JDEK_ProcessCallRequest (f387ef58, 13e3c78, bdb60, 9e2768, 13741c8, 20) + 3d30
fe79a5e8 JDEK_StartCallRequest (f387fc40, 13e3c78, 0, 9e2768, bdb60, 0) + f74
fe77db24 runBusinessFunction (14c288, 0, 0, 7174, ff338dff, fe93c6ec) + 328
fe77dea8 runCallObjectJob (14c288, 0, 14c298, 14c298, 14c298, 20) + 5c
fe354394 psthread_pool_worker_function (0, 0, 74, d5cc8, fe10d7b8, fe367de8) + 628
fe0f48fc threadFunctionWrapper (36cdb8, 204, 0, c4, 36cdbb, fe353d6c) + f4
fc340368 _lwp_start (0, 0, 0, 0, 0, 0)
Analysis of Call Object Crash - CallStacks (for above .dmp file)
-
We start by looking at the thread which contains jdeLogCallStack() function as this is the thread which encountered the error first.
-
From that point in the callstack please traverse down to the business function which is being invoked by looking top to bottom until you find jdeCallobjectV2() In this example, it is DetermineIfBlanketPOExists.
-
Check for any MEM SAR fix for this Bsfn and note the ESU.
-
As mentioned earlier - this may not be the root cause of the crash - it could be a victim of some other thread/ bsfn corrupting the memory before it.
-
Search for other active business functions in other threads for this callobject. Use the same methodology:
-
Evaluate from top to bottom.
-
Keep going until you hit the jdeCallObjectV2() Function.
-
The BusinessFunction right above jdeCallObjectV2() is the one closest the point in time when the crash occurred.
-
-
In our example these are:
-
No running BSFN in Thread1. Main thread is waiting for work.
-
EditSystemExistenceF99410 in Thread2.
-
No running BSFN in Thread3. Thread is waiting for work.
-
EditSystemExistenceF99410 in Thread4.
-
DetermineifBlanketPOExists in Thread 5 (This is the thread which initiated the crash).
-
EditSystemExistenceF99410 in Thread6.
-
So from this example, we see that the thread running DetermineifBlanketPOExists initiated a process crash, but there were three instances of EditSystemExistenceF99410 running in three other threads. Therefore, one should look for bugs containing fixes for these two business functions and apply those ESUs.
It's also possible that the corruption in this crashed CallObject was caused by some other business function which was no longer running at the point of crash. Therefore, it is helpful to analyze a few CallObject crash .dmp files so that an overall pattern of suspect business functions appear and we can then use these to select a narrow range of ESUs to apply. This method of analysis is quite focused and presents one with a given set of fixes to apply rather than choose wide swathes of possible ESUs.
Call Object or RunBatch Crash due to Out of Memory
CallObjects or Runbatch processes may also crash when they are unable to allocate memory. This can happen for two reasons:
-
If this process hits the 'per-process' memory limit for the given OS. This may happen due to the process leaking memory or consuming excessive memory.
-
General lack of memory in the machine environment where it is running. This is usually due to an undersized box or a side effect of leaking processes on other sibling processes.
Similar to memory corruption, out of memory also produces a .dmp.log file. But in this case, it produces a Memory Dump which contains the list of all EnterpriseOne objects in the process memory at the time of crash. If the crash is due to raw allocation of memory or a third party leak, then this memory diagnostic dump will not show any large quantities of EnterpriseOne objects.
This is a dmp.log for a crash due to Out of Memory:
Apr 5 17:31:27.459991 DEBUG INIT0 - 6329 **** jdeDebugInit -- output disabled in INI file.
Apr 5 17:31:27.461443 jdemem.c131 - 6329 BMD OFF - Not running BSFN MEMORY
DIAGNOSTICS v8.98.2.0 level 0
Apr 5 17:59:03.229258 jdb_utl1.c13485 - 6329/2 MEMORY ALLOCATION FAILURE
Apr 5 17:59:03.229365 jdb_utl1.c13485 - 6329/2 File: jdb_rq1.c Line: 192
********** Begin OS Data **********
Memory Usage = 4281MB
CPU Usage = 0%
Number of Threads = 7
********** End OS Data **********
********** Begin Detailed Memory Data **********
********** Begin Process Data **********
ENVIRONMENT,Ptr=00652d78,Env=JPD812,PathCode=PD812
JDBTABLECACHE,Ptr=007ccec8,Name=JDB_BV_1270510706JPD812F4009,#Records=1
JDBTABLECACHE,Ptr=003e6f38,Name=JDB_BV_1270510706JPD812F40203,#Records=2
JDBTABLECACHE,Ptr=003ed418,Name=JDB_BV_1270510706JPD812F40205,#Records=1
JDBTABLECACHE,Ptr=004fb430,Name=JDB_BV_1270510706JPD812F41001,#Records=2
JDBTABLECACHE,Ptr=00501078,Name=JDB_BV_1270510706JPD812F41002,#Records=3294
JDBTABLECACHE,Ptr=0051ead0,Name=JDB_BV_1270510706JPD812F7306,#Records=1
JDBTABLECACHE,Ptr=00319358,Name=JDB_BV_1270510706JPD812F99410,#Records=2
JDBTABLECACHE,Ptr=00338690,Name=JDB_BV_1270510706JPD812F0004,#Records=25
JDBTABLECACHE,Ptr=00342d40,Name=JDB_BV_1270510706JPD812F0005,#Records=27
JDBTABLECACHE,Ptr=00346cf8,Name=JDB_BV_1270510706JPD812F0006,#Records=1
JDBTABLECACHE,Ptr=00378de1,Name=JDB_BV_1270510706JPD812F0901,#Records=948722
JDBTABLECACHE,Ptr=00349ca0,Name=JDB_BV_1270510706JPD812F0008,#Records=1
JDBTABLECACHE,Ptr=0034e6a8,Name=JDB_BV_1270510706JPD812F0010,#Records=2
JDBTABLECACHE,Ptr=006454d8,Name=JDB_BV_1270510707JPD812F1609,#Records=1
OCIDBCONN,Ptr=0012e530,DBServer=densun28,DBUser=JDE,TNSDB=orcl,ConnState=AutoInUse,Comm
itMode=A,RefCount=196
OCIDBCONN,Ptr=0082ee18,DBServer=densun28,DBUser=JDE,TNSDB=orcl,ConnState=ManualInUse,Co
mmitMode=M,RefCount=1
OCIDBCONN,Ptr=006aca68,DBServer=densun28,DBUser=JDE,TNSDB=orcl,ConnState=ManualInUse,Co
mmitMode=M,RefCount=1
OCIDBCONN,Ptr=00a46d08,DBServer=densun28,DBUser=JDE,TNSDB=orcl,ConnState=ManualInUse,Co
mmitMode=M,RefCount=1
OCIDBCONN,Ptr=00880b98,DBServer=densun28,DBUser=JDE,TNSDB=orcl,ConnState=ManualInUse,Co
mmitMode=M,RefCount=1
OCIDBCONN,Ptr=015f64c0,DBServer=densun28,DBUser=JDE,TNSDB=orcl,ConnState=ManualAvailable,C
ommitMode=M,RefCount=0
OCIDBCONN,Ptr=01b150c8,DBServer=densun28,DBUser=JDE,TNSDB=orcl,ConnState=ManualAvailable,
CommitMode=M,RefCount=0
********** End Process Data **********
********** Begin Session Data **********
SESSION,Ptr=000bdb60,User=JDE,Env=JPD812,Role=*ALL,Machine=denicsn5,SignOnTime= 4/ 5/2010 17:38:27,LastActiveTime= 4/ 5/2010 17:58:55
OPENJDBTRANSACTION,Ptr=0014eb28,CommitMode=Auto,Owner=InitUser,AppName=(UNKNOWN),File=jdb_ctl.c,Function=JDB_LoadEnv,Line=5829
TABLE,Ptr=00a2bac0,Name=F0013,CommitStatus=Active,File=jdb_curr.c,Function=JDB_RetrieveF0013RowUsingCurrencyCode,Line=73
TABLE,Ptr=013f0830,Name=F0010,CommitStatus=Active,File=jdb_curr.c,Function=JDB_RetrieveF0010RowUsingCompanyNumber,Line=246
OPENJDBTRANSACTION,Ptr=007f4538,CommitMode=Auto,Owner=InitUser,AppName=(UNKNOWN),File=jdb_ctl.c,Function=CallStartupBusinessFunction,Line=8551
OPENJDBTRANSACTION,Ptr=004299c0,CommitMode=Auto,Owner=InitUser,AppName=(UNKNOWN),File=jdekinit.c,Function=JDEK_ProcessInitUserRequest,Line=356
OPENJDBTRANSACTION,Ptr=00783a08,CommitMode=Auto,Owner=InitUser,AppName=(UNKNOWN),File=jdekinit.c,Function=JDEK_ProcessInitUserRequest,Line=356
JDECACHE,Ptr=000fabe8,Name=2XT4311Z1A,#Cursors=1,#Records=0,#Indices=1,#References=1,File=xt4311z1.c,Function=F4311InitializeCaching,Line=23018
JDECACHE,Ptr=005ce150,Name=2XT4311Z1B,#Cursors=1,#Records=0,#Indices=2,#References=1,File=xt4311z1.c,Function=F4311InitializeCaching,Line=23027
JDECACHE,Ptr=00ef3390,Name=2XT4311Z1C,#Cursors=1,#Records=1,#Indices=1,#References=5,File=xt4311z1.c,Function=IXT4311Z1_InitiateOrderCache,Line=5758
JDECACHE,Ptr=014397a8,Name=2B4302570Cache,#Cursors=1,#Records=0,#Indices=1,#References=2,File=b4302570.c,Function=ApprovalsFieldConstants,Line=158
JDECACHE,Ptr=014f8000,Name=2F45UI73,#Cursors=1,#Records=0,#Indices=2,#References=4,File=b4500200.c,Function=F4573GetNextFreeGood,Line=100
JDECACHE,Ptr=00beae30,Name=2B3201470213107,#Cursors=1,#Records=0,#Indices=7,#References=3,File=b3201470.c,Function=I3201470_CreateInitCache,Line=732
JDECACHE,Ptr=00b65350,Name=2B3201470213144,#Cursors=1,#Records=0,#Indices=7,#References=3,File=b3201470.c,Function=I3201470_CreateInitCache,Line=732
JDECACHE,Ptr=004d1438,Name=2B4302180F632910,#Cursors=1,#Records=1,#Indices=1,#References=19,File=b4302180.c,Function=CacheProcessPOHeaderCache,Line=1173
JDECACHE,Ptr=01876570,Name=2213190PricingDecimals,#Cursors=2,#Records=2,#Indices=1,#References=1,File=b4504500.c,Function=CreateDataMapCDIST,Line=229
JDECACHE,Ptr=006d05d0,Name=2213190DataMapCDISTCache,#Cursors=1,#Records=3,#Indices=1,#References=1,File=b4504500.c,Function=InitDataMapCacheCDIST,Line=2108
JDECACHE,Ptr=01765910,Name=2213190PricingHistory,#Cursors=2,#Records=1,#Indices=1,#References=1,File=b4504500.c,Function=CreateDataMapCDIST,Line=229
JDECACHE,Ptr=017ed260,Name=2213190PricingCatCodes,#Cursors=2,#Records=1,#Indices=1,#References=1,File=b4504500.c,Function=CreateDataMapCDIST,Line=229
JDECACHE,Ptr=0104aaf0,Name=2B4302180G632910,#Cursors=1,#Records=6,#Indices=2,#References=12,File=b4302180.c,Function=CacheProcessPODetailCache,Line=1510
JDECACHE,Ptr=015b0138,Name=2B4302180H632910,#Cursors=1,#Records=0,#Indices=3,#References=6,File=b4302180.c,Function=CacheProcessBlanketCache,Line=1848
JDECACHE,Ptr=013c0960,Name=2F40UI74_213190,#Cursors=1,#Records=6,#Indices=3,#References=1,File=b4504610.c,Function=F40UI74_Init,Line=719
JDECACHE,Ptr=013b0f80,Name=2F40UI70-213190,#Cursors=1,#Records=0,#Indices=5,#References=18,File=b4500720.c,Function=ProcessPriceAdjustmentListCache,Line=335
SESSION,Ptr=00811f78,User=JDE,Env=JPD812,Role=*ALL,Machine=denicsn5,SignOnTime= 4/ 5/2010 17:38:44,LastActiveTime= 4/ 5/2010 17:58:56
OPENJDBTRANSACTION,Ptr=0084a660,CommitMode=Auto,Owner=InitUser,AppName=UNKNOWN),File=jdb_ctl.c,Function=JDB_LoadEnv,Line=5829
TABLE,Ptr=00d4a3b8,Name=F0013,CommitStatus=Active,File=jdb_curr.c,Function=JDB_RetrieveF0013RowUsingCurrencyCode,Line=73
TABLE,Ptr=0142e000,Name=F0010,CommitStatus=Active,File=jdb_curr.c,Function=JDB_RetrieveF0010RowUsingCompanyNumber,Line=246
OPENJDBTRANSACTION,Ptr=0084a968,CommitMode=Auto,Owner=InitUser,AppName=(UNKNOWN),File=jdb_ctl.c,Function=CallStartupBusinessFunction,Line=8551
OPENJDBTRANSACTION,Ptr=00822b00,CommitMode=Auto,Owner=InitUser,AppName=(UNKNOWN),File=jdekinit.c,Function=JDEK_ProcessInitUserRequest,Line=356
OPENJDBTRANSACTION,Ptr=00878840,CommitMode=Auto,Owner=InitUser,AppName=(UNKNOWN),File=jdekinit.c,Function=JDEK_ProcessInitUserRequest,Line=356
JDECACHE,Ptr=0085a448,Name=5XT4311Z1A,#Cursors=1,#Records=0,#Indices=1,#References=1,File=xt4311z1.c,Function=F4311InitializeCaching,Line=23018
JDECACHE,Ptr=00a3a360,Name=5XT4311Z1B,#Cursors=1,#Records=0,#Indices=2,#References=1,File=xt4311z1.c,Function=F4311InitializeCaching,Line=23027
JDECACHE,Ptr=0104ea50,Name=5XT4311Z1C,#Cursors=1,#Records=1,#Indices=1,#References=5,File=xt4311z1.c,Function=IXT4311Z1_InitiateOrderCache,Line=5758
JDECACHE,Ptr=00e868a8,Name=5B4302570Cache,#Cursors=1,#Records=0,#Indices=1,#References=2,File=b4302570.c,Function=ApprovalsFieldConstants,Line=158
********** End Session Data **********
********** End Detailed Memory Data **********
Analysis of Memory Dumps (for preceding .dmp file)
-
Look for the memory usage at the point of the crash. If this number is much lower than the "per-process" memory limit as previously determined in SM Console, then it means that the system as a whole is running low on memory and this process is a victim of low memory available to it.
-
If the process crashed at memory utilization close to the "per-process" memory limit, then we need to evaluate the likely suspects which might be excessively consuming the memory in the process.
-
Look at the global Process level objects such as JDBTABLECACHE or Database connections for any extreme numbers.
-
After that, analyze the perSession objects such as JDBTRANSACTIONS(manual) or JDECACHEs or DATAPOINTERs or JDBRequests(TABLE/VIEW) in each session.
-
In our example above, the culprit is the JDB Caching of F0901 Table which has lead to caching of close to a million (948,722) data rows in memory, leading to a "memory exhaustion" condition. This is easily solved by either Dynamically Clearing Cache from Server Manager or removing this table from JDB Cache from P98613 Application.
A Callobject can crash if it consumes an excessive number of threads. Usually this limit is twice the number of threadpoolsize as set in jde.ini. This will also produce a .dmp.log file which will contain a list of all threads and their callstacks - this will help in determining where the source of the threads. On System-i enterprise server, there will not be any dmp file. Instead the callstacks for all threads will be logged in jde.log.
To determine which DB queries are taking an excessive amount of time to execute, the following setting is available in Server Manager:
Figure 12-15 Query Execution Time Threshold
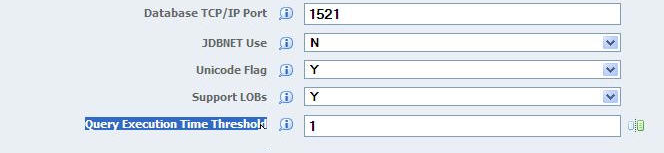
Description of "Figure 12-15 Query Execution Time Threshold"
Setting this value greater than 0 will start a timer for each DB query. If the amount of time taken to execute the DB query equals or exceeds this value, two messages will be written to the jde log for the E1 process. The first line will contain the text indicating that the DB query threshold has been exceeded. This line will also contain the E1 user and DB proxy user that executed the query. The second line will contain the actual DB query that exceeded the threshold.
This is a sample of these messages:
859026/452 MAIN_THREAD Tue Apr 20 16:41:26.044816
dbdrv_log.c196
OS400AG016 - doQueryDiagnostics: The following SQL query took 5 seconds which is equal to or greater than QueryExecutionTimeThreshold (1 seconds) for E1User(JOESMITH) with DBProxyUser(JDE).
859026/452 MAIN_THREAD Tue Apr 20 16:41:26.044960
dbdrvag.c1394
SELECT * FROM SVM812/F986110 WHERE ( JCJOBSTS = 'P' AND JCFUNO = 'UBE' AND JCPRTQ = '6003' AND JCEXEHOST = 'JDESERVER1' ) ORDER BY JCEXEHOST ASC,JCJOBNBR ASC
Terminating HTML User Sessions
An administrator can terminate user sessions on EnterpriseOne HTML servers. This can be used in conjunction with the Recycle Kernel button, to stop a user session that appears to be out of control, while allowing other user sessions on the same CallObject kernel to complete normally.
User sessions can be found using Server Manager, by selecting the view Search for User Resources from the main Management Dashboard page.
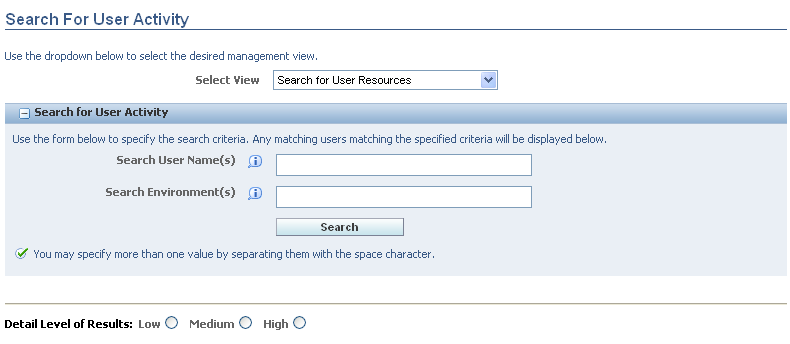
The search list can be narrowed by specifying user names and environments. Clicking on the link HTML Server Session will bring up a page where those users on that same HTML server instance can be selected for termination. An alternative way to get to the same page is to select the link to User Sessions in the Runtime Metrics block of the HTML server instance main page. On that page, user sessions can be selected by check box. The CNC admin can send a message to the user that their session will be terminated. Then the CNC admin can terminate the selected user sessions.
For a CallObject kernel that has already begun recycling, that kernel will shut down when all of its user sessions have either logged off or been terminated by an administrator.
12.7.2.7 Logging and Diagnostics
At the time of user signout, all EnterpriseOne related memory structures should be freed. If they are not, then the three new settings listed in the Error and Debug Logging section can help isolate the value and origin of these outstanding memory objects. These memory objects are gracefully removed when a user signs out. However, these represent a potential buildup of objects in processes that do not represent a problem in long running processes such as subsystem jobs, long running batch jobs, or if an interactive user does not sign out for a long time (such as interop jobs).
Error and Debug Logging section
Three new fields have been added to the Error and Debug Logging section:
| Field | Description |
|---|---|
| Log memory diagnostics at signoff | INI Filename - /u01/jdedwards/e812/ini/JDE.INI
INI Section Name - DEBUG INI Entry - logMemDiagsAtSignoff Default Value - FALSE Allowed Values:
This setting specifies whether or not memory diagnostics will be logged when a CallObject Kernel user session is ended or a UBE process ends. The memory diagnostics will be written to the jdedebug log. |
| Log JDE Cache leaks at signoff | INI Filename - /u01/jdedwards/e812/ini/JDE.INI
INI Section Name - DEBUG INI Entry - logCacheLeaksAtSignoff Default Value - FALSE Allowed Values:
This setting specifies whether or not JDE Cache leaks will be logged when a user session is freed in an E1 Server process. Details about the leaked JDE Caches will be written to the jde log. |
| Log Data Pointer leaks at signoff | INI Filename - /u01/jdedwards/e812/ini/JDE.INI
INI Section Name - DEBUG INI Entry - logDPLeaksAtSignoff Default Value - FALSE Allowed Values:
This setting specifies whether or not Data Pointer leaks will be logged when a user session is freed in an E1 Server process. Details about the leaked Data Pointers will be written to the jde log. |
12.7.2.8 Advanced Profiling
The advanced Profiling section discusses:
-
JDEHEAP Advanced Diagnostics Engine (JADE)
-
Business Function Memory Diagnostics (BMD)
JDEHEAP Advanced Diagnostics Engine (JADE)
This section discusses:
-
Description of JDEHEAP Advanced Diagnostics Engine (JADE)
-
JADE Standard Mode
-
JADE Advanced Mode
-
JDEHEAP ADVANCED DIAGNOSTICS ENGINE (JADE) Configuration
Description of JDEHEAP Advanced Diagnostics Engine (JADE)
JADE (JDEdwards Heap Advanced Diagnostic Engine) and BMD (Business Function Memory Diagnostic) are two advanced profiling tools which work cross-platform with the production level builds to diagnose memory leak issues.
These Profilers are to be used when the normal memory diagnostics do not yield adequate information.
BMD and JADE have a common problem domain of finding the source of memory consumption or leak within JDEdwards EnterpriseOne Kernel Space. However, they specialize in different use cases:
-
BMD Level 1 gives and overall idea of memory consumption.
-
BMD Level 2 and 3 provide growth of memory as a function of business functions.
Thus, BMD helps isolate which business functions are likely candidates for a memory consumption or leak.
On the other hand, JADE is a finer diagnostic tool and it works by collecting all memory allocations from the given Enterprise Server Kernel.
All memory that is left unallocated at the end of the run can be considered as a memory leak or excessive consumption - if start and stop points are chosen judiciously.
JDEHEAP ADVANCED DIAGNOSTICS ENGINE (JADE) provides a method to identify the location of JdeHeap memory leaks. Note: do not use these settings unless investigating a "Tools-level" problem, as system performance may be affected.
Configuration settings for JADE are accessed by selecting Logging and Diagnostics in the Configuration section.
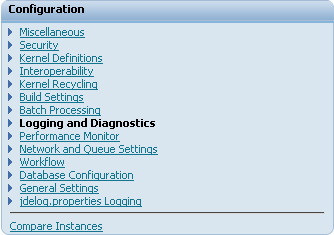
For memory investigations within the scope of BSFNs, use the buttons on the Server Manager process screen instead of these INI settings. JADE tracks memory usage of all jdeHeap functions (jdeAlloc, jdeCalloc, jdeRealloc, and jdeFree). The JADE JDE.INI settings take affect whenever a process starts. They will be ignored and deactivated whenever using a JADE button on the Server Manager process screen.
All JADE logging is placed in the jdedebug.log files, even if jdedebug logging is turned off in the JDE.INI.
If an Application is known to have a memory leak:
-
Launch the Application to the App Entry point.
-
Associate the Application to a given CallObject by correlating under "Remote Env" section of HTML WebSessions.
-
Drill into the Callobject Kernel and click on "Start JADE" Button.
-
Execute the pre-defined transactions on the application.
-
When done, click on "Dump JADE" Button.
-
Exit the Application and click on "Stop JADE" Button.
-
Click "Parse JADE" to see the possible leak locations.
In the previous use case we can determine if there is any unallocated memory at the end of Application's run. If yes, then it can be determined from where it is being allocated.
If a running process, such as RunBatch, has a runaway memory leak:
Figure 12-18 Top memory usage identified by graph and by sorting on Memory column.
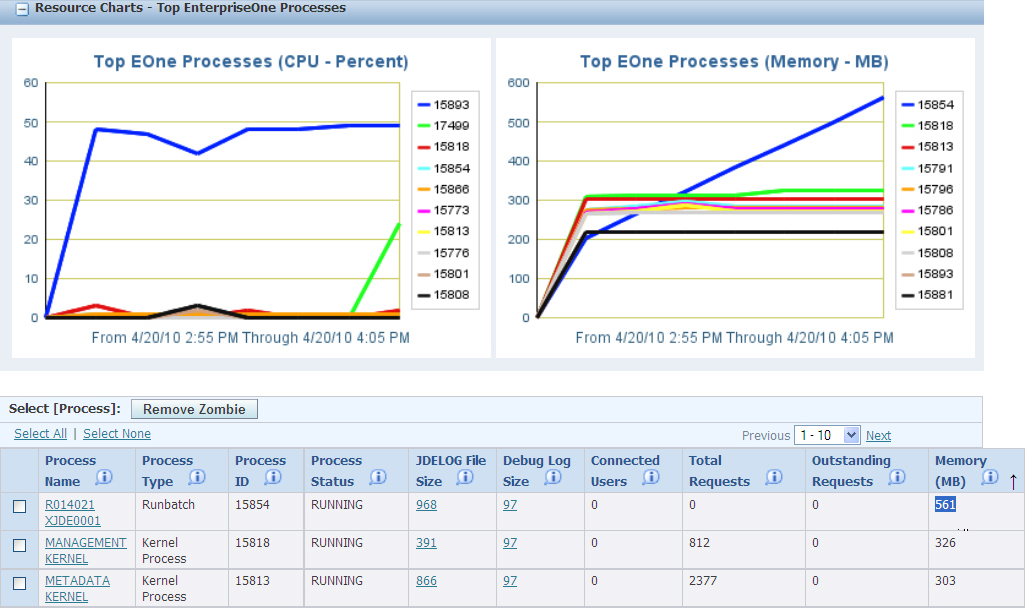
Description of "Figure 12-18 Top memory usage identified by graph and by sorting on Memory column."
-
Drill into the known process.
-
Enable JADE by pressing on "Start JADE".
-
Let the process run for representative period of leak.
-
Press "Stop JADE" Button.
-
Click "Parse JADE" to see the possible leak locations.
Figure 12-20 Click Download JADE Parse of Log File.
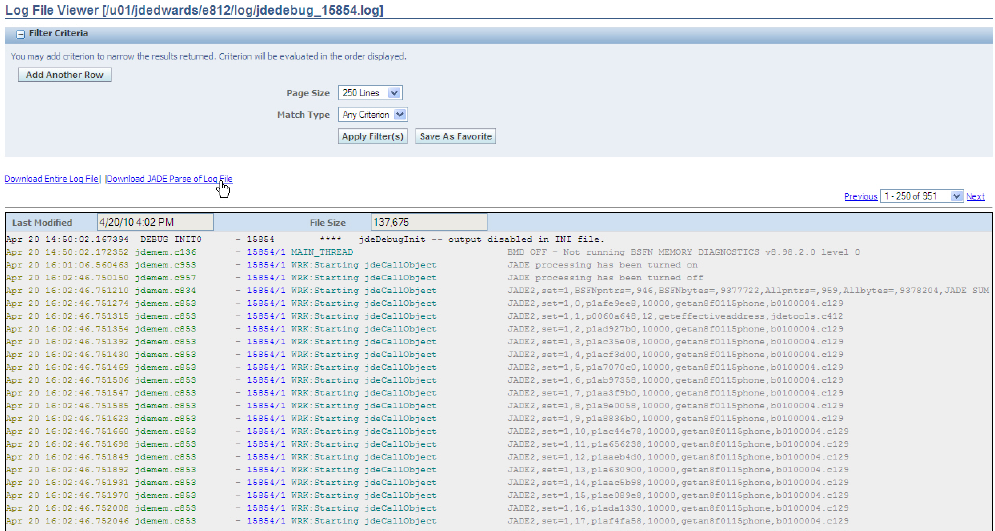
Description of "Figure 12-20 Click Download JADE Parse of Log File."
-
Download JADE Parse file.
-
Open the downloaded Parse file in favorite CSV reader and analyze memory allocation patterns which may suggest the location of the leaks.
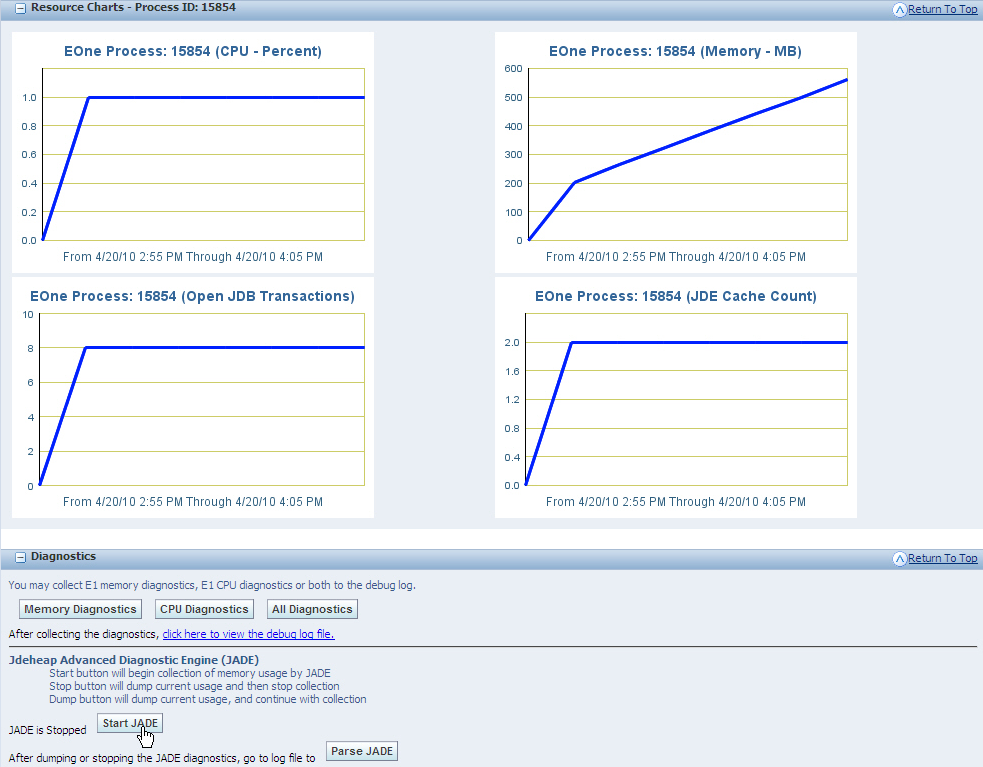
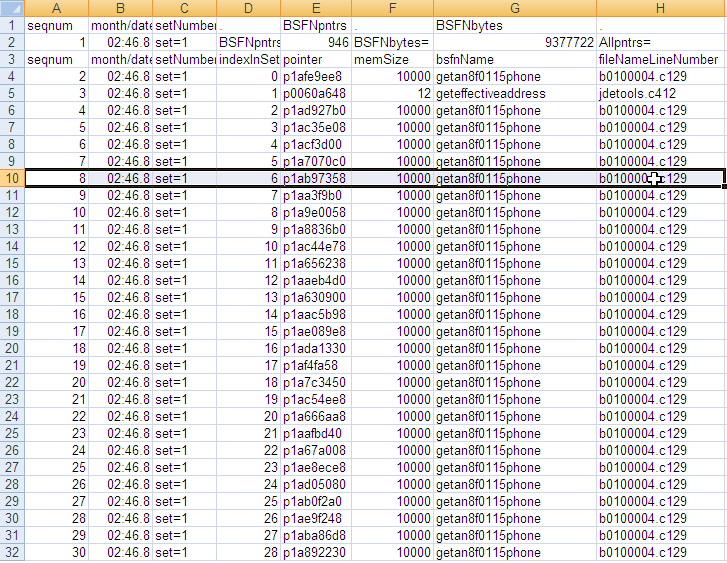
JADE Advanced Mode provides a deeper level of information for analysis of situations when Standard Mode is not able to resolve the issue. For example, if one is working to resolve an issue of high memory usage, but doesn't see any corresponding rise in memory of any known EnterpriseOne objects either in analyzing the graphs or using the Diagnostic buttons, then Advanced Mode is needed.
Three levels of JADE logging are available:
-
JADE level 1 logs a summary of memory usage.
-
JADE level 2 logs the summary, plus detail lines for each BSFN-scoped memory pointer.
-
JADE level 3 logs the summary, plus detail lines for all jdeHeap memory pointers.
There is an option to start JADE memory tracking based on specified BSFN triggers, and also an option to turn on Debug logging when the BSFN trigger is met. JADE data is dumped to the log file based on a minimum time interval. The INI-initiated JADE tracking is terminated whenever a JADE button on the Server Manager process screen is used.
JDEHEAP Advanced Diagnostics Engine (JADE) Configuration
JADE can be configured by accessing the JDEHEAP Advanced Diagnostics Engine (JADE) Configuration section.
To access this section:
-
In Server Manager, select the EnterpriseOne server.
-
Select Logging and Diagnostics in the Configuration Section.
Figure 12-22 JDEHEAP ADVANCED DIAGNOSTICS ENGINE (JADE) Configuration section
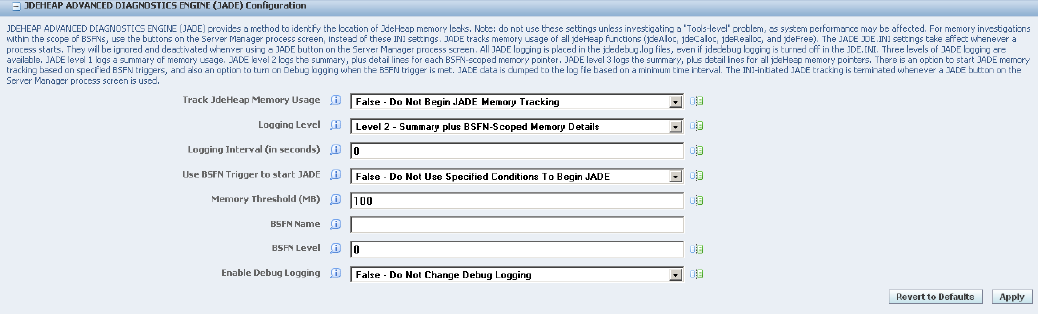
Description of "Figure 12-22 JDEHEAP ADVANCED DIAGNOSTICS ENGINE (JADE) Configuration section"
The fields used to configure JADE are:
| Field | Description |
|---|---|
| Track JdeHeap Memory Usage | INI Filename - /u01/jdedwards/e812/ini/JDE.INI
INI Section Name - JADE INI Entry - trackMemUsage Default Value - 0 Allowed Values: • False - Do Not Begin JADE Memory Tracking (0) • True - Begin JADE Memory Tracking At Process Start (1) Track jdeHeap memory usage by JADE. The tracking will start with the first jdeHeap usage of the process. It will terminate when the process shuts down and when any of the JADE buttons on the Server Manager process screen are used. |
| Logging Level | INI Filename - /u01/jdedwards/e812/ini/JDE.INI
INI Section Name - JADE INI Entry - logLevel Default Value - 2 Allowed Values: • Level 1 - Summary of JdeHeap Memory Usage (1) • Level 2 - Summary plus BSFN-Scoped Memory Details (2) • Level 3 - Summary plus All JdeHeap Memory Details (3) Level of logging the JADE diagnostics. Level 1 logs a summary of BSFN-scoped pointers and of all pointers. Level 2 logs the summary, plus detail lines for each BSFN-scoped jdeHeap usage. Level 3 logs the summary, plus detail lines for all jdeHeap usage. |
| Logging Level (in seconds) | INI Filename - /u01/jdedwards/e812/ini/JDE.INI
INI Section Name - JADE INI Entry - logInterval Default Value - 0 Logging interval (in seconds) between dumping of JADE data to the debug log file. This is a minimum interval, not an exact interval. No dumping will be done if there has been no jdeHeap activity since the last dumped data. This interval-based dumping will be terminated if any of the JADE buttons on the Server Manager process screen are used. |
| Use BSFN Trigger to start JADE | INI Filename - /u01/jdedwards/e812/ini/JDE.INI
INI Section Name - JADE INI Entry - bsfnTriggerUseTrigger Default Value - 0 Allowed Values; • False - Do Not Use Specified Conditions To Begin JADE (0) • True - Use Specified Conditions To Begin JADE (1) Use BSFN Trigger to begin JADE memory tracking. The BSFN-related trigger conditions are given in this section of the INI file. When the trigger conditions are met, JADE memory tracking begins. The trigger does not cause any JADE data to be dumped to the log files. |
| Memory Threshold (MB) | INI Filename - /u01/jdedwards/e812/ini/JDE.INI
INI Section Name - JADE INI Entry - bsfnTriggerMemThresholdMB Default Value - 100 Memory threshold (in megabytes) to begin JADE tracking of jdeHeap memory usage. This can be combined with a specified BSFN name and level to trigger when tracking starts. |
| BSFN Name | INI Filename - /u01/jdedwards/e812/ini/JDE.INI
INI Section Name - JADE INI Entry - bsfnTriggerBsfnName Business Function name. When combined with the BSFN level and memory threshold, triggers the JADE tracking. |
| BSFN Level | INI Filename - /u01/jdedwards/e812/ini/JDE.INI
INI Section Name - JADE INI Entry - bsfnTriggerBsfnLevel Default Value - 0 Business Function level. When combined with the BSFN name and memory threshold, triggers JADE tracking. Not used when set to zero. |
| Enable Debug Logging | INI Filename - /u01/jdedwards/e812/ini/JDE.INI
INI Section Name - JADE INI Entry - bsfnTriggerEnableDebug Default Value - 0 Allowed Values: • False - Do Not Change Debug Logging (0) • True - Turn On Debug Logging When JADE Is Triggered (1) Option to turn on debug logging. If selected, debug logging will be dynamically turned on when trigger conditions for JADE are met. This does not change the debug logging settings of JDE.INI. |
Business Function Memory Diagnostics (BMD)
This section discusses:
-
Business Function Memory Diagnostics (BMD)
-
Logged Values in BMD
-
Configuration of BMD
-
BMD Parsing
Description of Business Function Memory Diagnostics (BMD)
The KRM system enables you to engage BMD Profiling and includes BMD (BSFN Memory Diagnostics) in an easy-to-use format. BMD is a memory profiler which can track and isolate memory leaks to a particular business function and provides output of memory in .csv format. The BMD is considered a last resort to identify the cause of memory problems.
There are three levels of BMD:
-
The first level provides memory usage through the lifetime of all processes, to help narrow down where the problem is occurring.
-
The second level provides information about Business Functions (BSFNs) (for BSFN levels 1 and 2) after the kernel memory exceeds a given threshold.
-
The third level provides information about BSFNs (all BSFN levels) after the kernel memory exceeds a given threshold within a specified BSFN running at a specified level.
The first level is sampled memory logging that can be used for all types of kernel processes. The second and third levels are BSFN-specific memory logging. The types of kernel processes that run BSFNs are CallObject kernels, UBEs, and Subsystems.
The BMD data is written to the debug log file, even if debug logging is not turned on. The trigger for the third BMD level can also be used to activate full debug logging, to provide a detailed context around the memory problems.
Waiting to turn on debug logging until after the trigger conditions are met can eliminate huge debug-log files, which might take a lot of analysis to identify the portion of the log file that is related to the actual problem.
BMD Level 1 - collected at the allocation frequency specified in the BMD configuration - Allocation Frequency:
-
Current CPU percent
-
Current total process memory being used
BMD Level 2 - collected at the exit point of each Business Function after the specified Memory Threshold is hit for Business Functions at Level 1 and 2 only:
-
Current CPU percent
-
Current total process memory being used
-
Change in the memory during the BSFN (delta-memory)
-
BSFN name
-
BSFN level
BMD Level 3 - collected at the exit point of each Business Function after the specified Threshold of Memory AND Business Function Name AND Business Function Level (any level) is hit:
-
Current CPU percent
-
Current total process memory being used
-
Change in the memory during the BSFN (delta-memory)
-
BSFN name
-
BSFN level
-
Debug Logging (Optional)
These are the navigation steps to access the configuration of BMD:
-
Select the enterprise server instance in server manager.
-
You should see the <EnterpriseOne Enterprise Server> instance.
-
Make sure that the server is up and running.
-
Go to the <Configuration> section.
-
Click on the <Logging and Diagnostics> link.
-
Find the BSFN Memory Diagnostics (BMD) Configuration section.
The BMD JDE.INI settings specify the BMD level, and then the trigger conditions within each level. The settings are found in the JDE.INI in a block called "[BSFN MEMORY DIAGNOSTICS]". They are found in Server Manager in the configuration link called "Logging and Diagnostics".
The primary BMD setting is the BMD level, called "bmdLevel". That can be 0 (BMD off), or 1, 2, or 3 (BMD level).
For BMD level 1, the trigger condition is based on the allocation frequency (called "allocFrequency"). That is a count of all calls to the system-level allocation functions (malloc, calloc, and realloc). The default setting is 15000, with a minimum of 7000. At 15000, for active CallObject kernels, this can result in memory-level logging several times per minute.
Figure 12-23 BSFN Memory Diagnostics (BMD) Configuration section – Level 1
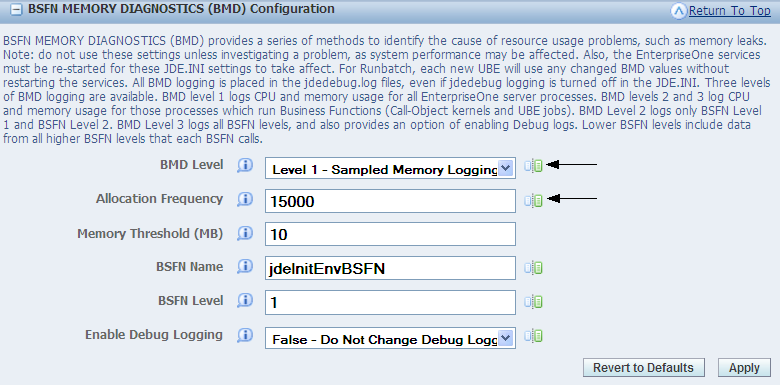
Description of "Figure 12-23 BSFN Memory Diagnostics (BMD) Configuration section – Level 1"
For BMD level 2, the trigger condition is passing a specified memory threshold (called "memThresholdMB"). After that memory threshold is first passed, there will be BMD logging each time a BSFN level 1 or 2 exits.
Figure 12-24 BSFN Memory Diagnostics (BMD) Configuration section – Level 2
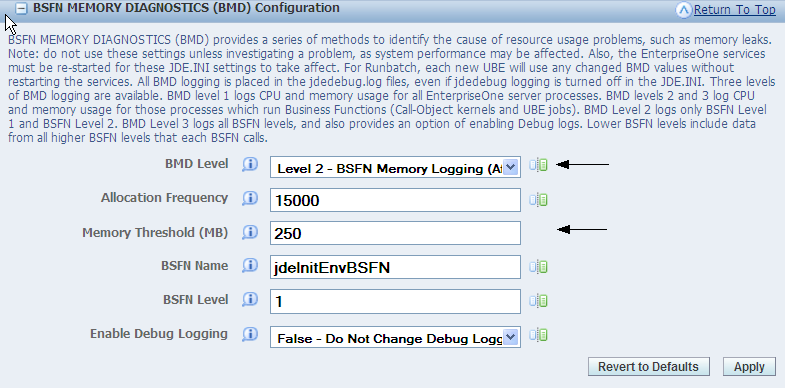
Description of "Figure 12-24 BSFN Memory Diagnostics (BMD) Configuration section – Level 2"
For BMD level 3, the trigger is based on a combination three conditions: a specified memory threshold (called "memThresholdMB", same as BMD level 2), a specified BSFN name (called "bsfnName"), and a specified BSFN level (called "bsfnLevel"). After those three conditions are met, there will be BMD logging each time a BSFN (all BSFN levels) exits. BMD level 3 has the option of turning on full debug logging starting when the trigger conditions are met. The optional setting is called "enableDebug", with possible values of 0 (debug logging unchanged) or 1 (debug logging turned on if it had been off).
Figure 12-25 BMD Configuration section – Level 3, Enable Debug Logging = False (debug off)
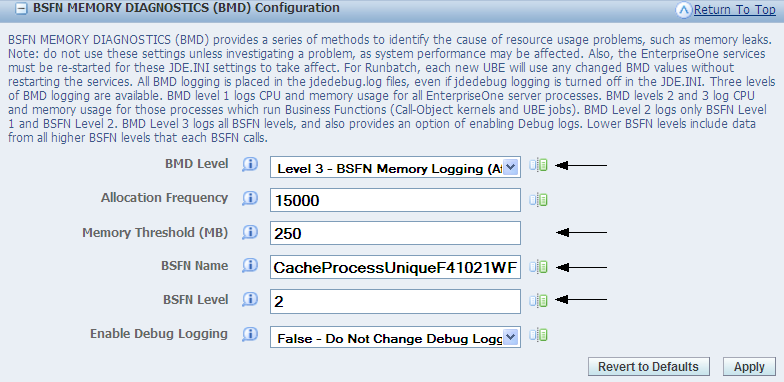
Description of "Figure 12-25 BMD Configuration section – Level 3, Enable Debug Logging = False (debug off)"
Figure 12-26 BMD Configuration section – Level 3, Enable Debug Logging = True (debug on)
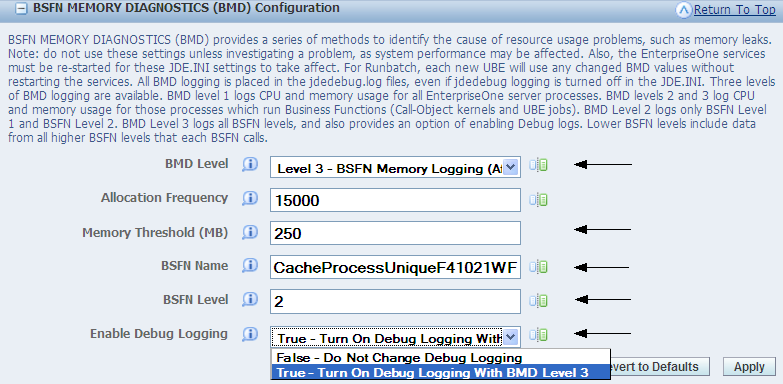
Description of "Figure 12-26 BMD Configuration section – Level 3, Enable Debug Logging = True (debug on)"
The EnterpriseOne services must be re-started for any changed BMD settings to take affect. For Runbatch, each new UBE will use any BMD values that are changed before that UBE starts.
12.7.2.9 BMD Parsing
These are the navigation steps to access BMD Parsing:
-
Select the enterprise server instance in server manager.
-
You should see the <EnterpriseOne Enterprise Server> instance.
-
Make sure that the server is up and running.
-
Go to the <Available Log Files> section.
-
Select a BMD parsing option link.
The BMD feature also includes an easy parsing system that is set up through links on the Server Manager log file screen.
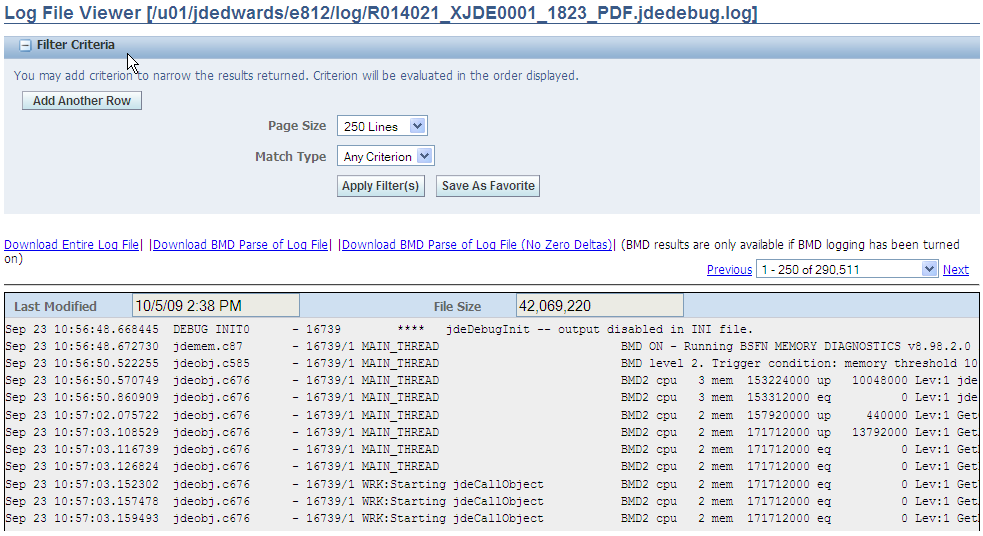
For level 1 BMD data, there is one parsing option that puts all of the data in the CSV format. For levels 2 and 3, there are two parsing options. One brings all BMD data for the BSFNs into the CSV format. The other excludes those BMD data rows which have a zero delta. The second option presumably keeps the most interesting BMD data, while reducing the CSV file size substantially.
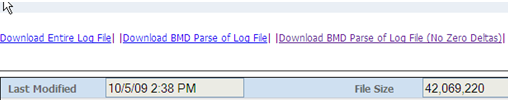
For CallObject kernels, the corresponding jdedebug_pid.log file contains the BMD information.
If a UBE is still running, the corresponding jdedebug_pid.log file contains the BMD information. If the UBE has completed, the log file is moved to the /printqueue folder. Copy the UBE-BMD log manually from the /printqueue folder to the /log folder so that the log file can be processed by BMD parsing within Server Manager.
The BMD data is parsed and retrieved in a CSV format. That parsed data can be saved to a file on the local machine, or it can be entered directly into a spreadsheet tool, such as Microsoft® Excel or OpenOffice Calc. Within Microsoft® Excel, the BMD data is easily searched and graphed.
Figure 12-29 BMD data parsed and retrieved in a CSV format
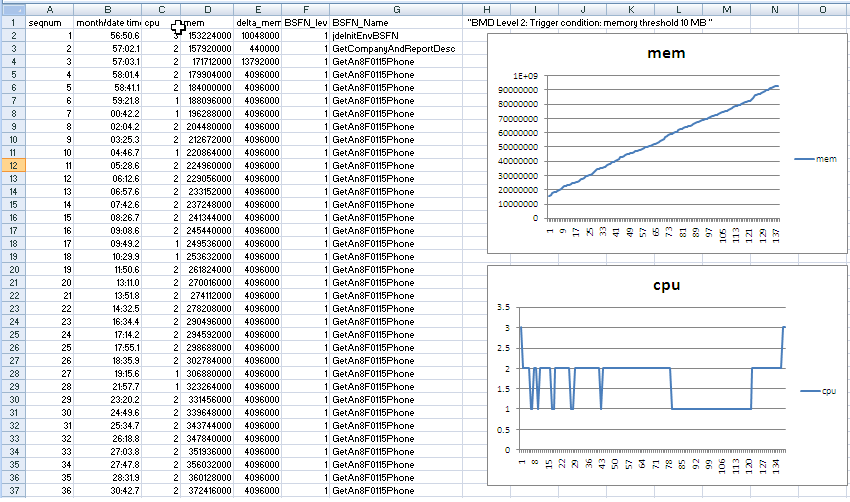
Description of "Figure 12-29 BMD data parsed and retrieved in a CSV format"
12.8 Troubleshooting the IBM i Enterprise Server
This section provides an overview of IBM i enterprises server troubleshooting and discusses how to:
-
Troubleshoot IBM i enterprise server installation.
-
Troubleshoot multiple release setup.
-
Troubleshoot JDBNET.
-
Troubleshoot interprocess communications.
-
Troubleshoot jde.ini file.
12.8.1 Understanding IBM i Enterprise Server Troubleshooting
This subsection explains how to troubleshoot problems that can occur on an IBM i enterprise server. When troubleshooting, follow these guidelines:
-
Try to narrow the definition of any problem that you have, particularly when communicating the issue to someone, such as JD Edwards Worldwide Customer Support Services.
For example, rather than reporting that the batch application failed, explain how the batch application failed. The more specific the information, the faster the problem can be solved. Rather than reporting that "The report had the wrong data," say that "The batch status is E."
-
When communicating an error message to someone, be sure to include all parts of the error message exactly as they appear in the log file or on the screen.
Parts of the message that might not seem important might actually hold the key as to why an error occurs. Also, distinguish between characters that might be misinterpreted, for example, the capital letter "O" and the numeral zero.
-
As soon as you notice an error, examine the log files.
Messages near the end of the log files sometimes reveal the most important information about the cause of the error.
-
Before you restart JD Edwards EnterpriseOne on the server, either delete or move all the files from the log directories. Refer to the JDE.INI file for the locations of the log files.
-
When you first try to get JD Edwards EnterpriseOne running, verify that you have logging turned on. Examine the jde.log and jdedebug.log files carefully.
-
Carefully examine the JOBLOGs and jde.log files of the JD Edwards EnterpriseOne jobs to ensure that authorities and OCM are set correctly. Look for messages such as these in the jde.log files:
JDB3100011 - Failed to get location of table F983051 for environment PD900
Look for messages similar to these in the JOBLOGs:
File F98306 not found in library PRODDTA.
You might want to temporarily modify the job description of the JD Edwards EnterpriseOne user profile to always write the joblog until you are satisfied that all setup is correct.
Note:
To complete the resolutions provided for this issues, you must sign on to the enterprise server using an account that has administrative privileges.12.8.2 Troubleshooting IBM i Enterprise Server Installation
This section explains topics that might create issues during the installation of an IBM i enterprise server.
12.8.2.1 Troubleshooting: Library Installation Verification
| Issue | Resolution |
|---|---|
| You want to verify that the correct libraries and data dictionary items are installed on the IBM i. | See the list of libraries and data dictionary items and descriptions of their contents. |
12.8.2.2 Troubleshooting: Database Table Configuration
| Issue | Resolution |
|---|---|
| Strange database results or errors imply that Object Configuration Manger (OCM) is not set up correctly. For example, you see these message in the jde.log file:
Databases: IBM i:table configuration problems IBM i JDB3300011 - Failed to get location of table F983051 for environment PD900 |
|
12.8.2.3 Troubleshooting: Setting up the IBM i .INI File
| Issue | Resolution |
|---|---|
| You cannot find the .INI file | Find it in IFS. The file should be located in the /<release>/ ini directory. For example, /E900sys/ini/JDE.INI. |
| You need more information on using the IBM i .INI file | Review the notes and descriptions of .INI settings. |
12.8.2.4 Troubleshooting: You Cannot Find the Log Files
The logging is performed to the IBM i Integrated File System (IFS). The naming convention is similar to that of the UNIX enterprise servers. That is, the default names of the files are JDE_AS400JobNumber.log, JDEDEBUG_AS400JobNumber.log, and JDETS.LOG, where AS400JobNumber is the IBM i Job Number of the job that generated the file. The system creates these files automatically, but the path to the files must exist before logging begins. The created log file directory should match the JOBLOG and JDELOG settings in the JDE.INI file.
The path to the log files stored in the IFS can be created by performing successive calls to the IBM i command MKDIR. For example, to create the path /PSFT900/LogFiles, enter this command:
MKDIR DIR('/PSFT900') DTAAUT(*RWX) OBJAUT(*ALL)
Followed by:
MKDIR DIR('/PSFT900/LogFiles') DTAAUT(*RWX) OBJAUT(*ALL)
Logging might be turned off in the .INI. Activate logging in the .INI using these settings in the [DEBUG] section:
[DEBUG]
LogErrors=1
Output=FILE
Where variable names and descriptions are as follows:
LogErrors values are:
0 = Do not generate logs.
1 = Create logs.
Output values (always in upper case) are:
NONE = Do not write debug messages to any output device.
FILE = Write messages to log files.
12.8.2.5 Troubleshooting: Not Enough Relevant Information Is Written to the Log Files
Additional logging information may need to be turned on in the .INI. Set these keys in the .INI for additional information to be output to the log files:
[JDENET]
netTrace=1
[JDEIPC]
ipcTrace=1
[DEBUG]
TAMTraceLevel=1
[UBE]
UBEDebugLevel=6
[TCEngine]
TraceLevel=10
Where variable names and descriptions are as follows:
netTrace values are:
0 = Do not generate JDENet error messages (that is, communication between platforms).
1 = Generate JDENet error messages.
ipcTrace values are:
0 = Do not generate Interprocess Communication (IPC) error messages (that is, communication between processes on a single platform).
1 = Generate IPC error messages.
TAMTraceLevel values are:
0 = Do not generate Table Access Management (TAM) error messages (that is, regarding specification files).
1 = Generate TAM error messages.
UBEDebugLevel values are:
0 = Do not generate batch application error messages.
1-6 = Generate increasingly detailed error messages (1 indicates the least specific message; 6 indicates the most detailed message).
TraceLevel values are:
0 = Do not generate Table Conversion (TC) error messages.
1-10 = Generate increasingly detailed error messages (1 indicates the least specific message; 10 indicates the most detailed message).
Note:
Because NetTrace and ipcTrace messages are written to the debug log associated with that job, the [DEBUG] section of the jde.ini file requires the Output=FILE setting.12.8.2.6 Troubleshooting: Testing with PORTTEST
In general, activate logging when running the PORTTEST program. Review the jde.log and jdedebug members generated by running the PORTTEST program. Also review the IBM i job log generated by running the PORTTEST program. These logs provide valuable information about the JD Edwards EnterpriseOne IBM i configuration and setup.
| Issue | Resolution |
|---|---|
| An error with OCM occurred. | Verify that the OCM is correct for the environment. Disable the security server in the JDE.ini file and make sure that porttest runs successfully. For this work, you must log on with a User ID that has administrative privileges. |
| An error with the security server occurred. | The JD Edwards EnterpriseOne network might not be running. Clear the Interprocess Communication (IPC) structures using the JD Edwards EnterpriseOne IBM i CLRIPC command and restart JD Edwards EnterpriseOne. If you have different versions of JD Edwards EnterpriseOne running, make sure that they are on different ports and have different values for startIPCKeyValue. In the [JDEIPC] section of the JDE.INI file. Also, note that the different versions of JD Edwards EnterpriseOne should have different JD Edwards EnterpriseOne libraries, database files, and IFS directories
Successful running of CLRIPC should result in the appearance of no messages on the screen. If messages appear as a result of CLRIPC, one or more jobs (including an interactive job that ran the PORTTEST program) might have locked some of the IPC shared memory. Determine which job locked shared memory and end it. Try logging off of a session in which you ran the PORTTEST program and running CLRIPC. If all attempts fail, you may change the .INI setting [JDEIPC] startIPCKeyValue to at least 1000 more or less than the current setting. Log off and back on again to ensure the new value is read. Attempt CLRIPC again, and restart JD Edwards EnterpriseOne if CLRIPC is successful. |
| An error with the security server occurred. | The JD Edwards EnterpriseOne network might be running as a service under one library list and you are trying to run the PORTTEST program under another library list. Display all the libraries in the current library list and correct the list if the displayed library list is wrong. Then run the PORTTEST program.
If the library list is correct, the problem could be because the activation group under which the job is running on the IBM i may retain some of the information from previous attempts. Log off, log on, and run the PORTTEST program again. |
| An error with the security server occurred. | The supplied user name or password might not match any names or passwords in the JD Edwards EnterpriseOne security table. Try one of these:
|
| You get these message on the screen:
Invalid parms PORTTEST <USER> <PWD> <ENV> |
You might not have included the correct number of arguments in the PORTTEST program. Use these arguments:
User - A valid JD Edwards EnterpriseOne user ID. Password - Password for the JD Edwards EnterpriseOne user ID. Environment - A valid JD Edwards EnterpriseOne environment. |
| Fewer than 99 F0902 records are written to the screen by PORTTEST. | A possible PORTTEST program failure. Examine the log files.
|
| An error initializing the environment occurs in the log file. | The environment might not be set up correctly. Any errors in the affected .INI keys or database tables could cause the JD Edwards EnterpriseOne initialization to fail. The environment that the PORTTEST program uses is passed as a command line argument. |
12.8.2.7 Troubleshooting: Running JDENET
| Issue | Resolution |
|---|---|
| NETWORK dies immediately. | IPCs might not have been cleared before starting JD Edwards EnterpriseOne (that is, starting JDENET using the JD Edwards EnterpriseOne IBM i command STRNET). End JD Edwards EnterpriseOne (ENDNET). Clear IPCs (using the CLRIPC command) and restart JD Edwards EnterpriseOne.
The startIPCKeyValue in the .INI file could be used by another version of JD Edwards EnterpriseOne. Try one of these:
|
| An error initializing the environment occurs in the log file. |
|
12.8.2.8 Troubleshooting: Testing JD Edwards EnterpriseOne by Submitting a Report
| Issue | Resolution |
|---|---|
| You get these message:
Communication Failure with <server name> |
You might see a message referencing an error of 11, indicating a time out occurred because the server was started after the client was run. Try resubmitting the report.
A time out might have occurred because of heavy network traffic or server load. Increase the time out value for the JDENETTimeout setting in the [NETWORK QUEUE SETTINGS] section of the jde.ini file on the workstation. The wrong communications port might have been used. Verify that the serviceNameListen value in the [JDENET] section of the jde.ini file on the workstation matches the serviceNameConnect value in the [JDENET] section of the jde.ini on the server. In addition, the serviceNameConnect value in the client jde.ini must match the serviceNameListen in the jde.ini on the server. Other communications problems might exist. Run SERVERADMINISTRATIONWORKBENCH.exe (found in the system\bin32 directory on the workstation). This program displays only the machines on the specified port (also known as service) that are running JD Edwards EnterpriseOne (either client or server). Use this information to track down the problem:
|
| The report does not display any data. | No data might exist in the database for the report that you are running, or you do not have access to the data. Try these:
If no data is found, it could be because:
|
| The report does not display any data. | An error might have occurred with the report. Review the jdedebug.log and jde.log files for errors. |
| An error initializing the environment occurs in the log file. | The environment might not be set up correctly:
|
| You get this message:
Communication Failure with <server name> This error occurs sometimes on the workstation Restarting JDENET_N sometimes gets rid of the error You can ping the server from the workstation |
The server might have two network cards, which can confuse JDENET when the net communications are initialized between the client and server. One machine tries to connect using one network card, and the other machine connects using the other network card.
The hosts file on the server should list two different IP addresses for the server: one for each network card. The solution for the error involves setting the NetHostName field in the [JDENET] section of the JDE.INI to one of the names for the server given in the hosts file. JDENET then uses the IP address associated with the given network card. |
12.8.2.9 Troubleshooting: Shutting Down JDENET
Running the IBM i command CLRIPC immediately after shutdown (that is, after running the IBM i command ENDNET) each time you shut down will help you avoid most restart problems.
12.8.2.10 Troubleshooting: Email and PPAT
| Issue | Resolution |
|---|---|
| The batch application, server package installation, or table conversion log file (in the PrintQueue directory) displays the message:
PPAT:troubleshooting IBM i XE Email:troubleshooting: IBM i DoSendMessage Error: User 5600427 does not exist in the address book file (F0101). |
The particular user may not be found in the F0101 table. Add the user to the F0101 table. |
12.8.3 Troubleshooting Multiple Release Setup
This table explains how to troubleshoot problems that can occur with multiple releases on the IBM i:
| Issue | Resolution |
|---|---|
| When you try to run multiple releases of JD Edwards EnterpriseOne at the same time, conflicts seem to occur between each release. | Each installed release of JD Edwards EnterpriseOne may not have its own unique set of keys in the .INI. Change these keys in one or both .INI files:
[JDEIPC] startIPCKeyValue [JDENET] serviceNameListen serviceNameConnect Variable names and descriptions: startIPCKeyValue An integer value that indicates an arbitrary starting memory offset for interprocess communications. For multiple instances of JD Edwards EnterpriseOne server, be sure that the differences between these values are 1000 or more. The default value is 5000. Note: IBM Opti-Connect and Opti-Mover products use the IPC shared memory address 9999. Avoid setting the jde.ini file setting IPCStartKey to a starting value using the range of 9000 to 9999. serviceNameListen Port through which JDENet listens for communications attempts. The default is jde_server (translated using the services file). Each instance of the JD Edwards EnterpriseOne server needs to communicate with JD Edwards EnterpriseOne clients through different ports. serviceNameConnect Port through which JDENet tries to initialize connections with other platforms. The default is jde_server (which is translated using the services file). Each instance of JD Edwards EnterpriseOne server needs to communicate with JD Edwards EnterpriseOne clients through different ports. Also, verify that each version of JD Edwards EnterpriseOne has a unique set of libraries and database files. This is done using the ApplicationPathAddendum setting in the JDE.INI file. |
12.8.4 Troubleshooting JDBNET
This table explains how to troubleshoot problems that can occur with JDBNET:
| Issue | Resolution |
|---|---|
| You do not know how JDBNET is used. | JDBNET processes database requests using a client and server. It can also be configured to process server-to-server requests. This is, one server functions as a JDBNET client and the other as a JDBNET server.
JDBNET eliminates the need for database-specific network software. All database requests are transported to the JDBNET server, processed in a local database, and the results are transported back to the JDBNET client. |
| You get an error that the data source on the JDBNET server is not found. | The correct data source on the JDBNET server may not exist. Create a data source on the server that will be used by JDBNET. This is a normal configuration for a server data source that can be accessed by JDENet running on that server. Note the data source name (OMDATP) that will be used for the JDBNET client configuration. |
| You get an error that the data source on the JDBNET client is not found. | The correct data source on the JDBNET client may not exist. Use the P98611 application to create a JDBNET data source in the F98611 table using this information:
|
| JDBNET does not transfer any data | The network may not be running. End JD Edwards EnterpriseOne, clear IPC (using the IBM i CLRIPC command), and restart JD Edwards EnterpriseOne. |
| JDBNET does not transfer any data | The JDBNET server and client may not be using the same server port number. Modify the serviceNameListen and serviceNameConnect fields in the [JDENET] section of both the JDBNET jde.ini files on the server and on the workstation. These values must match on both the JDBNET server and JDBNET client. |
12.8.5 Troubleshooting Interprocess Communications
This subsection explains how to troubleshoot problems that can occur with Interprocess Communication (IPC).
| Issue | Resolution |
|---|---|
JD Edwards EnterpriseOne jobs cannot communicate with one another with these symptoms:
If you activated ipcTrace in the [JDEIPC] section of the server jde.ini file, an error similar to this should appear in the JDEDEBUG.log: IPC2100017 createIPC Msgq (name Port6005) failed, errno=3484: A damaged object was encountered |
This could be because the IBM i release is pre-V4R2. In these releases, damaged IPC message queues might result when you end JD Edwards EnterpriseOne jobs using the command ENDJOB* IMMED.
CALL QPOZIPCS PARM('-aqE') This program generates a spool file called IPCS that contains information about message queues on the system. Look for these output: KEY MODE 0x00000000 -------- 0x00000000 --RW------- 0x00000000 --RW------- 0x00000000 --RW-------- 0x00001234 D-RW----RW- In this example, the message queue 0x00001234 is damaged. To fix, stop, and restart JDENET using these commands: ENDNET CLRIPC STRNET Also, if the ipcTrace setting in the [JDEIPC] section of the jde.ini file on the server is not set, activate the setting and run the PORTTEST program to determine whether any message queues are damaged. Look for the word damage in the JDEDEBUG.log file. Note: Some of the message queues might be damaged even if the JDEDEBUG.log file does not indicate that any damage exists. |
12.8.6 Troubleshooting the JDE.INI File
This section explains how to troubleshoot problems that can occur with the JDE.INI file. These notes apply to the .INI file in the E900SYS library:
-
It is composed of several sections.
The section names are enclosed in square brackets, for example [JDENET].
-
Within each section are one or more keys or settings.
The key name is on the left side of the equals sign, and the value of the key is on the right side.
-
Do not include spaces in the names or values of the keys unless you know that a space is required.
Do not include spaces immediately before or after the equals sign.
-
Keys may be commented out by adding a semicolon (;) at the start of the key name.
-
We recommend that you place any incidental comments on a separate line adjacent to the key to which the comment applies.
Be sure to include a preceding semicolon. Comments can be included at the end of the key's values, but these comments can be wrongly interpreted if they are not separated from the keys' values by enough white space. Because the amount of white space needed between the keys' values and the comments is not strictly defined, we recommend that you do not place comments after the values of the keys.
-
The section and key names are not case sensitive.
-
Many key values are case sensitive.
-
Although all of the following values may be used to turn a feature on, they may not be interchangeable as values in the .INI. Use a value that is comparable to the default value provided in the original .INI. Also, many values are case sensitive. If you have any questions about values, contact JD Edwards Global Support Center.
-
YES
-
ON
-
TRUE
-
1
-
Likewise, these values may be used to turn a feature off. They are not necessarily interchangeable as values in the .INI.
-
NO
-
OFF
-
FALSE
-
NONE
-
0
If you are told by JD Edwards Worldwide Customer Support Services to modify a key that does not exist, you can add the key. Just be sure that it is in the correct section.
12.9 Troubleshooting the UNIX/Linux Enterprise Server
This section provides an overview for UNIX/Linux enterprise server troubleshooting and discusses how to:
-
Troubleshoot the jde.ini file.
-
Troubleshoot JD Edwards EnterpriseOne file copying to a server.
-
Troubleshoot database table configuration.
-
Troubleshoot printer setup.
-
Troubleshoot email.
-
Troubleshoot multiple release setup.
-
Troubleshooting report file output location.
-
Troubleshoot JDBNET server not found.
-
Troubleshoot JD Edwards EnterpriseOne testing.
12.9.1 Understanding UNIX/Linux Enterprise Server Troubleshooting
This section discusses some typical problems that you might encounter and their solutions. When troubleshooting, follow these guidelines:
-
Check the logs.
Many times, the logs point to the problem. As soon as you notice an error, examine the log files. Messages near the end of the log files will probably reveal the most important information about the cause of the error.
-
Try to narrow down the definition of any problem that you may have, particularly when communicating the issue to someone, such as JD Edwards Worldwide Customer Support Services.
For example, rather than reporting that the batch application failed, explain how the batch application failed. The more specific the information, the faster the problem can be solved. For example, rather than reporting that "The report had the wrong data," say that "The batch status is E."
-
When communicating an error message to someone, include all parts of the error message exactly as they appear in the log file or on the screen.
Parts of the message that may not seem important may actually hold the key as to why an error occurred. Also, distinguish between characters that might be misinterpreted, such as the capital letter O and the numeral zero (0).
-
Before you restart JD Edwards EnterpriseOne on the server, either delete or move the jde_xxx.log and jdedebug_xxx.log files (where xxx is a number).
Do not rename the log files because it is easier to work with logs that use the standard naming convention (jde_xxx.log and jdedebug_xxx.log). If you need to save the log files until the problem is solved, then create a temporary directory and move the files.
-
Clear the log directory regularly to avoid filling the file system.
If the file system fills up, then the specification files can become corrupted.
-
Always keep a backup of the specification files handy in case they become corrupted.
Specification files should be backed up regularly for easy recovery of specification installs. If spec files have to be replaced, all specification installations will be lost if backups are not kept.
-
To find problems that occur due to server failure, go to the system/bin32 directory:
grep -n failed *log* > problems.txt
The file problems.txt will contain a list of errors with the file and line number.
-
Remember that UNIX is case-sensitive: jde.ini is not the same file as JDE.INI.
Important:
To complete the resolutions provided for this issues, you must sign on to the UNIX enterprise server using an account that has administrative privileges.
12.9.2 Troubleshooting the JDE.INI File
To locate the JDE.INI file, search in the system/bin32 subdirectory. For example, /u01/JDEdwards/E900/ini/JDE.INI. These notes apply to the JDE.INI:
-
It is composed of several sections.
The section names are enclosed in square brackets; for example, [JDENET].
-
The environment variable $JDE_BASE should contain the location of the JDE.INI file.
-
If you copy the JDE.INI file to other directories (for example, the $SYSTEM/bin32 directory), the JD Edwards EnterpriseOne programs could read the wrong JDE.INI file.
This error occurs because some programs might look for the JDE.INI file in the current directory before looking at the JDE_BASE environment variable.
-
Each section contains one or more keys.
The key name is on the left side of the equal sign, and the value of the key is on the right side.
-
Do not include spaces in the key names or key values unless you know that a space is required.
Do not include spaces immediately before or after the equal sign.
-
Keys can be commented out by adding a semicolon (;) at the start of the key name.
-
We recommend that you place incidental comments on a separate line adjacent to the key to which the comment applies.
Be sure to include a preceding semicolon. Comments can be included at the end of the key value, but these comments can be incorrectly interpreted if they are not separated from the values of the keys by sufficient white space. Because the amount of white space between the values of the keys and the comments is not strictly defined, we recommend that you do not place comments after the values of the keys.
-
Section and key names are not case sensitive.
-
Many key values are case sensitive.
-
Although all of the following values activate a feature, they may not be interchangeable as values in the JDE.INI.
Use a value that is comparable to the default value provided in the original JDE.INI. Also, many of these values are case sensitive. If you have any questions about values, contact JD Edwards Worldwide Customer Support Services.
-
YES
-
ON
-
TRUE
-
1
-
These values turn a feature off. They are not necessarily interchangeable as values in the JDE.INI.
-
NO
-
OFF
-
FALSE
-
NONE
-
0
If you are told by JD Edwards Worldwide Customer Support Services to modify a key that does not exist, you can add the key. Ensure that the key is in the correct section and entered with the correct spelling and case.
12.9.3 Troubleshooting JD Edwards EnterpriseOne File Copying to a Server
If you cannot copy files from the deployment server to the temporary directory on the enterprise server, this could be because ftp cannot connect. See the system administrator.
12.9.4 Troubleshooting Database Table Configurations
If results or errors occur that imply that OCM is not set up correctly, review the description in this guide of how OCM is used by JD Edwards EnterpriseOne.
12.9.5 Troubleshooting Printer Setup
If reports do not print from a server, verify the name of the default printer. Send a simple text file to the default printer using the lp command. If you get an error similar to these, then the printer is not configured on the server or is not online:
"lp: destination aPrinter non-existent"
Contact the system administrator for assistance.
For Linux, do not set up a print queue that translates files to postscript. The Linux print queues that are used by JD Edwards EnterpriseOne should generally be "raw" print queues that simply redirect the output of the file to the printer.
12.9.6 Troubleshooting Email
If the report, server package installation, or table conversion log file (in the PrintQueue directory) displays the message DoSendMessage Error: User 5600427 does not exist in the address book file (F0101), the particular user might not be found in the F0101 table. Add the user to the F0101 table.
12.9.7 Troubleshooting Multiple Release Setup
Each installed release of JD Edwards EnterpriseOne has its own JDE.INI in its ini directory. Point the user entries in the JDE.INI files to the directories of the log and other files. If the log files do not go to separate directories, change the appropriate keys in one or both JDE.INI files to point to unique directories for each installed instance of JD Edwards EnterpriseOne.
12.9.8 Troubleshooting Report File Output Location
If you cannot find the report output files, consider this information:
-
The location is specified as the OutputDirectory key of the [NETWORK QUEUE SETTINGS] section in the JDE.INI on the server.
If this key is not found, the location is the PrintQueue subdirectory of the JD Edwards EnterpriseOne base directory (for example, /u01/JDEdwards/E900SYS/PrintQueue).
-
The JDE.INI file on the workstation may have the SaveOutput key of the [NETWORK QUEUE SETTINGS] section set to FALSE.
This is because a problem after the report has been printed. After the report is printed, then the record will be deleted, as will the .PDF file. Change the value of the SaveOutput key of the [NETWORK QUEUE SETTINGS] section in the JDE.INI on the workstation to TRUE.
12.9.9 Troubleshooting JDBNET Server Not Found
If you get an error that the data source on the JDBNET server is not found, the correct data source on the JDBNET server might not exist. Create a data source on the server that will be used by JDBNET. This is a normal configuration for a server data source that can be accessed by JDENet running on that server. Note the data source name (OMDATP) that will be used for the JDBNET client configuration.
If you get an error that the data source on the JDBNET client is not found, the correct data source on the JDBNET client might not exist. Create a JDBNET data source in the F98611 table using this information:
-
Data source name (OMDATP field).
Used to access tables as specified in the F986101 table.
-
Server name (OMSRVR field).
Identifies the JDBNET server.
-
Database name (OMDATB field).
Matches exactly the data source name (that is, the OMDATP field) to be used by the JDBNET server.
-
Shared library name (OMDLLNAME field).
Identifies the JDBNET client .DLL. (libjdbnet.sl on HP-UX, libjdbnet.so on AIX).
-
All other columns must match the values in the corresponding columns of the server data source.
Set this data source as an active override in the F986101 table for all tables that will be accessed through JDBNET.
12.9.10 Troubleshooting JD Edwards EnterpriseOne Testing
If the PORTTEST program does not run successfully after startup:
-
If you have Oracle or UDB running on the enterprise server and the database and JD Edwards EnterpriseOne services are set to start automatically at system startup, JD Edwards EnterpriseOne services may start before the database is running completely.
You must ensure that the database software is running before starting any JD Edwards EnterpriseOne processes.
-
If JD Edwards EnterpriseOne loses the connection to the database because either the network or database went down, you should see some sort of network or database error in the log files.
-
Stop the JD Edwards EnterpriseOne services, clear the logs, and then restart the JD Edwards EnterpriseOne services to see if the problem is resolved.
12.10 Troubleshooting the Microsoft Windows Enterprise Server
This section provides an overview of Microsoft Windows enterprise server troubleshooting and discusses how to:
-
Troubleshoot JD Edwards EnterpriseOne account setup.
-
Troubleshoot JD Edwards EnterpriseOne file copying to a server.
-
Troubleshoot database table configuration.
-
Troubleshoot printer setup.
-
Troubleshoot jde.ini file setup.
-
Troubleshoot finding the log files.
-
Troubleshoot testing with the PORTTEST program.
-
Troubleshoot running JD Edwards EnterpriseOne manually.
-
Troubleshoot finding report files.
-
Troubleshoot testing JD Edwards EnterpriseOne by submitting a report.
-
Take ownership of a printer.
-
Stop all JD Edwards EnterpriseOne processes.
-
Stop all JD Edwards EnterpriseOne processes without rights.
-
Troubleshoot email.
12.10.1 Understanding Microsoft Windows Enterprise Server Troubleshooting
This section discusses some typical problems that you might encounter and their solutions. When troubleshooting, follow these guidelines:
-
Narrow the definition of any problem that you might have, particularly when communicating the issue to someone, such as JD Edwards Worldwide Customer Support Services.
For example, rather than reporting that the batch application failed, explain how the batch application failed. The more specific the information, the faster the problem can be solved. For example, rather than reporting that "The report had the wrong data," say that "The batch status is E."
-
When communicating an error message to someone, be sure to include all parts of the error message exactly as they appear in the log file or on the screen.
Parts of the message that may not seem important may actually hold the key to why an error occurs. Also, distinguish between characters that might be misinterpreted (for example, the capital letter O and the number 0).
-
As soon as you notice an error, examine the log files.
Messages near the end of the log files sometimes reveal the most important information about the cause of the error.
-
Before you restart JD Edwards EnterpriseOne on the server, either delete or move the jde_xxx.log and jdedebug_xxx.log files (where xxx is a number).
Do not rename the log files; it is easier to work with logs that use the standard naming convention (jde_xxx.log and jdedebug_xxx.log). If you need to save the log files until the problem is solved, create a temporary directory and move the files there.
-
Clear the log directory regularly to avoid filling the file system. If the file system fills up, the specification files become corrupt.
-
Always keep a backup of the specification files in case they become corrupt.
Specification files should be backed up regularly for easy recovery of spec installs. If specification files have to be replaced, all specification installations are lost unless backups are kept.
Note:
To complete the resolutions provided for this issues, you must sign on to the Microsoft Windows enterprise server using an account that has administrative privileges.
12.10.2 Troubleshooting JD Edwards EnterpriseOne Account Setup
If you cannot set up any accounts in the User Manager program, the account you are logged into in Microsoft Windows may not have the privileges to modify or add accounts. Log out of Microsoft Windows and log back on under the Administrator account or an account in the Administrators group.
12.10.3 Troubleshooting JD Edwards EnterpriseOne File Copying to a Server
If you cannot copy files from the CD to the JD Edwards EnterpriseOne directory on the enterprise server, verify that the CD is in the CD-ROM drive. Another cause is that one or more of the files to be copied is currently open on the CD:
-
Close any files on the CD that are open.
-
Close any applications that may have files open on the CD.
If one or more of the files that will be overwritten in the target directory is open:
-
Close any files in the target directory that are open.
-
Close any applications that may have files open in the target directory.
If the target disk is full:
-
Delete or move files from the target disk.
-
Copy JD Edwards EnterpriseOne to a different disk.
12.10.4 Troubleshooting Database Table Configuration
If the OCM is not set up correctly and errors occur, run the VerifyOCM program to ensure that the OCM tables are set up correctly.
12.10.5 Troubleshooting Printer Setup
If you cannot set up a printer:
12.10.6 Troubleshooting jde.ini File Setup
If you cannot find the jde.ini file:
-
Search in the system\bin32 subdirectory in the JD Edwards EnterpriseOne tree. For example, z:\JDEdwards\E900\ddp\system\bin32\ jde.ini.
-
Make sure you have access rights to the system\bin32 directory by logging on to Microsoft Windows as a user who has administrative rights.
12.10.7 Troubleshooting Finding the Log Files
If you cannot find the log files:
-
Log files are listed in the DebugFile and JobFile keys in the [DEBUG] section of the jde.ini.
If there are no paths, the logs are in the system\bin32 directory. The log files are named according to these scheme:
An underscore (_) and the process ID of the process that creates the log file are inserted before the period for example, jde_123.log or jdedebug_123.log for a process with an ID of 123.
The log file associated with the DebugFile key contains the sequence of JD Edwards EnterpriseOne events. The default value for this key is jdedebug.log. The log file associated with the JobFile key contains error messages that occur in JD Edwards EnterpriseOne. The default value for this key is jde.log.
-
When a batch application is run and the jde.ini on the workstation has [NETWORK QUEUE SETTINGS] SaveOutput=TRUE, the jde_xxx.log and jdedebug_xxx.log files for the runbatch that processed the batch application is copied to a file in the PrintQueue directory.
The root name of the files are the same as the name of the PDF file. The extension is .jde.log and .jdedebug.log. The duplication of these log files does not occur if the batch application runbatch.exe dies before duplication.
-
Verify that logging in the jde.ini is turned on using these settings in the [DEBUG] section:
[DEBUG]
LogErrors=1
Output=FILE
Variables and their descriptions:
LogErrors
0 = Do not generate logs.
1 = Create logs.
Output
NONE = Do not write messages to any output device.
AUX = Write messages to a console window.
FILE = Write messages to log files.
BOTH = Write messages to log files and console window.
If not enough relevant information is written to the log files, this could be because additional logging information needs to be turned on in the jde.ini. Set these keys in the jde.ini for additional output to the log files:
[JDENET]
netTrace=1
[JDEIPC]
ipcTrace=1
[DEBUG]
TAMTraceLevel=1
[UBE]
UBEDebugLevel=6
[TCEngine]
TraceLevel=10
These are the variables that you use to set logging options:
-
netTrace
-
0 = Do not generate JDENet error messages (that is, communication between platforms).
-
1 = Generate JDENet error message.
-
ipcTrace
-
0 = Do not generate Interprocess Communication (IPC) error messages (that is, communication between processes on a single platform).
-
1 = Generate IPC error messages.
-
TAMTraceLevel
-
0 = Do not generate Table Access Management (TAM) error messages (that is, regarding specification files).
-
1 = Generate TAM error messages.
-
UBEDebugLevel
-
0 = Do not generate batch application error messages.
-
1 = Generate increasingly detailed error messages (1 gives the least specific messages, whereas 6 gives the most detailed messages).
-
TraceLevel
-
0 = Do not generate Table Conversion (TC) error messages.
-
1-10 = Generate increasingly detailed error messages (1 gives the least detail, whereas 10 gives the most detail).
12.10.8 Troubleshooting Testing with the PORTTEST Program
If an error with the security server occurred:
-
Verify the JD Edwards EnterpriseOne network is running either as a service or started from a command prompt.
-
If the security server is inactive, or if it is active on a server and port that is different from the ones the PORTTEST program uses, perform one of these tasks:
Start JD Edwards EnterpriseOne net on the server and port where the PORTTEST program is being run. The security server key in the [SECURITY] section of the jde.ini specifies the security server, and the serviceNameListen and serviceNameConnect settings in the [JDENET] section specify the ports.
Change the name of the security server or the names of the ports, or both, in the jde.ini file to point to the correct security server.
-
Make sure that the JD Edwards EnterpriseOne network and the PORTTEST program are running under the same account:
To determine under which account PORTTEST is running, press the Control, Alt, and Delete keys at the same time. If the JD Edwards EnterpriseOne network is running as a service, determine under which account it is running. To do this, select the service in Microsoft Windows Control Panel, then go to Services and click Startup.
For initial testing, you can stop the JD Edwards EnterpriseOne network service, open a Windows command prompt, cd to the system\bin32 directory, run jdenet_n without any parameters, and rerun the PORTTEST program. When finished, stop jdenet_n from the Microsoft Windows Task Manager.
To run the PORTTEST program under the same account as the JD Edwards EnterpriseOne network service, log out of Windows, log into the same account under which the service is running, open a Microsoft Windows command prompt, cd to the system\bin32 directory, and rerun the PORTTEST program.
-
To make sure the supplied user name and password, or both, match names and passwords, or both, in the JD Edwards EnterpriseOne security table:
Run the PORTTEST program with a valid user name and password. Add the given user name and password to the JD Edwards EnterpriseOne security table.
If you get the message Invalid parms PORTTEST: <USER> <PWD> <ENV>, the correct number of arguments to PORTTEST may not have been included. Use these arguments:
-
User - A valid JD Edwards EnterpriseOne account name.
-
Password - Password for the JD Edwards EnterpriseOne account.
-
Environment - A valid JD Edwards EnterpriseOne environment.
-
Fewer than 99 records are written to the screen by PORTTEST.
If PORTTEST failed, examine the log files.
If fewer than 99 records exist in the F0902 table, this is not an error. You should review the log files for errors.
If the F0902 table is not accessible, verify that you can query the F0902 table using SQL.
If an error initializing the environment occurs in the log file, the environment may not have been set up correctly. Any errors in the affected jde.ini keys or database tables could cause the JD Edwards EnterpriseOne initialization to fail. The environment that PORTTEST uses is passed as a command line argument.
12.10.9 Troubleshooting Running JD Edwards EnterpriseOne Manually
-
If the JD Edwards EnterpriseOne network is not running, start the JD Edwards EnterpriseOne network service.
-
Verify the JD Edwards EnterpriseOne network is running by doing these:
-
The JD Edwards EnterpriseOne network should either be running as a service or from a Windows command prompt.
-
If it is running as a service, determine under which account it is running.
To do this, select the JD Edwards EnterpriseOne network service in Microsoft Windows Control Panel, select Services, and then select Startup. Note the account name. If you are using Microsoft Windows 2000, select the JD Edwards EnterpriseOne network service in the Windows Control Panel, select Services, and then select Properties.
-
If it is run from a command prompt, the network is running under the Microsoft Windows account you signed on to.
When you log off Microsoft Windows, network processes started from a command prompt and all child processes will terminate.
-
-
If the setup of some part of JD Edwards EnterpriseOne, such as the jde.ini file or OCM, is incorrect, determine if PORTTEST runs correctly.
If not, correct those problems and then try running JD Edwards EnterpriseOne manually.
If an error initializing the environment occurs in the log file, the setup for some part of JD Edwards EnterpriseOne, such as the jde.ini file or OCM, may be incorrect. Examine the applicable problems in the "Testing with the PORTTEST Program" section in this chapter. Determine if the PORTTEST programs runs correctly. If not, correct those problems, and then try running JD Edwards EnterpriseOne manually.
12.10.10 Troubleshooting Finding the Report Files
If you cannot find the report output files:
-
Check the OutputDirectory key of the [NETWORK QUEUE SETTINGS] section in the jde.ini file on the server.
If there is no location, listed, the files are in the PrintQueue directory of the JD Edwards EnterpriseOne base directory. For example, z:\JDEdwards\E900\ddp\PrintQueue.
-
Verify that SaveOutput in the [NETWORK QUEUE SETTINGS] section in the jde.ini file on the workstation is TRUE.
12.10.11 Troubleshooting Testing JD Edwards EnterpriseOne by Submitting a Report
-
If a time-out occurred because the JD Edwards EnterpriseOne server was started after the client, resubmit the report.
-
If a time-out occurred due to heavy network traffic or server load, increase the time-out value in the jde.ini file on the workstation and resubmit the report.
Use the JDENETTime-out setting in the [NETWORK QUEUE SETTINGS] section.
-
If the wrong communications port is being used, perform one of these tasks:
-
Verify that the serviceNameListen value in the [JDENET] section of the jde.ini file on the workstation matches the serviceNameConnect value in the [JDENET] section of the jde.ini file on the server.
In addition, the serviceNameConnect value in the jde.ini file on the workstation must match serviceNameListen in the jde.ini file on the server. If the values of these keys are strings, the numeric value is retrieved from the services file in the c:\winnt\system32\drivers\etc directory (Microsoft Windows: client or server).
-
The services file contains a list of strings and their corresponding port numbers.
If the port that you are interested in is on the last line of the services file, be sure to include a return at the end of the line or else the string will not be translated to the corresponding port number.
-
-
If the client is using Dynamic Host Configuration Protocol (DHCP) and the server does not have an entry for itself in its hosts file in the c:\winnt\system32\drivers\etc directory, add an entry for the server in the hosts file on the server.
-
These situations can occur:
-
Communications failure error message on the workstation.
-
Restarting Network Service or jdenet_n sometimes gets rid of the error.
-
You can ping the server from the workstation.
These issues can occur because the server has two network cards, which confuses JDENET when the net communications are initialized between the client and server. One machine tries to connect using one network card, and the other machine connects using the other network card.
The hosts file on the server should list two different IP addresses for the server--one for each network card. Resolve the error by setting the NetHostName field in the [JDENET] section of the jde.ini to one of the names for the server given in the hosts file. JDENET then uses the IP address associated with the given network card.
-
-
For the error cannot connect to printer in the jde_xxx.log or the log file in the PrintQueue subdirectory:
-
If a general printing error occurred, try to print a text document from Notepad.
Resolve any issues.
-
If no default printer is set up on the enterprise server, see "Overriding Printer Location for Jobs" in the JD Edwards EnterpriseOne Tools System Administration Guide
-
If you do not have privileges to the printer, define the owner as a local or network account.
The type of account depends on the type of printer. If the printer is a local printer, the owner could be either a local or network account but either type must have privileges to access the printer. If the printer is a network printer, the owner must be a network account with access privileges.
-
-
All jobs sent to this printer using the current server will conform to the selected orientation.
Note that the report template or other programs may override this default orientation. If you cannot change the printer orientation, you may not have the right to change the orientation. Log on to Microsoft Windows in an account that has administrative rights for the printer. For a local printer, use an account that has administrative privileges. For a network printer, use an account given administrative privileges by a network administrator.
If the report does not list any data, the data may not exist in the database for the report that you are running, or you do not have access to the data. Perform one or more of these tasks to resolve the data issue:
-
Select a different report.
-
Add data to the database.
-
Change the processing options for the report.
-
Change the OCM and data sources to point to the correct database.
-
-
If the report is launched on the server, verify the vertical tables in the server OCM match those in the workstation OCM.
If you believe data should have been found, edit the report jdedebug.log found in the PrintQueue subdirectory.
Search for the SQL select statement used to retrieve data from the database. You must have some idea what data is being read to do this.
-
Copy the SQL statement.
-
Open the specific database SQL command interface - for example, SQL Plus or ISQL_w.
-
Paste the SQL statement into the SQL command interface.
-
Submit the SQL statement.
-
-
If no data is found, one of these conditions may be true:
-
No data exists.
-
The processing options are incorrect.
-
The OCM for either the client or server is pointing to the wrong data source.
-
The data sources for either the client or server are pointing to the wrong database.
-
The SQL statement is incorrect (possibly due to a program bug).
-
The database drivers are out of date.
-
If an error occurred with the report, look in the jde_xxx.log for error messages.
-
-
If an error initializing the environment occurs in the log file, the environment may not be set up correctly.
Stop JD Edwards EnterpriseOne and determine if the PORTTEST program runs correctly. If not, correct those problems and then run JD Edwards EnterpriseOne manually.
12.10.12 Taking Ownership of a Printer
To take ownership of a printer:
-
From the Microsoft Windows Start menu, select Settings, Printers.
-
Right-click the desired printer.
-
Select Properties, and then select the Privileges tab.
-
Click Ownership and Take Ownership.
If the report printouts are in portrait mode but should be in landscape mode (or vice versa), verify that the orientation specified in RDA for the report is correct.
If the default printer is set to the wrong orientation, set the orientation using these task:
-
From the Microsoft Windows Start menu, select Settings, Printers.
-
Right-click the desired printer.
-
Select Document Defaults.
-
Select the desired default orientation.
-
Click OK.
12.10.13 Stopping All JD Edwards EnterpriseOne Processes
If you need to stop the JD Edwards EnterpriseOne processes that you started from the command prompt, for example, jdenet_n, stop any of these processes that are running:
-
Jdenet_n.exe
-
Jdenet_k.exe
-
Runbatch.exe
-
ipcsrv.exe
These additional processes, such as jdenet_k and runbatch, are started by jdenet_n and queue kernel.
To stop all JD Edwards EnterpriseOne processes:
-
Run the Microsoft Windows Task Manager.
-
Select the Processes tab.
-
Select one of the running processes.
-
Click End Process.
-
Repeat for each process to be stopped.
12.10.14 Stopping JD Edwards EnterpriseOne Processes Without Rights
Use this task if you do not have the rights to stop the processes.
To stop JD Edwards EnterpriseOne processes without rights:
-
Log on to Microsoft Windows in an account that has rights to stop processes.
-
Stop processes using Visual C++.
-
Select the Processes tab.
-
Select one of the running processes.
-
Click Debug Process.
Visual C++ starts.
-
Click the X in the upper right-hand corner to close Visual C++.
Do not save the project workspace. This ends the runaway process.
-
Repeat these steps for each runaway process.
If they still do not end, reboot the machine.
12.10.15 Troubleshooting Email
If the report, server package installation, or table conversion log file in the PrintQueue directory displays the message DoSendMessage Error:
User 5600427 does not exist in the address book file (F0101).
This could be because the particular user is not found in the F0101 table. Add the user to the F0101 table.
12.11 Troubleshooting Web Servers
This section provides an overview of web server troubleshooting and discusses how to:
-
Troubleshoot IIS and IBM HTTP web servers.
-
Troubleshoot JAS.
-
Troubleshoot serialized database and generation issues.
-
Troubleshoot SQL server issues.
-
Troubleshoot problems using log files.
12.11.1 Understanding Web Server Troubleshooting
This section discusses some typical issues you might encounter when using WebSphere and Java Application Server (JAS). It also explains other issues you might encounter with web servers and how to track down problems by using the log files in Server Manager.
12.11.2 Troubleshooting IIS and IBM HTTP Web Servers
If you need to configure with IIS and an IBM HTTP Server, refer to the installation documentation.
If you receive the message Recursive error - page not found, you need to make sure IIS is running for a particular instance of JAS. IIS instances can be stopped easily, and the user may forget to restart them. To make sure IIS is running for the particular instance of JAS, verify IIS instance properties by selecting the appropriate instance, and then right-clicking and choosing Properties. Confirm that the correct paths are listed for the desired JAS code.
12.11.3 Troubleshooting JAS
If no logs appear, verify that the [LOGS] setting in the jas.ini has logging turned on and points the log files to reside in the desired location (for example, ;log=d:\E900\internet\jas.log or ;debuglog=d:\E900\internet\jasdebuglog). If the log file paths are not correctly stipulated, the logs may be writing to a file located elsewhere.
If JAS seems slow, check to see whether jdbcTrace is set to TRUE or FALSE. If tracing is turned on or set to TRUE, the additional logging will dramatically slow JAS performance.
12.11.4 Troubleshooting Serialized Database and Generation Issues
If you receive the message "Form is out of date...most likely needs to be regenerated," this error usually occurs because the specifications used to construct the serialized database do not match the JAS code. Ensure that the date the JAS code was written matches the date of the jdecom.dll that resides in the E900\system\bin32 directory of the generating machine.
Also be sure to register the jdecom.dll. After you run the regsvr32 jdecom.dll command, the eGenerator recognizes the jdecom.dll and uses it to fetch JD Edwards EnterpriseOne specs and convert them into Java serialized objects.
If the menu does not appear when the user signs on to JD Edwards EnterpriseOne, check for these conditions:
-
[JDBC URL] section in jde.ini is set correctly or [JDBC DRIVERS] is set correctly.
The [JDBC URL] points to the serialized database (the one you just set up).
-
Bounce the WebSphere application server.
Menus are cached, and by bouncing the server you clear the cached information.
-
Ensure that the host database for serialized objects is running.
12.11.5 Troubleshooting SQL Server Issues
If SQL Server process or Oracle process consumes excess CPU in a web server environment, the serialized objects for the web server are stored in either SQL server or the Oracle database. The web server must access these tables frequently when running an application. Indexes may be missing, which can cause severe performance problems.
Ensure that all existing JD Edwards EnterpriseOne indexes are created for tables F989998 and F989999. You should have one index for F989998 for columns WBJOBID and WBOID. You should also have one index for F989999 for columns WBUID, WBOID, WBLNGPREF. If these indexes do not exist in the database, generate them using Object Librarian.
Add a new index to the F989999. This index should include columns WBOID, WBUID, and WBJVER. Generate this index over the F9899999 table.
Update statistics on both tables as follows:
-
For Oracle, issue these commands in SQL *Plus:
ANALYZE TABLE owner.F989999 COMPUTE STATISTICS
-
For SQL Server, issue these commands:
UPDATE STATISTICS owner.F989999
UPDATE STATISTICS owner.F989998
Improvements vary depending on the number of users accessing the serialized database.
12.11.6 Troubleshooting Problems Using Log Files
If you need to view logging information for the Java client, open the Java Console by choosing Java Console from the View menu in Internet Explorer. The Java Console displays all problems that the Java Virtual Machine on the client is having. Errors appear as uncaught exceptions in the console.
Note:
You must have the appropriate internet options turned on to view the Java Console.To enable the Java Console in Internet Explorer, select Tools, and then select Internet Options. In Internet Options, click the Advanced tab, scroll down to the section titled Java VM, and select these options:
-
Java Console enabled.
-
Java logging enabled.
-
JIT compiler for virtual machine enabled.
If you need to troubleshoot errors in web applications:
-
Verify that the problem is only a problem on the web.
Test the fat client version of the same application against the same enterprise server that the web is using. Make sure that you use the same JD Edwards EnterpriseOne accounts and environments.
-
Determine whether the problem happens in HTML, Java, or both.
Since both Java and HTML use the Java runtime engine, they should behave the same. Some variation exists based on the inherent differences between the Portal, HTML page processing and Java interactive processing, but underlying functionality and processing should be the same.
-
Re-create the problem on the web server.
The logs will work in the Portal, HTML, and Java.
-
Open a separate Internet Explorer browser and use it to access the Web Server Monitor for the web server being used.
-
Check the Standard Error Log (stderr.log) for errors.
A common error you might see here is BSFN Failed. If you see this error, verify that the enterprise server is up and that the BSFN is not a T1 BSFN.
T1 refers to Type 1 business functions, which are client-only business functions. They cannot run on a server.
-
Check the Standard Output Log (stdout.log) for more information.
For example, you can view the time and date stamps from the errors found in both the Jas.log and the standard error log to find more detailed information about what was occurring at about the same time that the errors occurred.
If you need more information, enable Debug.log and set Net Trace, which you can do in the [LOGS] section of jas.ini file. Re-create the problem, view the Debug.log, and look for more information.
You can also use the Server Manager to monitor web servers.
Try to find SQL statement information. SQL statements can give you an idea of what values are being passed. Some common failures include:
-
Form Interconnects are passing incorrect information.
Verify that the fat client is working correctly. Watch especially for null, blank, and zero problems, as well as special characters.
-
String is too big.
Note carefully what you did to get this error.
-
Null values are being passed.
The SQL statement information search will result in nothing being found. Check the SQL statements and make sure that correct values were passed. Determine where the failure occurred and make a note of it.
-
The application stops responding.
Check logs for BSFN failures.