22 Monitor JD Edwards EnterpriseOne Servers
This chapter discusses:
22.1 E-Mail Configuration
When you click the Server Activity link in the What do you want to do? pane, the Management Console displays another pane under What do you want to do? called E-Mail Configuration.
E-Mail is sent through SMTP and is SMS/pager friendly.

To configure e-mail notification for monitors:
-
Complete these fields:
-
Mail Server (SMTP)
Defines the name of the SMTP mail server Server Manager will utilize for sending e-mails.
-
SMTP Port
The TCP/IP port to use when connecting to the SMTP mail server for sending e-mails. The default value is 25, though some mail servers may be configured to use an alternate port.
-
Sender Email
The e-mail address to use as the sender for e-mail notifications sent by Server Manager.
-
Email Address
Enter an email address (or multiple addresses separated with a comma).
-
-
Click the Save button to save your settings.
-
To verify your settings and email address for use by Monitors, click the Test button. If the test is not successful, an error appears.
22.2 Monitors
This section describes:
22.2.1 Create a Monitor
You use monitors to track events that occur within the management domain and record historical data of managed instances. Once you create the monitor, the configuration page for the new monitor will be displayed. Multiple monitors can be created with different parameter settings to monitor various aspects of managed instances. An email can then be sent to the appropriate person or group alerting them to specified status changes in the managed instances.

To create a new monitor:
-
Complete these fields:
-
Monitor Name
Defines the name of the new monitor. The monitor name must be unique.
-
Monitor Type
Defines the type of the new monitor. The available monitor types appear in the drop down selection.
-
-
Click the Create button to create your new monitor. When the new monitor has been created a monitor configuration page is displayed.
22.2.2 Monitor Configuration
All configuration items for the new monitor are displayed on this page.
This section describes:
22.2.2.1 General Properties

To configure General Properties for monitors:
-
Complete these fields:
-
Query Interval (Seconds)
Specifies the number of seconds between collections. Some monitored events are pushed to the management console, in which case the corresponding notifications will be sent soon after the event occurs. Other events require periodic polling to identify. This value specifies the amount of time between those polls. Use caution when setting this to a low value (such as under a minute), as this may negatively impact performance of the managed instances.
-
Automatically Start Monitor
You select this to automatically start the new monitor. If the Management Console should stop and restart, the monitor will start automatically if this has been selected.
-
-
Click the Save button to save your settings.
Note:
The Save button applies only to the pane where the Save button is located. It does not save the entire page. The Save button must be clicked within each pane for changes made within that pane.22.2.2.2 Managed Instances
This section describes:

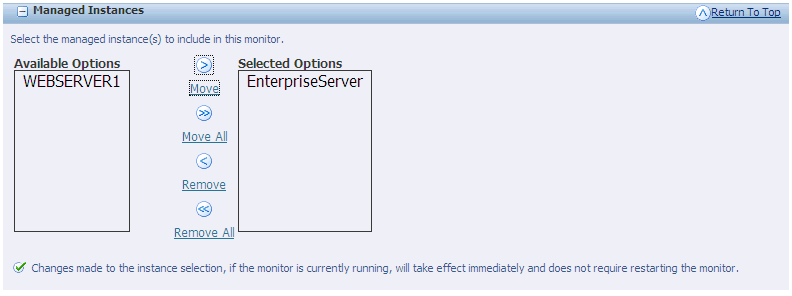
22.2.2.2.1 Include a Managed Instance(s) in a Monitor
One or more managed instances may be selected to be monitored.
To include a managed instance(s) in a monitor, either:
-
Select an instance from Available Options and click Move, or
-
Click Move All to include all managed instances.
22.2.2.2.2 Remove a Managed Instance(s) from a Monitor
To remove a managed instance(s) from a monitor, either:
-
Select an instance from Selected Options and click Remove, or
-
Click Remove All to remove all managed instances.
Note:
Changes made to the instance selection, if the monitor is currently running, will take effect immediately and does not require restarting the monitor.22.2.2.3 Monitored Events
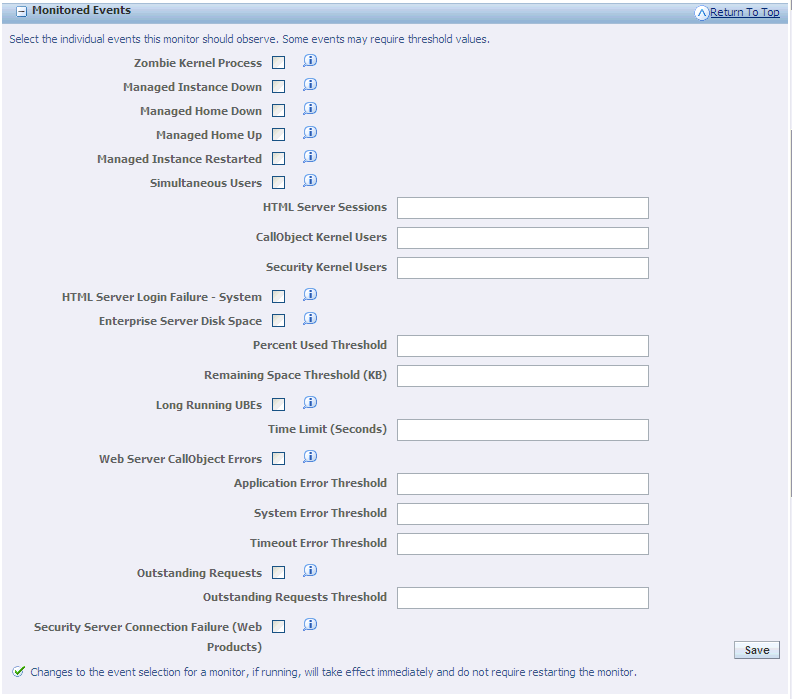
You can select the individual events that a specific monitor should observe that will trigger an e-mail alert.
Examples include:
-
Enterprise server kernel crashes
-
Web user unable to sign in due to system error
-
Security server down
-
Simultaneous users exceeding specified thresholds
-
Low disk space on enterprise server
-
Managed instance down
-
Managed home down
Note:
Some events may require threshold values.To specify the events to monitor:

Events may be dynamically enabled or disabled for a particular monitor.
-
On Monitored Events, select from these fields:
-
Zombie Kernel Process
This event occurs when an enterprise server process (including network, kernel, and runbatch processes) unexpectedly terminates.
-
Managed Instance Down
This event occurs when a matching instance was in the running state on the previous collection but is no longer running.
-
Managed Home Down
This event occurs if the connection between the management console and a connected managed home is lost. This could be because the management agent within the managed home is down, or the network connection was severed.
-
Managed Home Up
This event occurs if when the connection between a managed home and the management console is established.
-
Managed Instance Restarted
This event occurs when a managed instance is stopped and restarted within the last sampling interval. If a server is stopped and restarted but the operation does not complete within the sleep interval of this monitor the notification will be handled as a managed instance down rather than restart.
-
Simultaneous Users
This event is triggered when the specified threshold of users is reached. This event is checked on the timed interval specified for the monitor. You may set thresholds for the number of simultaneous users active in an EnterpriseOne HTML server, connected to a single CallObject kernel on the enterprise server, or connected to a security server kernel on the enterprise server. This notification will be sent the first time the threshold value is met, and each time thereafter when the value is larger than any previously sent notification.
-
HTML Server Sessions
Specifies the threshold when the event will be triggered.
-
CallObject Kernel Users
Specifies the threshold when the event will be triggered.
-
Security Kernel Users
Specifies the threshold when the event will be triggered.
-
HTML Server Login Failure - System
This event occurs when a user cannot sign onto a HTML server due to a system related failure. It does not include login failures caused by incorrect user activity, such as supplying incorrect login credentials.
-
Enterprise Server Disk Space
This event occurs when a physical disk on a monitored enterprise server meets the specified threshold value(s). You may specify the 'Percent Used Threshold', in which an event will be triggered if the usage on the disk/volume reaches or exceeds the specified percentage. An event may also be specified when the disk has less than a specified number of kilobytes available. The enterprise server must be running at the time of collection for this metric to be evaluated.
-
Percent Used Threshold
Specifies the threshold when the event will be triggered.
-
Remaining Space Threshold (KB)
Specifies the threshold when the event will be triggered.
-
Long Running UBEs
Allows you to specify, in seconds, a threshold value for the duration of UBEs. If a UBE takes longer than the specified threshold to complete a notification will be sent.
-
Time Limit (Seconds)
Specifies the threshold when the event will be triggered.
-
Web Server CallObject Errors
This event enables receiving notification whenever a problem occurs while performing a CallObject (business function) request from an EnterpriseOne HTML server to an enterprise server. You may specify a threshold for each of the error types that may occur. Once reached notifications will be sent for the corresponding CallObject error.
-
Application Error Threshold
Specifies the threshold when an event will be triggered.
-
System Error Threshold
Specifies the threshold when the event will be triggered.
-
Timeout Error Threshold
Specifies the threshold when the event will be triggered.
-
Outstanding Requests
This event occurs when a kernel process reaches the supplied threshold value for outstanding request. Outstanding requests are requests that are queued for the kernel but have not yet executed to do current work. The notification will be sent each time outstanding requests are greater than the last sample period and above the specified threshold value.
-
Outstanding Requests Threshold
Specifies the threshold when the event will be triggered.
-
Security Server Connection Failure (Web Products)
This event occurs if a user attempts to sign on to a web product and the configured security server did not successfully respond to the authentication request.
-
-
Click the Save button to save your settings.
Note:
Changes to the event selection for a monitor, if running, will take effect immediately and do not require restarting the monitor.Note:
If input values are used in the enterable fields, the parameter field immediately above the input section must have the check box selected in order for the input values to be applied.22.2.2.4 Notification Hours
You may specify the hours of the day in which e-mail notifications will be sent. If an event occurs outside the configured times the event will still be recorded in the monitor history. An email per event, per threshold, per duration will be sent.
You may have identical monitors assigned to different time frames to notify different people. A monitor may be set up to notify a person during prime hours, and a different identical monitor to notify a different person for non-prime hours.
To specify notification hours, enter start and stop times using the twenty four hour clock. For example 11:33 PM would be specified as 23:33. The day's range is between 00:00 and 23:59.

22.2.2.5 E-Mail Subscriptions
Specified e-mail addresses, including distribution lists, will receive a notification when any of the subscribed events occur. An unlimited amount of e-mail addresses may be added to a monitor.

To add e-mail subscriptions:
-
Enter an email address (or multiple addresses separated with a comma).
-
Click the Add button.
To remove e-mail subscriptions:
-
Select the check box for an email address(es).
-
Click the Remove button.
22.2.3 Available Monitors
Displays each of the monitors. Use the links to modify the configuration of the individual monitor. If the monitor is currently running or has been run since the management console was started you may view the monitor results.
This section describes:

22.2.3.1 Start a Monitor
To start a monitor:
-
Select the check box for a monitor(s).
-
Click the Start button.
22.2.3.2 Stop a Monitor
To stop a monitor:
-
Select the check box for a monitor(s).
-
Click the Stop button.
22.2.3.3 Delete a Monitor
To delete a monitor:
-
Select the check box for a monitor(s).
-
Click the Delete button.
22.2.3.4 Modify the Monitor Configuration
To modify the monitor configuration, click the icon in the Configure column for the monitor.
22.2.3.5 View a Monitor Report
To view a monitor report, click the icon in the View Report column for the monitor. The icon will change if the report has run.
22.2.3.6 Create a Duplicate Monitor
To create a duplicate monitor:
-
Click the icon in the Create Duplicate column for the monitor.
-
Specify a name for the new monitor, by completing the Monitor Name field.

-
Click the Continue button.
-
Complete the Monitor Configuration page.
-
Click the Save button for every pane.
22.2.4 Monitor History
The Monitor History section displays all monitors that are currently or have previously run.
This section describes:

22.2.4.1 Delete Monitor History
To delete monitor history:
-
Select the check box for a monitor(s).
-
Click the Delete button.
22.2.4.2 View the Monitor Start Time
To view a monitor start time look in the Monitor Start Time column for the monitor.
22.2.4.3 View Report
To view a monitor history report:
-
Select the check box for a monitor(s) history.
-
Click the icon in the View Report column.

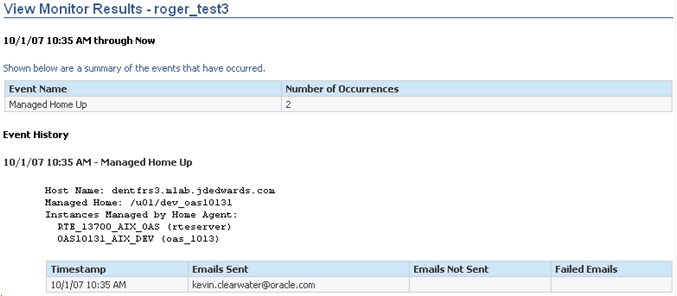
The report provides information for the event and email. The Emails Not Sent field will report the number of emails accumulated outside the Notification Hours designated in the configuration settings for the monitor. The Failed Emails field will report the number of emails not delivered due to any issues with the email system, such as an email server being down.
Note:
Currently running monitors will also appear in the monitor history list. Their history may not be deleted while the monitor is active.