8 User Interface for the Management Console
This chapter describes:
8.1 User Interface Layout
The user interface for the Management Console is comprised of these segments, starting from the top-left most portion of the page:
8.1.1 Select Instance Dropdown

The Select Instance dropdown is available on every Management Console page. It is always located at the top-most portion of the left-hand pane, just above the What do you want to do? list.

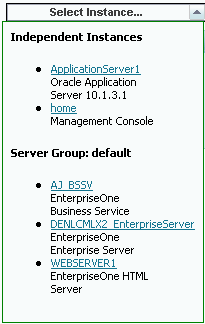
When you click the Select Instance... dropdown, the Management Console displays a list of currently available instances registered with this Management Console. The list is organized by these groups:
-
Independent Instances
These are instances not associated with a server group.
-
Server Group: name
Where name is the name of the server group. For example, default.
Each instance is listed by its name, which is a link to the instance, and a description of the instance. If you click the link for the instance, the Management Console displays the management page of the instance.
8.1.2 Quick Links - What do you want to do?

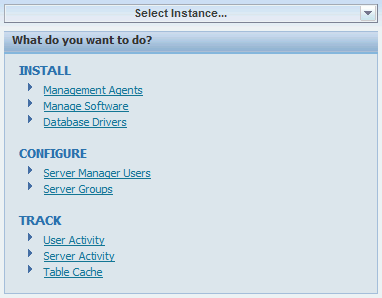
The Management Console displays a section in the left-hand pane of each web page called What do you want to do? that provides easy navigation to the Management Console functions for INSTALL, CONFIGURE, and TRACK:
-
Management Agents
Refer to Chapter 5, "Install a Management Agent" of this guide
-
Managed Software
Refer to Chapter 11, "Managed Software Components" of this guide
-
Database Drivers
Refer to Chapter 12, "Manage JDBC Drivers" of this guide
-
Server Manager Users
Refer to Chapter 10, "Configure Management Console Users" of this guide
-
Server Groups
Refer to Chapter 9, "Configure the Default Server Group Configuration Settings" and Administer Server Groups of this guide
-
User Activity
Refer to "Search for User Resources" of this chapter
-
Server Activity
Refer to Chapter 22, "Monitor JD Edwards EnterpriseOne Servers" of this guide
-
Clear Table Cache (Tools Release 9.1 Update 2)
Refer to Chapter 32, "Clear Table Cache (Tools Release 9.1 Update 2)" of this guide
8.1.3 Views of the Management Console
The user interface for the Management Console supports these views:
8.1.3.1 Management Dashboard
The Management Dashboard is the entry point into the management application. The web page displays the status of all the Management Agents and Managed Instances. This view shows each of the known Managed Homes and the Managed Instances that they contain. Managed Homes and Managed Instances can be accessed by clicking their links.

To choose the Management Dashboard view of the Management Console, on the Home page, use the Select View dropdown to choose Management Dashboard.
Note:
This is the default view whenever you start the Management Console.8.1.3.2 EnterpriseOne Servers By Type
The EnterpriseOne Servers By Type view of the Management Console lists each logical machine within the management domain of the Server Manager for JD Edwards EnterpriseOne. As such, this view also includes the Management Console itself. The complete list in this view includes:
-
JD Edwards EnterpriseOne Management Console
-
JD Edwards EnterpriseOne Enterprise Server
-
JD Edwards EnterpriseOne HTML Server
-
JD Edwards EnterpriseOne Transaction Server
-
JD Edwards EnterpriseOne Collaborative Portal Server
-
JD Edwards EnterpriseOne Business Services Server
To select the EnterpriseOne Servers view of the Management Console:
-
On the Home page, use the Select View dropdown to choose EnterpriseOne Servers By Type.

On the resulting page, the EnterpriseOne servers are organized by types.
-
The grids in this view show the operational status of each installed server and their associated Managed Instances. For any installed servers, you can click on the associated link to Instance Name to work with the instance. The grids lists these items:
-
Instance Name
Identifies the unique name assigned to the Managed Instance at the time it was created or registered.
-
Server Group
Specifies the name of the server group of which the Managed Instance is a member.
-
State
Lists the operational state of the managed instance, where valid values are:
-
Running
-
Stopped
-
Starting
-
Stopping
-
Failed
-
Undetermined
-
-
User Activity
Provides a summary of the current user activity on the instance.
For an Enterprise Server, the display includes the number of active CallObject (kernel business function) user and the number of active security server kernel users.
For an HTML Web Server, the display includes the number of active user sessions.
This screen shot displays an example of the grid for an installed Enterprise Server.

This screen shot displays an example of the grid for an installed HTML Web Server:

-
-
The view also lists server types that are available, but not installed.
This screen shot displays an example of the Management Console if the Enterprise Server is not installed:

8.1.3.3 EnterpriseOne Servers By Group
In Server Manager, you manage servers by grouping similarly purposed servers into logical groupings called server groups. You determine how you want to group servers depending on your particular JD Edwards EnterpriseOne implementation. For example, you may want to put all production servers in one server group and manage development servers in another. Or, you may decide to place servers in separate server groups based on geographical location. How you organize and manage servers in server groups is up to you.
At a minimum, the EnterpriseOne Servers By Group view of the Management Console includes a default server group that you can use to initially manage servers. You can move any server from the default server group to a newly created server group. A server cannot belong to more than one server group, including the default server group.
You can include the following types of servers in a server group:
-
JD Edwards EnterpriseOne Management Console
-
JD Edwards EnterpriseOne Enterprise Server
-
JD Edwards EnterpriseOne HTML Server
-
JD Edwards EnterpriseOne Transaction Server
-
JD Edwards EnterpriseOne Collaborative Portal Server
-
JD Edwards EnterpriseOne Business Services Server
To select the EnterpriseOne Servers By Group view of the Management Console:
-
On the Home page, use the Select View dropdown to select EnterpriseOne Servers by Group.

-
The EnterpriseOne servers are organized by server groups, where every installation will have at least one server group called default. For example:

-
The grids in this view show the operational status of each installed server and their associated Managed Instances. You can click on the link in the Instance Name column to access the instance. The grids lists these items:
-
Instance Name
Identifies the unique name assigned to the Managed Instance at the time is was created or registered.
-
Managed Instance Type
Lists the type of server the Managed Instance represents.
-
State
Lists the operational state of the managed instance, where values are:
-
Running
-
Stopped
-
Starting
-
Stopping
-
Failed
-
Undetermined
-
-
User Activity
Provides a summary of the current user activity on the instance.
For an Enterprise Server, the display includes the number of active CallObject (kernel business function) user and the number of active security server kernel users.
For an HTML Web Server, the display includes the number of active user sessions.
-
-
Start and Stop buttons are available to start and stop individual or multiple servers in a group. (Release 9.1, Update 4).
This screen shot displays an example of the grid for the default server group:

8.1.3.4 Search for User Resources
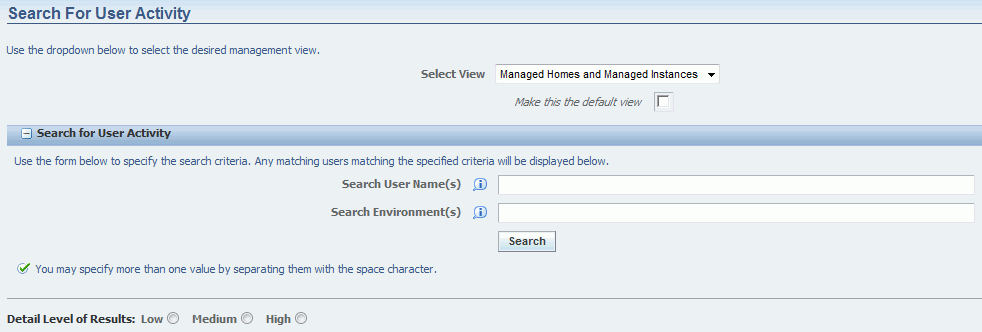
You can use the Search for User Resources selection of the Management Console to view activity sorted by JD Edwards EnterpriseOne users.
To select the Search for User Resources view of the Management Console:
-
On the Home page, use the Select View dropdown to select Search for User Resources.

-
Complete these fields:
-
Search User Name(s)
Enter one or more JD Edwards EnterpriseOne user names to filter the returned results. You should separate multiple names with spaces. Leave this field blank to search for all users.
-
Search Environment(s)
Enter one or more environment names to filter the returned results. Server Manager will only display user resources that are associated with an environment for the environment that you specify. Leave this field blank to search for all environments.
-
Detail Level of Results
Select a radio button for your desired level of results, where the choices are Low, Medium, or High.
-
-
Click the Search button.
8.2 User Interface Productivity Hints
This section describes:
8.2.1 Grid Multiple Item Selection
For any grid displayed by the Management Console, the display includes these two links just above the heading of the grid:
-
Select All
-
Select None

8.2.2 Grid Column Alphanumeric Sorting
For any grid displayed by the Management Console, you can alphanumerically sort the content of a column by clicking on the heading title. The first time you click on a heading, an icon appears indicating the column is sorted in ascending order, as indicated by a downward pointing arrow to the right of the heading text.
If you click the heading title again, the sort toggles to descending, as indicated by an upward point arrow to the right of the heading text. For example:

Note:
The system keeps track of the sort using a browser cookie (Release 9.1, Update 4).8.2.3 State Column Settings - Managed Homes
The state of a Managed Home is indicated by a graphical representation in the State column of the grid display. There are two possible states:
-
Running
A green up arrow indicates the Managed Home is running.

-
Stopped
A red down arrow indicates the Managed Home is stopped.

8.2.4 State Column Settings - Managed Instances
The state of a Managed Instance is indicated by description in State column of the grid display. There are three possible states:
-
Running
-
Stopped
-
Undetermined