| Oracle® Enterprise Manager Cloud Control Getting Started with Oracle Fusion Middleware Management 12c Release 1 (12.1.0.2) Part Number E24215-02 |
|
|
PDF · Mobi · ePub |
| Oracle® Enterprise Manager Cloud Control Getting Started with Oracle Fusion Middleware Management 12c Release 1 (12.1.0.2) Part Number E24215-02 |
|
|
PDF · Mobi · ePub |
This chapter describes how you can use Enterprise Manager to monitor Middleware software.
This chapter covers the following:
To add Middleware related targets (e.g. Oracle Fusion Middleware 11g, Oracle WebLogic Domain, Oracle Application Server 10g, JBoss Application Server) to Enterprise Manager, follow these steps:
After you have added the target, you can view general information about the targets including their status and availability on the Middleware page. You can drill down into each target to get further details like how the target is performing, where it is deployed, the version, location of its home directory, and so on.
You can also view the number of critical, warning, and error alerts generated for the past 24 hours. These alerts indicate that a particular metric condition has been encountered. For example, an alert is triggered when a metric threshold is reached. Using these details, you can drill down to investigate the target and the problem that triggered the alert.
You can monitor the following components using Oracle Enterprise Manager Cloud Control:
Oracle Fusion Middleware Components
Oracle Application Server Components
Non-Oracle Middleware Components
A farm is a collection of components managed by Fusion Middleware Control. It can contain Oracle WebLogic Server domains, one Administration Server, one or more Managed Servers, and the Oracle Fusion Middleware components that are installed, configured, and running in the domain. You can monitor the following Oracle Fusion Middleware components using Enterprise Manager:
Oracle WebLogic Server Domains, Clusters, and Managed Servers: A WebLogic Server domain is a logically related group of WebLogic Server resources that you manage as a unit. A domain includes one or more WebLogic Servers and may also include WebLogic Server clusters. Clusters are groups of WebLogic Servers instances that work together to provide scalability and high-availability for applications. With Oracle Enterprise Manager, you can monitor and manage the farm, domains, clusters, servers, and deployed applications.
Oracle SOA Suite: The Oracle SOA Suite enables services to be created, managed, and orchestrated into SOA composite applications. Composite applications enable you to easily assemble multiple technology components into one SOA composite application. Oracle SOA Suite plugs into heterogeneous infrastructures and enables enterprises to incrementally adopt SOA. You can:
Automatically discover and model SOA components such as BPEL Process Manager, Oracle Service Bus, Service Engines etc.
Monitor the health and performance of the SOA components.
Trace the flow of an instance across all SOA Infrastructure applications.
Create systems, services, and aggregate services.
Oracle WebCenter: The Oracle WebCenter is an integrated set of components with which you can create social applications, enterprise portals, collaborative communities, and composite applications, built on a standards-based, service-oriented architecture. It combines dynamic user interface technologies with which to develop rich internet applications, the flexibility and power of an integrated, multichannel portal framework, and a set of horizontal Enterprise 2.0 capabilities delivered as services that provide content, collaboration, presence, and social networking capabilities. Based on these components, Oracle WebCenter also provides an out-of-the-box, enterprise-ready customizable application, WebCenter Spaces, with a configurable work environment that enables individuals and groups to work and collaborate more effectively.
Oracle Web Tier: This consists of:
Oracle HTTP Server: Oracle HTTP Server (OHS) is the underlying deployment platform for all programming languages and technologies that Oracle Fusion Middleware supports. It provides a Web listener and the framework for hosting static and dynamic pages and applications over the Web. Based on the proven technology of the Apache 2.2.10 infrastructure, OHS includes significant enhancements that facilitate load balancing, administration, and configuration. It also includes a number of enhanced modules, or mods, which are extensions to the HTTP server that extend its functionality for other enterprise applications and services. You can:
Automatically discover and monitor Oracle HTTP Servers running within the application servers.
View a list of metrics to gauge the server performance and virtual host performance.
View the top URLs being accessed.
Perform the enterprise configuration management tasks like viewing, comparing, and searching configuration information.
Oracle Web Cache: Oracle Web Cache is a content-aware server accelerator, or reverse proxy, for the Web tier that improves the performance, scalability, and availability of Web sites that run on any Web server or application server, such as Oracle HTTP Server and Oracle WebLogic Server. Oracle Web Cache is the primary caching mechanism provided with Oracle Fusion Middleware. Caching improves the performance, scalability, and availability of Web sites that run on Oracle Fusion Middleware by storing frequently accessed URLs in memory. You can:
Automatically discover and monitor OracleAS Web Cache instances running within application servers.
View the metrics associated with this target to analyze their performance.
Perform enterprise configuration tasks like viewing, comparing, and searching configuration information.
Oracle Identity Management: This is an enterprise identity management system that automatically manages users' access privileges within the resources of an enterprise. The architecture of Oracle Identity Management works with the most demanding business requirements without requiring changes to existing infrastructure, policies, or procedures. It provides a shared infrastructure for all Oracle applications. It also provides services and interfaces that facilitate third-party enterprise application development. These interfaces are useful for application developers who need to incorporate identity management into their applications.
Oracle Portal: This is a Web-based tool for building and deploying e-business portals. It provides a secure, manageable environment for accessing and interacting with enterprise software services and information resources. A portal page makes data from multiple sources accessible from a single location.
Oracle Forms Services is a middle-tier application framework for deploying complex, transactional forms applications to a network such as an Intranet or the Internet. With Oracle Forms Services, business application developers can quickly build comprehensive Java client applications that are optimized for the Internet without writing any Java code, and that meet (and exceed) the requirements of professional user communities. These Java client applications are Web-deployed applications available on demand for rapid processing of large amounts of data and rapid completion of complex calculations, analysis, and transactions.
Oracle Coherence is a component of Oracle Fusion Middleware that enables organizations to predictably scale mission-critical applications by providing fast and reliable access to frequently used data. By automatically and dynamically partitioning data in memory across multiple servers, Oracle Coherence enables continuous data availability and transactional integrity, even in the event of a server failure. As a shared infrastructure, Oracle Coherence combines data locality with local processing power to perform real-time data analysis, in-memory grid computations, and parallel transaction and event processing. Oracle Coherence comes in three editions. You can:
Discover and manage a Coherence cluster and its various entities.
Monitor and configure various components such as nodes, caches, services, connections, and connection manager instances of a Coherence cluster.
Deploy and install a Coherence node based on the Provisioning Advisory framework.
Oracle Business Intelligence is a complete, integrated solution that addresses business intelligence requirements. Oracle Business Intelligence includes Oracle Business Intelligence Reporting and Publishing, Oracle Business Intelligence Discoverer, and Oracle Business Intelligence Publisher. You can:
Manually discover Oracle BI Suite EE targets, and monitor their overall health.
Diagnose, notify, and correct performance and availability problems in Oracle BI Suite EE targets.
Access current and historical performance information using graphs and reports.
Perform enterprise configuration management tasks like viewing, comparing, and searching configuration information.
Oracle Universal Content Management System provides a unified application for several different kinds of content management. It is an enterprise content management platform that enables you to leverage document management, Web content management, digital asset management, and records retention functionality to build and complement your business applications. Building a strategic enterprise content management infrastructure for content and applications helps you to reduce costs, easily share content across the enterprise, minimize risk, automate expensive, time-intensive and manual processes, and consolidate multiple Web sites onto a single platform for centralized management. Through user-friendly interfaces, roles-based authentication and security models, Oracle Universal Content Management empowers users throughout the enterprise to view, collaborate on or retire content, ensuring that all accessible distributed or published information is secure, accurate and up-to-date.
You can monitor Oracle Application Server 10g components like Oracle Application Server Farms, Oracle Application Server Clusters, Oracle Application Servers, OC4J, Oracle HTTP Servers, Oracle Web Cache, Oracle Portal, Oracle Wireless, Oracle Forms Services, Oracle Reports Services, Oracle Business Intelligence, and Oracle Identity Management.
In addition to monitoring Oracle Middleware components, Enterprise Manager can also be used to monitor non-Oracle Middleware software. The third-party Middleware software that can be monitored includes the following:
WebSphere Application Server
WebSphere MQ
JBoss Application Server
Apache Tomcat
Apache HTTP Server
Microsoft Exchange Server
Microsoft Internet Information Services
Microsoft Active Directory
Microsoft Commerce Server
Microsoft BizTalk Server
Microsoft Internet Security and Acceleration
Microsoft .NET Framework
Enterprise Manager organizes a wide variety of performance data and administrative functions into distinct, Web-based home pages for the farm, domain, servers, components, and applications.
Enterprise Manager provides centralized monitoring across domains, configuration management, provisioning, real time and historical performance analysis. You need to drill down to Oracle Fusion Middleware Control to perform administrative tasks and manage components in your farm.
The Home pages make it easy to locate the most important monitoring data and the most commonly used administrative functions—all from your Web browser.
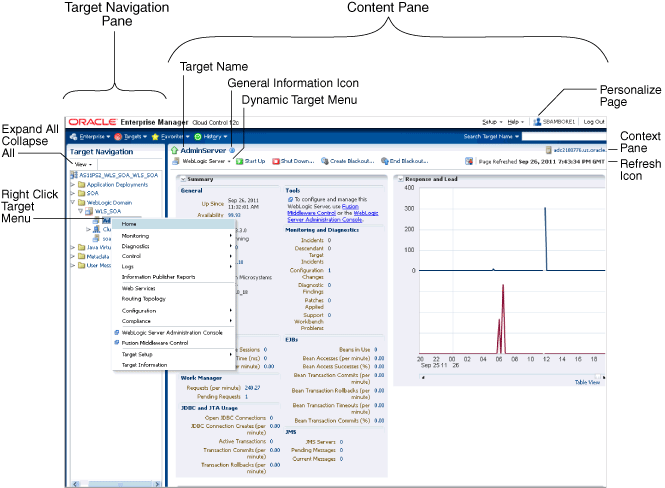
When you login into Enterprise Manager and select a Middleware target, the Home page for the target is displayed. For example, when you click on a WebLogic Server target in the Middleware page, the following screen is displayed.
This figure shows the target navigation pane on the left and the content page on the right. From the target navigation pane, you can expand the tree and select a component or an application. When you select a target, the target's home page is displayed in the content pane and that target's menu is displayed at the top of the page, in the context pane. You can also view the menu for a target by right-clicking the target in the navigation pane.
In the preceding figure, the following items are called out:
Target Navigation Pane lists all of the targets in a navigation tree
Content Pane shows the current page for the target. When you first select a target, that target's home page is displayed.
Dynamic Target Menu provides a list of operations that you can perform on the currently selected target. The menu that is displayed depends on the target you select. The menu for a specific target contains the same operations as those in the Right-Click Target Menu.
Right-Click Target Menu provides a list of operations that you can perform on the currently selected target. The menu is displayed when you right-click the target name in the target navigation pane. In the figure, even though the WebLogic Server is selected and its home page is displayed, the right-click target menu displays the operations for the selected target.
Target Name is the name of the currently selected target.
Context Pane provides the host name, the time of the last page refresh, the Refresh icon, and the Personalize Page icon.
View: You can select options to Expand All / Collapse All, Scroll First, and Scroll Last in the navigation tree.
Refresh icon indicates when the page is being refreshed. Click it to refresh a page with new data. (Refreshing the browser window refreshes the page but does not retrieve new data.)
From the Home page, you can also access the Fusion Middleware Control and WebLogic Server Administration Console by clicking on the appropriate link or selecting the appropriate menu item on the page.
Enterprise Manager provides a set of pre-defined performance metrics for each Middleware target. These metrics are available for domains, cluster, server, applications, web services, resources etc. The metric data is collected and stored in the Management Repository. For more details on the pre-defined metrics, see the Oracle Fusion Middleware Metric Reference Guide.
For example, Enterprise Manager can automatically monitor:
The CPU or memory consumption of the application server, including detailed monitoring of individual Java Virtual Machines (JVMs) being run by Oracle WebLogic servers.
Java EE application responsiveness from the application down through individual servlets and Enterprise JavaBeans (EJBs)
Oracle HTTP Server session volumes, connection duration, and error rates
Top servlets based on number of requests, maximum processing time, and highest average processing time
The performance metrics provide details about the metric as a current real time value (30 seconds, 1 minute, or 5 minutes) or a previous value (past 24 hours, 7 days, or 31 days). The historical information is displayed as graphs and a table. By using graphs, you can easily watch for trends, and by using tables, you can examine details of past metric severity history. The out-of-metrics can be viewed from the performance summary pages as shown below:
You can change which charts are displayed on the performance page and then save the changes on a per-user, per-target-type basis. You can also save multiple customized versions of a performance page, giving each version a name. This will save time by allowing quick access to previously created version of the page. The Performance Summary feature allows you to create named chart views. The generic performance page is always shown in the context of one primary target. However, the performance of that target may be dependent on, or affect the performance of other targets. To explore these relationships you can chart metrics for multiple related targets on one performance page. The Performance Summary feature allows you to chart metrics for multiple related targets.
Enterprise Manager allows you to analyze historic metric data and perform trend analysis. In Fusion Middleware Control, you cannot analyze historical metric data and the real-time analysis is limited to a single domain. But in Enterprise Manager, the metrics are collected and stored in the Management Repository, so you can analyze the data well after the situation has changed. For example, you can use historical data and diagnostic reports to research an application performance problem that occurred days or even weeks ago.
You can even provide a customized time period for which the data should be retrieved from the Management Repository. You can customize the time period for:
Pre-defined range of the last 24 hours, last 7 days, or last 31 days
Customized range of any number of days, weeks, months, or years
Any start date and end date (such that the duration is not greater than 99 years)
Note:
You can analyze historical metric data with Enterprise Manager only. You cannot use Fusion Middleware Control to analyze historic performance.Metric snapshots are named snapshots of a target's past performance. You can use metric snapshots to calculate thresholds based on deviations from this past performance. Thresholds are boundary values against which monitored metric values are compared. You can specify a threshold such that, when a monitored metric value crosses that threshold, an alert is generated. You can get critical alerts when a monitored metric has crossed its critical threshold or warning alerts when a monitored metric has crossed its warning threshold.
Enterprise Manager provides a comprehensive set of features that facilitates automated monitoring and generation of alerts. You can gather and evaluate diagnostic information for targets distributed across the enterprise, and an extensive array of Middleware performance metrics are automatically monitored against predefined thresholds. By selecting a metric, you can determine whether the thresholds have been defined for a particular metric. These thresholds are used as a mechanism to generate alerts. These alerts in turn are used to notify you whether a target is up or down, the response time is slow, and so on. Thus, you can monitor their overall performance.
You can set up corrective actions to automatically resolve an alert condition. These corrective actions ensure that routine responses to alerts are automatically executed, thereby saving you time and ensuring that problems are dealt with before they noticeably impact the users.
You can also use monitoring templates to simplify the task of standardizing monitoring settings across your enterprise. You can specify the monitoring settings once and apply them to all Oracle Fusion Middleware targets. A Monitoring template defines all the parameters you would normally set to monitor Middleware target, such as:
Target type to which the template applies
Metrics (including user-defined metrics), thresholds, metric collection schedules, and corrective actions
When a change is made to a template, you can reapply the template across the affected targets in order to propagate the new changes. You can reapply monitoring templates as often as needed.
Enterprise Manager comes with a bundle of performance and health metrics that enable automated monitoring of application targets in your environment. When a metric reaches the predefined warning or critical threshold, an alert is generated and the administrator is notified.
However, there are occasions when you want to perform maintenance work on your Middleware targets, and not want any alerts to be generated while you are bringing them down. In this case, you can schedule a blackout and suspend monitoring of the Middleware targets.
Blackouts allow you to suspend any data collection activity on one or more monitored targets, thus allowing you to perform scheduled maintenance on targets. If you continue monitoring during these periods, the collected data will show trends and other monitoring information that are not the result of normal day-to-day operations. To get a more accurate, long-term picture of a target's performance, you can use blackouts to exclude these special-case situations from data analysis. Enterprise Manager allows you to define new blackouts; view the status of existing blackouts; and edit, stop, and delete blackouts that are not required.
Many administrators often require custom logic to be written to check for conditions specific to their application environments. Enterprise Manager allows integration of application instrumentation in the Enterprise Manager event monitoring infrastructure. If application developers expose application instrumentation using standards like JMX or Web Services operations, then you can build management plug-ins for the instrumentation using easy-to-use command line tools, and leverage the Enterprise Manager event monitoring system to monitor it. You do not have to edit any XML files or write any integration code to integrate such instrumentation. Follow these procedures to integrate application-defined instrumentation:
Use Command Line Interfaces that analyze MBean interfaces for JMX and WSDL for Web Services and create management plug-ins
Import Management Plug-in Archive in Enterprise Manager
Deploy Management Plug-in to Management Agents
Create Target-type instances for the target types defined in Management Plug-in Archive
Leverage the Enterprise Manager event monitoring system including monitoring templates, corrective actions, historical and real time metric views, alerts, customization of notification rules, and methods on events generated from application instrumentation metrics.
Administrators are able to add performance metrics beyond those available out-of-box for JMX-instrumented applications deployed on Oracle WebLogic Server. Administrators can additionally monitor JMX-enabled applications by defining new target type that can be monitored via management plug-ins, and then use a command line tool emjmxcli to automate the generation of the target metadata and collection files.All JMX-enabled applications deployed to the WebLogic Server can be consolidated and monitored by a single management tool, Enterprise Manager.
Request Monitoring provides end-to-end visibility into requests and helps localize end-user performance problems based on the deployment model. You can monitor, understand, and visualize how servers interact with each other to deliver business end-user services requests. You can trace important end-user requests from the client to the service endpoint across all the servers and applications associated with each transaction. The trace data is used to model the call-path for these requests where call-paths represent the inter-server relationship and performance metrics for these requests. You can only monitor synchronous transactions running on WebLogic servers. With Request Monitoring, you can:
Trace end-user transactions and capture the complete call-path of important requests.
Reduce problem localization by diagnosing poorly performing requests and identifying the servers whose behavior (service time) deviates most from the norm.
Reduce fault discovery time and set performance level objectives on request response times.
Reduce fault-reason identification time by allowing the user to launch into Oracle Enterprise Manager JVM Diagnostics feature. This allows performance diagnostics to be done within the context of the problem experienced as well as historical statistics of the system when it was behaving normally.
A request is a server entry-point that can be invoked by a Web Browser or an application. A group of request instances related to each other by some common attributes is known as a request. A collection of requests is known as a transaction group. A transaction can belong to one or more transaction groups. Violations occur when the critical and warning thresholds are exceeded. The administrator can mark one or more important requests as key requests. Alerts are generated for key requests only.
You can define requests that need to be monitored and tracked and group them for reporting purposes. A set of pre-defined requests and request groups are provided by default. You can create a new request, edit or delete an existing transaction. To define a request:
From the Targets menu, select Middleware.
From the Middleware Features menu, select Request Monitoring.
Click Request Performance to view the performance of the request during a specific time period.
Click on a request to drill down to the Performance tab. The performance charts show the volume of requests over a time period and the average response time of all requests during this period. Two performance charts are displayed for the current and the comparison period. The charts provide a historic response time analysis of the request over the selected period of time.
Click on the Topology tab. The following screen is displayed.
The topology chart shows the aggregate server level call paths of the request. The chart shows the calls made between the clients and the clusters or servers. Click on the icon on a cluster to view all the servers that are part of the cluster. Place the cursor on a cluster or server to view the following details:
Response Time: The average response time taken by the server to process all the calls for the selected period.
Count: The total number of calls that have been made to the server.
Current Alerts: These alerts show the status of the server or cluster and indicate whether it is up or down, blacked out, or unreachable.
Click on the Server Usage tab. The following screen is displayed.
These charts show the workload distribution for the selected request in each server. The charts display the average of the percentage contribution of each server or cluster in the selected time period. You can see the workload distribution for good requests, requests that have violated the warning thresholds, and requests that have violated the critical thresholds.
This section describes the methods and tools used to diagnose performance problems. You can:
View the list of most active Servlets and JSPs and identify the ones that are causing the bottleneck.
Analyze Java EE and SOA applications using Application Dependency and Performance.
Use Java Diagnostics to diagnose performance problems in production.
When you are troubleshooting performance problems, it can be helpful to know which servlets or JSPs are the most active. By viewing the Most Requested section on the WebLogic Server Home page, you can identify the most active Java servlets, JSPs, Web Services, or Java EE Services running on the WebLogic Server instance.
When you receive an alert notification, Enterprise Manager makes it easy for you to investigate the problem and take corrective actions wherever required. For example, notification of excessive CPU consumption by WebLogic Server may lead to investigation of the applications running on that instance. By using the Servlets and JSPs tab in the Most Requested section of the WebLogic Server Home page, you can quickly identify the highest volume or least responsive application. You can then drill down and diagnose application's servlets, Java Server Pages (JSPs), or EJBs to identify the bottleneck.
The Middleware Diagnostics Advisor analyzes the entire stack and provides diagnostic findings by identifying the root cause of a problem. It correlates and analyzes the input and offers advice on how to resolve the problem. For example, it can help you identify that slow SQL statements or a JDBC connection pool is causing a performance bottleneck.
You can view the diagnostic findings for one or more servers in a WebLogic Domain if the Middleware Diagnostics Advisor has been enabled.
To view the diagnostic findings, navigate to the Home page of the WebLogic Domain and from the WebLogic Domain menu, select Diagnostics, then select Middleware Diagnostics Advisor. The Performance Findings chart shows a window in time for the last analysis period that contains one or more findings. For details on enabling the Middleware Diagnostics Advisor and viewing the performance findings, see the Enterprise Manager Online Help.
A diagnostic snapshot consists of all the necessary data to diagnose an issue. The actual diagnostic snapshot data depends on what targets are included in generating the diagnostic snapshot. It also provides a collective snapshot of both JVM and WebLogic Server diagnostics and log data that can be exported or imported into other Cloud Control systems for analysis at a later date. This allows administrators to determine the root cause of problems and ensure that they do not occur again. These snapshots supplement the Fusion Middleware Support Workbench feature.
A diagnostic snapshot can be generated in the context of an Enterprise Manager target such as a Fusion Middleware Farm. If the diagnostic snapshot needs to be created in the context of multiple farms, then this can be done by generating the diagnostic snapshot in the context of a group target that includes multiple Fusion Middleware farms, or you can begin from one Fusion Middleware farm and subsequently add targets from other Fusion Middleware Farms.When generating the diagnostic snapshot, you can name the diagnostic snapshot, select the targets that should be used for generating the diagnostic snapshot, select the duration during which the data will be collected for the snapshot and also select an option to either import the generated diagnostic snapshot data into the same Enterprise Manager instance or export the generated diagnostic snapshot data into single or multiple files that can then be imported back into another Enterprise Manager instance (or the same Enterprise Manager instance) later.
Enterprise Manager allows you to monitor multiple domains and provides configuration management, diagnostics, automation, and historical performance analysis. From Enterprise Manager, you can drill down to Oracle Fusion Middleware Control or Oracle WebLogic Administration Console to monitor and administer your Oracle Fusion Middleware environment
Oracle Fusion Middleware Control: Fusion Middleware Control is a Web browser-based, graphical user interface that you can use to monitor and administer a farm. Fusion Middleware Control organizes a wide variety of performance data and administrative functions into distinct, Web-based home pages for the farm, domain, servers, components, and applications. With Fusion Middleware Control, you can perform various tasks like managing the SOA environment, deploying ADF applications, managing Fusion Middleware components, etc.
Oracle WebLogic Server Administration Console: Oracle WebLogic Server Administration Console is a Web browser-based, graphical user interface that you use to manage a WebLogic Server domain. It is accessible from any supported Web browser with network access to the Administration Server. With the WebLogic Server Administration Console, you can perform various tasks like managing the WebLogic Server, managing data sources, JMS resources, etc.
Enterprise Manager allows you to perform process control tasks such as starting, stopping, or restarting Middleware targets. You can perform these tasks by selecting the Control option in the menu from the Home page of a target. You can also schedule a job to perform these operations. For example, for a WebLogic Server Domain, you can create a job to automatically start, stop, or restart the servers in the domain. You can also view details about the jobs that are scheduled, running, suspended, or the ones that have a problem.
Enterprise Manager Cloud Control offers lifecycle management solutions that help you meet all lifecycle management challenges easily by automating time-consuming tasks related to discovery, initial provisioning and cloning, patching, configuration management, ongoing change management, and compliance management.
Enterprise Manager provides a suite of configuration management functions that can be performed on Middleware targets.
Oracle Management Agent collects configuration information about Oracle Fusion Middleware targets from their respective configuration files, and communicates this information over HTTP/HTTPS to Oracle Management Service, which stores it in the Management Repository. This information is periodically collected and updated while maintaining the audit of changes. The Enterprise Manager configuration management capabilities efficiently guide the users to desired configuration data in a particular component.
You can compare these configuration details and view the differences and similarities between the two instances of a Middleware target. You have the flexibility to compare two last collected configurations or two saved configuration files. You can also compare one configuration with multiple configurations or one configuration in the Management Repository with a saved configuration file.
You can also compare configurations by using the default comparison templates. A comparison template is associated with a specific target type that determines the configuration item type and property that is to be compared. A template can specify rules or expressions that enable you parse comparison data and fine-tune comparisons. For example, you can specify rules that indicate which differences must trigger an alert and which differences must be ignored when the configuration is compared.
Using Enterprise Manager, you can search configurations across Middleware targets and find configuration anomalies - whether they are a mismatch of an install/patch version of Oracle Fusion Middleware software, or they are a mismatch of the software configuration data. You can perform more intelligent searches to identify all the components hosting a particular application or other resources.
In addition, for BPEL Process Manager targets, you can view the BPEL Processes, its different versions, and the suitcase files associated with each version. You can also compare the BPEL Process suitcase files of different versions and track the changes that were made to a version. shows you how the versions can be selected and compared. This allows you to identify the cause for improved or deteriorated performance due to a change in the BPEL Process suitcase file.
Enterprise Manager Cloud Control offers the following compliance management solutions:
The compliance results capability enables you to evaluate the compliance of Middleware targets and systems as they relate to your business best practices for configuration, security, and storage. In addition, compliance results provide advice of how to change configuration to bring your Middleware targets and systems into compliance.
Using the compliance library, you can define, customize, and manage:
Compliance frameworks
Compliance standards
Compliance standard rules
By using these self-defined entities, you can test your environment against the criteria defined for your company or regulatory bodies.
Patching is one of the critical phases of the software lifecycle that helps you maintain the software over a period of time and keep it updated with bug fixes and latest features offered by the software vendor.However, in today's world, with numerous software deployments across your enterprise, patching becomes very complex and virtually impossible to manage. Considering these challenges, Enterprise Manager Cloud Control provides an integrated My Oracle Support Patches and Updates functionality that not only simplifies the patch operation but also offers timely and easy access to patch and support information during the patch planning phase. This helps you utilize the wealth of information from My Oracle Support to implement the best possible patch rollout for your organization.Enterprise Manager Cloud Control introduces a new concept called Patch Plans that enables you to create a collection of patches you want to apply to one or more targets. Each target can have a separate group of patches. In addition, you can save the deployment options of a patch plan as a patch template, and have new patch plans created out of the patch template.
Rather than spend resources on manually installing and configuring Oracle Fusion Middleware software, administrators would rather spend time and money on more strategic initiatives. To help achieve this, Enterprise Manager has automated common provisioning operations such as cloning Oracle SOA Suite 12c and scaling out an Oracle WebLogic Domain. Making such critical datacenter operations easy, efficient and scalable results in lower operational risk and lower cost of ownership. To access these provisioning operations, navigate to the Patching and Provisioning page in Enterprise Manager and click Middleware Provisioning and select either of the following:
Fusion Middleware Provisioning: You can automate the cloning of WebLogic Domains and / or Middleware Homes either from a reference installation or from a profile present in the software library.
Fusion Middleware Domain Scale Up: You can automate the scaling up or scaling out of a domain or cluster by adding a new managed server to an existing cluster or by cloning a managed server.
For more details on using these procedures, see the Enterprise Manager Lifecycle Management Guide.
Typically, creating a new environment to support SOA applications entails several manual, error prone installation and configuration steps. With Oracle Enterprise Manager this can be accomplished with very little effort and time via a predefined, customizable deployment procedure. This deployment procedure clones an existing SOA Suite environment to a new set of hardware per a hierarchical series of steps. These predefined steps can be edited or disabled and new steps or custom scripts can be added to the deployment procedure to satisfy unique business needs.
The deployment procedure also supports secure host authentication using super user do (sudo) or pluggable authentication modules (PAM). While running the deployment procedure, administrators can specify configuration settings such as the domain name, credentials for the administration console, port values, and JDBC data resources. After the procedure completes, the newly created SOA environment is discovered and automatically added to the console for centralized management and monitoring.
To address growing business demands, modern data centers must augment and relocate resources quickly. Using Oracle Enterprise Manager, administrators can rapidly scale out a WebLogic Domain and Cluster with additional managed servers to accommodate an increase in application load.
You can deploy, undeploy, and redeploy Java EE applications (.war and .ear files) on a WebLogic Server. You can create a Java EE Application component in the Software Library and deploy multiple versions of an application, or roll-back to a previous version.
Enterprise Manager allows you to create infrastructure services for Middleware targets such as Oracle BPEL Process Manager targets, Oracle Service Bus targets and Oracle SOA Composite and SOA Infrastructure instances.
An infrastructure service is a dependency service that is created to identify the infrastructure components on which the Middleware target depends. Here, the infrastructure components refer to hosts, databases, application servers, and so on that work together to host the Middleware target.
You can either create an infrastructure service with a new system or an existing system, or simply refresh an existing infrastructure service, if there is already one existing. By creating infrastructure services and systems, you can better manage your Middleware targets and also the components on which the Middleware targets depend.
For example, once you create an infrastructure service for an Oracle SOA Infrastructure target, Enterprise Manager allows you to create an aggregate service for every process within that SOA Infrastructure target. An aggregate service is a logical grouping of services, in this case, infrastructure services and availability services. Aggregate Services give you a bird's-eye view of the services that have been created for the SOA Infrastructure target and helps you monitor their availability, performance, and usage. Service availability can be composed of both metrics on the underlying target and service test results from period synthetic transaction execution.
You can define service level (measure of service quality) for a service. A service level is defined as the percentage of time during business hours a service meets specified availability, performance and business criteria.
A Service Level specifies the percentage of time a service meets the performance and availability criteria as defined in the Service Level Rule. By default, a service is expected to meet the specified criteria 85% of the time during defined business hours. You may raise or lower this percentage level according to service expectations. A service level measures service quality using two parameters: Expected and Actual Service Levels.
Expected Service Level: A Service Level specifies the percentage of time a service meets the performance and availability criteria as defined in the Service Level Rule. By default, a service is expected to meet the specified criteria 85% of the time during defined business hours. You may raise or lower this percentage level according to service expectations.
Actual Service Level: The Actual Service Level defines the baseline criteria used to define service quality.
You can use Enterprise Manager job system to schedule tasks you want to automate. You can schedule a job for a target by selecting the Control menu option on the Home page. For example, for an Oracle WebLogic Server Domain, you can create a job to automatically start, stop, or restart the servers in the domain. You can view details about the jobs that are scheduled, running, suspended, or the ones that have a problem. You can also use jobs to automate the execution of the WLST (WebLogic Scripting Tool) scripts.
Oracle Application Server components generate log files containing messages that record all types of events, including startup and shutdown information, errors, warning messages, access information on HTTP requests, and additional information.
However, the information recorded in log files is voluminous, thus making it difficult to track what update was made at what time. Also because of the huge quantity of information updated periodically, the log files grow in size and occupy more space on the system over a period of time. The only way to manage these log files is to manually archive the contents to another file and store them in a different location.
Considering these impediments, Enterprise Manager has been enhanced with a log rotation feature that helps you manage the logs of Oracle Application Server components more effectively. In particular, you can use Enterprise Manager to:
Schedule a job that automatically rotates a log at the scheduled date and time
Manage space on your system by storing the rotated log files in a different directory
Enterprise Manager allows you to view the logs of a particular Oracle Application Server component type and select the ones that need to be rotated. Note that a log rotation job can also be part of a multi-task job.
When a log rotation job is executed, Enterprise Manager automatically stops the component whose logs have to be rotated. After it is stopped, the content from its existing log file is moved to another file that is distinguished with the timestamp when it was actually rotated. The original log file is kept empty for new log details to be populated. Once this is done, Enterprise Manager restarts the component.
Note:
The log rotation feature cannot be used with the WebLogic Server.Enterprise Manager provides a Topology Viewer which is a graphical representation of routing relationships across targets, components and elements. You can easily determine how requests are routed across components. For example, you can see how requests are routed from Oracle Web Cache, to Oracle HTTP Server, to a Managed Server, to a data source.
The Topology Viewer provides the basic navigation applications, such as zoom, pan, and fit-to-contents. You can change the source of data being viewed, the layout mode, and the flow direction between objects. Filters allow you to alter global properties of the topology diagram, such as the visibility of link labels or altering the link style. It enables you to easily monitor your environment. You can see which entities are up and which are down. You can also print the topology or save it to a .gif file. For more details, see the Enterprise Manager Online Help.
Enterprise Manager Support Workbench enables you to investigate, report, and, in some cases, repair problems (critical errors). You can gather first-failure diagnostic data, obtain a support request number, and upload diagnostic data to Oracle Support. The Support Workbench also recommends and provides easy access to Oracle advisors that help you repair SQL-related problems, data corruption problems, and more. You can use Support Workbench within Fusion Applications to:
View a Fusion Aggregated Diagnostic Summary: Fusion applications are deployed across multiple systems, and incidents are therefore recorded in multiple Automatic Diagnostic Repository homes. You can get a quick summary of diagnostic data across all targets and Automatic Diagnostic Repository homes aggregated by the instance, product family, or cluster application.
Execute Tests to Diagnose a Problem: You can link to Oracle Application Diagnostics Testing for a given Fusion Application, where you can execute additional tests to help diagnose the problem.
Create a Package and Upload it to Oracle Support: You can create a package, add additional diagnostics and files, upload the package to Oracle Support, and then create a Service Request.
Note:
You need to discover and promote the Fusion Database targets before you can use Enterprise Manager Support Workbench for the Fusion Repository target.
|
Copyright © 2011, 2012, Oracle and/or its affiliates. All rights reserved. Legal Notices |
|