Understanding the Trade Analysis Dashboard
Introduction to the Trade Analysis Dashboard
Demantra Predict Trade Planning (PTP) allows users to create and track promotions and provides reporting capabilities. Through the integration of PTP and APCC, you can:
-
Publish PTP-APCC Measures Workflows
-
Promotion entities available in APCC
-
Analyze data in the Trade Analyst Dashboard
-
Analyze and report on upcoming promotions as well as view past performance. This includes viewing promotion data by tactic, promotion, retailer or product.
The Publish PTP-APCC measures workflows publish aggregate and detailed measures to APCC including:
-
Plan measures at the aggregate level, visible in the RT S&OP dashboard
-
Promotion measures at a detailed level, visible in the Trade Analyst dashboard
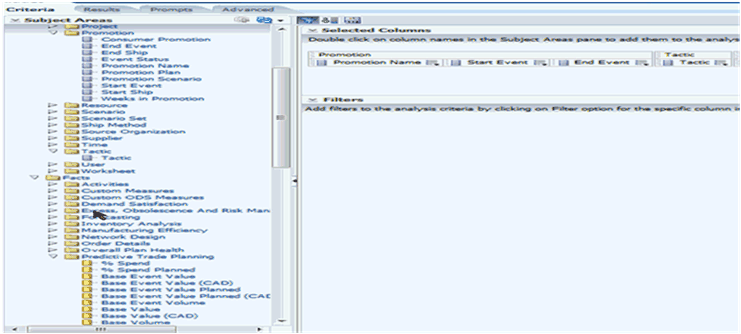
On the APCC side of the integration from the Sales and Operation Planning dashboard, the S&OP analyst creates custom reports and graphs, based on the promotion measure that are imported from PTP. Use the Analysis menu choice in the Sales and Operations Planning Dashboard to access the promotion dimensions and measures.
Using the Trade Analyst Dashboard
Detail promotion data measures are available in the Trade Analyst Dashboard, using the Trade Planner responsibility.
To access the Trade Analyst Dashboard:
-
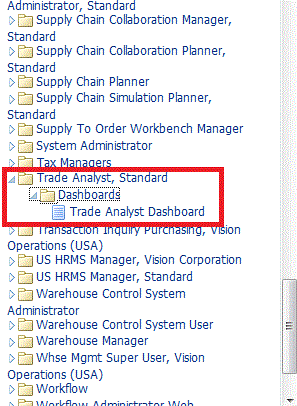
Click Trade Analyst, Standard. This choice is near the bottom of your choices.
-
Click the Dashboards folder, then click Trade Analyst Dashboard.
The Trade Analyst dashboard opens.

The Trade Analyst Dashboard has six promotion analysis tabs plus a glossary. The tabs are organized to provide a specific type of information. You can select Baseline Plan, Retailer, Category, Promotion Group, and Time Periods. Each tab provides access to two to five reports and/or graphs. The tabs and the reports and graphs you can access from that tab are listed in the table below.
| Tab | Available Graphs and Reports |
| Performance Overview |
|
| Promotion Effectiveness |
|
| Top/Bottom Performers |
|
| Promotion Detail |
|
| Lift Decomposition |
|
| Plan Comparison |
|
Publishing from PTP to APCC
There are two workflows for published the detail and aggregate promotion measures. The process is similar to the Demantra Publish S&OP-APCC Measures. There are two branches:
-
Plan measures at aggregate level - PTP-APCC Aggregate Measures Workflow
-
All promotion measures at detail level - PTP-APCC Measures Workflow
The promotion flow is:
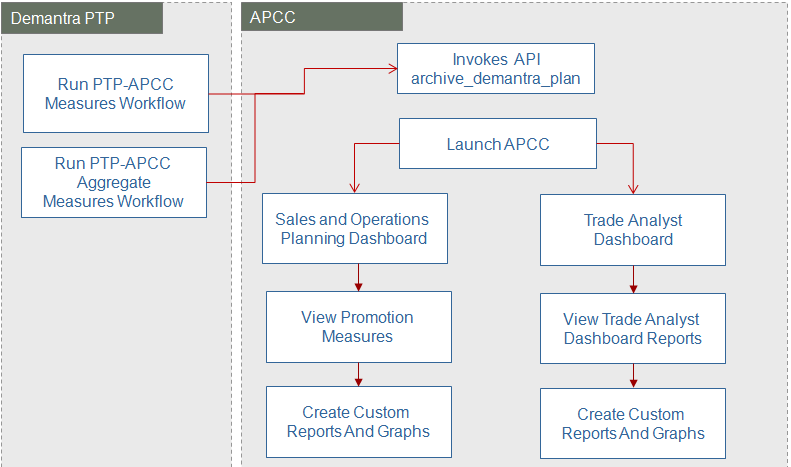
The process of publishing starts by running the PTP-APCC Measures Workflow. From there, you go to either the Sales and Operations Planning Dashboard or the Trade Analyst Dashboard. If you are in S&OP, view the Promotion Measures and Dimensions using the Analysis menu choice. If you are in the Trade Analyst dashboard, view the Trade Analyst Dashboard reports. You create custom reports and custom graphs from both dashboards.
The dimensions and hierarchies in APCC are:
-
Promotion: Promotion Plan, Promotion
-
Promotion: Promotion Scenario Promotion
-
Item: Promotion Group, then Item
-
Tactic
-
Customer: Customer, Retailer
The promotion measures that are visible in the S&OP Analyst dashboard are:
-
Base Volume
-
Incremental Event Volume
-
Total Event Volume
-
Base Value
-
Incremental Event Value
-
Total Event Value
-
Manufacturer List Price
-
Regular Price
-
Promoted Price
-
Promotional Cannibalization Volume Forecast
-
Promotional Cannibalization Value Forecast
-
Promotional Pre-Post Effect Volume Forecast
-
Promotional Pre-Post Effect Value Forecast
-
Promotional Net Incremental Value Forecast
The detailed promotion measures that are visible in the Trade Analyst dashboard are:
-
Promotion
-
Tactic
-
Item
-
Site
-
Org (optional)
-
Date
Publishing to APCC generates a new APCC archive, which includes the promotion measures. All measures are plan-specific. The default plan names are:
-
APCC-PTP (detail measures)
-
APCC-PTP-A (aggregate measures)
Understanding Promotional Entities
You create custom reports and graphs based on the promotion measures that are imported from PTP.
Understanding Dimensions, Levels, and Hierarchies
Mandatory Dimensions, Levels, and Hierarchies
The table below lists the dimensions, levels, and hierarchies that are required to create your custom reports and graphs.
| Dimension | Hierarchy/Level | Comments |
| Promotion | Promotion Plan Promotion |
2 level hierarchy |
| Promotion | Promotion Scenario Promotion |
2 level hierarchy |
| Tactic | Promotion Tactic | Tactic level values are:
|
| Customer | Customer Retailer |
Customer, Retailer is another hierarchy of the Account/Customer dimension |
Additional Dimensions, Levels, and Hierarchies
In addition to the required dimensions, level, and hierarchies, there are additional parameters available, including:
-
Promotion measures, including those involved in calculations
-
Promotion aggregate measures
-
Promotion attributes
-
Promotion dimensions and levels
Promotion Measures
APCC stores promotion data at the Item level. The three tables below list the promotion measures you require:
-
Detail promotion measures
-
Detail promotion measures that are used in the calculations of aggregate measures in S&OP
-
Aggregate promotion levels
Note: The Organization dimension is not always part of a Demantra PTP implementation.
Detail Promotion Measures in the Trade Analyst and RT S&OP Dashboards
The table below lists the detail promotion measures in the Trade Analyst dashboard and the RT S&OP dashboard.
| Measure | Dimensions | Comments |
| Promoted Price | Promotion, Tactic, Product, Org, Retailer, Time | Sale price of a promoted item/org for a retailer |
| List Price* | Product, Org, Retailer, Time | List price of a promoted item/org for a retailer |
| Shelf Price | Product, Org, Retailer, Time | Shelf price of a promoted item/org for a retailer |
| Sale Price | Product, Org, Retailer, Time | Similar to Promoted Price but Sale Price does not vary by Promotion |
| Lift | Promotion, Tactic, Product, Org, Retailer, Time | Lift in sales due to promotion |
| Fixed Cost* | Promotion, Tactic, Product, Org, Retailer, Time | Vehicle cost for the promotion |
| Buydown* | Promotion, Tactic, Product, Org, Retailer, Time | Buydown spend for the promotion |
| Event Spend* | Promotion, Tactic, Product, Org, Retailer, Time | Total planned spending for promotion, sum of buydown, vehicle costs, and slotting |
| Manufacturer Profit | Promotion, Tactic, Product, Org, Retailer, Time | Manufacturer's profit from the event |
| Incremental Manufacturer Profit* | Promotion, Tactic, Product, Org, Retailer, Time | Incremental profit to the manufacturer due to the promotion |
| CPIU* | Promotion, Tactic, Product, Org, Retailer, Time | Event cost per incremental unit sold as a result of the promotion |
| % Spend | Promotion, Tactic, Product, Org, Retailer, Time | Event spending, as a percentage of event sales |
| Promoted Price Planned | Promotion, Tactic, Product, Org, Retailer, Time | Planned Sale price of a promoted item/org for a retailer |
| Lift Planned | Promotion, Tactic, Product, Org, Retailer, Time | Planned Lift in sales due to promotion |
| Base Event Volume Planned* | Promotion, Tactic, Product, Org, Retailer, Time | Planned Expected base volume without a promotion |
| Incremental Event Volume Planned | Promotion, Tactic, Product, Org, Retailer, Time | Planned Incremental volume due to the promotion |
| Total Event Volume Planned | Promotion, Tactic, Product, Org, Retailer, Time | Planned Total volume of the promotion |
| Base Event Value Planned | Promotion, Tactic, Product, Org, Retailer, Time | Planned Expected base value without a promotion |
| Incremental Event Value Planned* | Promotion, Tactic, Product, Org, Retailer, Time | Planned Incremental value due to the promotion, expressed as a currency |
| Total Event Value Planned* | Promotion, Tactic, Product, Org, Retailer, Time | Planned Total value of the promotion |
| Event Spend Planned* | Promotion, Tactic, Product, Org, Retailer, Time | Planned Total planned spending for promotion, sum of buydown, vehicle costs, and slotting |
| Mfg Profit Planned | Promotion, Tactic, Product, Org, Retailer, Time | Planned Manufacturer's profit from the event |
| Incremental Manufacturing Profit Planned * | Promotion, Tactic, Product, Org, Retailer, Time | Planned Incremental profit to the manufacturer due to the promotion |
| CPIU Planned* | Promotion, Tactic, Product, Org, Retailer, Time | Planned Event cost per incremental unit sold as a result of the promotion |
| % Spend Planned | Promotion, Tactic, Product, Org, Retailer, Time | Planned Event spending, as a percentage of event sales |
| Net Incremental Manufacturer Profit | Promotion, Tactic, Product, Org, Retailer, Time | Net incremental profit for the manufacturer, after considering cannibalization and pre- and post-effects |
| Price Decrease Level | Promotion, Tactic, Product, Org, Retailer, Time | Calculated as: ((Shelf Price - Promoted Price) / Promoted Price)) * 100 rounded to nearest 5% |
| Price Discount Percentage | Promotion, Tactic, Product, Org, Retailer, Time | Calculated as: ( (Shelf Price – Promoted Price) / Promoted Price ) * 100 |
| Incremental Event Value* | N/A | N/A |
| Manufacturer List Price* | N/A | N/A |
| Manufacturer Profit Planned | N/A | N/A |
| Regular Non-Promoted Price* | N/A | N/A |
| Regular Price* | N/A | N/A |
| Total Event Value* | N/A | N/A |
* Measure is available in reporting currency.
Detail Promotion Measures Used in Calculations of Aggregate Measures in S&OP
The following table lists the detail promotion measures used in the calculations of aggregate measures in S&OP.
| Measure Used in Calculations | Dimensions | Comments |
| Base Event Volume | Promotion, Tactic, Product, Org, Retailer, Time | Expected base volume without a promotion |
| Incremental Event Volume | Promotion, Tactic, Product, Org, Retailer, Time | Incremental volume due to the promotion |
| Total Event Volume | Promotion, Tactic, Product, Org, Retailer, Time | Total volume of the promotion |
| Base Event Value* | Promotion, Tactic, Product, Org, Retailer, Time | Expected base value without a promotion |
| Incremental Event Value* | Promotion, Tactic, Product, Org, Retailer, Time | Incremental value due to the promotion, expressed as a currency |
| Total Event Value* | Promotion, Tactic, Product, Org, Retailer, Time | Total value of the promotion |
| Promotional Cannibalization Volume Forecast | Promotion, Tactic, Product, Org, Retailer, Time | Reduction in volume to a non-promoted product as the result of a promotion |
| Promotional Cannibalization Value Forecast* | Promotion, Tactic, Product, Org, Retailer, Time | Reduction in revenue to a non-promoted product as the result of a promotion |
| Promotional Pre-Post Effect Volume Forecast | Promotion, Tactic, Product, Org, Retailer, Time | Reduction in volume before or after a promotion |
| Promotional Pre-Post Effect Value Forecast* | Promotion, Tactic, Product, Org, Retailer, Time | Reduction in revenue before or after a promotion |
| Promotional Net Incremental Volume Forecast* | Promotion, Tactic, Product, Org, Retailer, Time | Promotional Incremental Volume adjusted for Cannibalization and Pre-Post Effect |
| Promotional Net Incremental Value Forecast* | Promotion, Tactic, Product, Org, Retailer, Time | Promotional Incremental Value adjusted for Cannibalization and Pre-Post Effect |
* Measure is available in reporting currency.
The promotion measures, which are visible in the S&OP Analyst dashboard, are listed below:
-
Base Volume
-
Incremental Event Volume
-
Total Event Volume
-
Base Value*
-
Incremental Event Value*
-
Total Event Value
-
Manufacturer List Price*
-
Regular Price*
-
Promoted Price*
-
Promotional Cannibalization Volume Forecast
-
Promotional Cannibalization Value Forecast*
-
Promotional Pre-Post Effect Volume Forecast
-
Promotional Pre-Post Effect Value Forecast*
-
Promotional Net Incremental Value Forecast*
* Measure is available in reporting currency.
Aggregate Promotion Measures in APCC
The table below lists the aggregate promotion measures in APCC.
| Measure | Dimensions | Comments |
| List Price | Product, Org, Retailer, Time | List price of a promoted item/org for a retailer |
| Shelf Price | Product, Org, Retailer, Time | Shelf price of a promoted item/org for a retailer |
| Sale Price | Product, Org, Retailer, Time | Similar to Promoted Price but Sale Price does not vary by Promotion. |
| Base Volume | Product, Org, Retailer, Time | Expected base volume without a promotion activityd to Item, Org, Cust, Week. |
| Incremental Event Volume | Product, Org, Retailer, Time | Incremental volume due to the promotiond to Item, Org, Cust, Week. |
| Total Event Volume | Product, Org, Retailer, Time | Total volume of the promotiond to Item, Org, Cust, Week. |
| Base Value | Product, Org, Retailer, Time | Expected base value without a promotiond to Item, Org, Cust, Week |
| Incremental Event Value | Product, Org, Retailer, Time | Incremental value due to the promotion, expressed as a currencyd to Item, Org, Cust, Week |
| Total Event Value | Product, Org, Retailer, Time | Total value of the promotiond to Item, Org, Cust, Week |
| Promotional Cannibalization Volume Forecast | Promotion, Tactic, Product, Org, Retailer, Time | Reduction in volume to a non-promoted product as the result of a promotiond to Item, Org, Cust, Week |
| Promotional Cannibalization Value Forecast | Product, Org, Retailer, Time | Reduction in revenue to a non-promoted product as the result of a promotiond to Item, Org, Cust, Week |
| Promotional Pre-Post Effect Volume Forecast | Product, Org, Retailer, Time | Reduction in volume before or after a promotiond to Item, Org, Cust, Week |
| Promotional Pre-Post Effect Value Forecast | Product, Org, Retailer, Time | Reduction in revenue before or after a promotiond to Item, Org, Cust, Week |
| Promotional Net Incremental Volume Forecast | Product, Org, Retailer, Time | Promotional Incremental Volume adjusted for Cannibalization and Pre-Post Effectd to Item, Org, Cust, Week |
| Promotional Net Incremental Value Forecast | Product, Org, Retailer, Time | Promotional Incremental Value adjusted for Cannibalization and Pre-Post Effectd to Item, Org, Cust, Week |
The aggregated promotion measures, listed below, are visible in the Answers area of the S&OP Analyst dashboard.
-
Base Event Volume Aggregate
-
Incremental Event Volume Aggregate
-
Total Event Volume Aggregate
-
Base Event Value Aggregate
-
Incremental Event Value Aggregate
-
Total Event Value Aggregate
-
Promotional Cannibalization Volume Forecast Aggregate
-
Promotional Cannibalization Value Forecast Aggregate
-
Promotional Pre-Post Effect Volume Forecast Aggregate
-
Promotional Pre-Post Effect Value Forecast Aggregate
-
Promotional Net Incremental Volume Forecast Aggregate
-
Promotional Net Incremental Value Forecast Aggregate
There are two additional Dimensions and levels:
-
Promotion Plan: a group of promotions
-
Promotion Group, also called Promotioned Product Group (PPG). This is a group of Items commonly promoted together. In Demantra, Promotion Groups are part of the product hierarchy (a parent of Item) and do not vary over time.
Understanding Promotion Analysis Reports and Graphs
You can view promotion information by Item, Tactic, Promotion, or Customer. Within these categories, can navigate or drill down to seeded promotion analysis and view seeded graphs. These reports and graphs let you
-
Review promotions by retailer
-
Review by groups of items promoted together
-
Review by promotion tactic
-
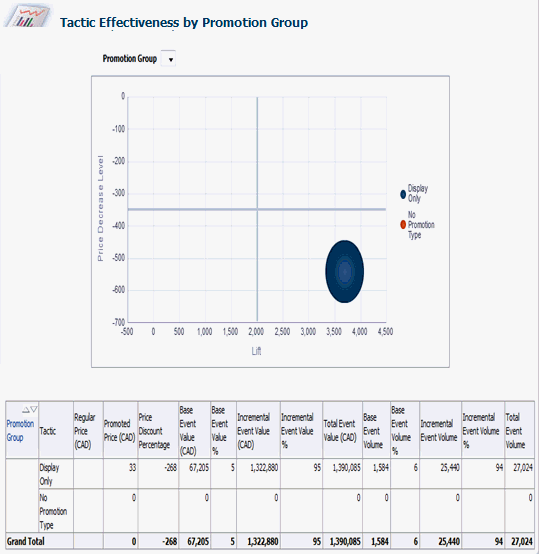
Review promotion tactic effectiveness by price and promotion group
-
Review by top or bottom performers based on lift, profit, or cost
-
Compare the base plan to one or more other plans
Seeded Tables
| Table | Navigate to/Drill to |
| Promotion by Retailer | Detail by Retailer of Promotion Group |
| Report by Promotion | Promotion by Promoted Group |
| Promotion by Tactic | Promotion by Promoted Group |
| Incremental Sales by Price Point | Detail by Retailer of Promotion Group |
| Tactic Effectiveness by Promotion Group | Detail by Promotion Group |
| Life Decomposition by Promotion | Detail by Customer |
| Compare Plans |
Seeded Graphs
The seeded graphs are:
-
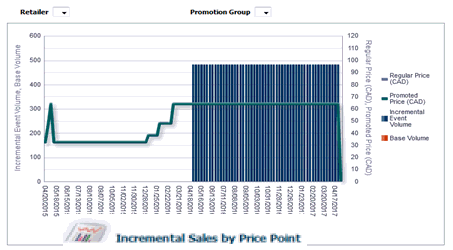
Incremental Sales by Price Point
-
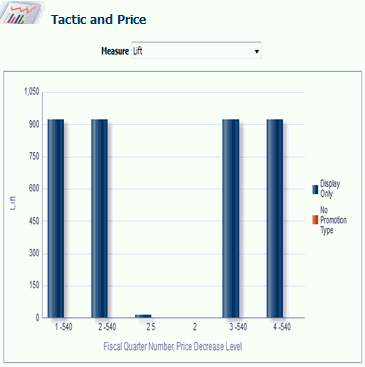
Tactic & Price
-
Tactic Effectiveness by Promotion Group
-
Life Decomposition by Promotion
-
Top Promotions by CPIU
-
Bottom Promotions by CPIU
-
Top Promotions by Lift
-
Bottom Promotions by Lift
-
Top Promotions by Net Incremental Profit
-
Bottom Promotions by Net Incremental Profit
-
Compare Plan
Analyzing Promotion
There are several reports you can create to look at the effectiveness of your promotion. You can analyze it by tactic, the time of year you ran it, the product, the retailer, and so on, or you may want to assess the tactic and percent price decrease to show the most and lease effective combination. Each tab on the Trade Analyst dashboard lets you choose the entities you wish to see in your report or graph.
This section provides examples of some of the numerous reports and graphs you can create.
Tactic and Price Graph
Tactic Effectiveness by Promotion Group Graph and Corresponding Report
Incremental Sales by Price Point Graph & Report
Incremental Sales by Price Point and Promotion report and graph appear within the same page layout.
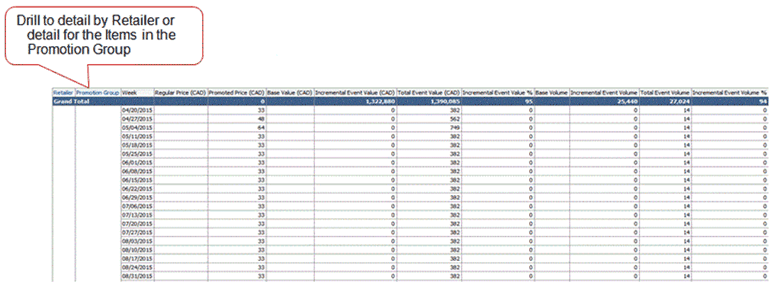
The corresponding report shows the baseline and incremental sales by price point.
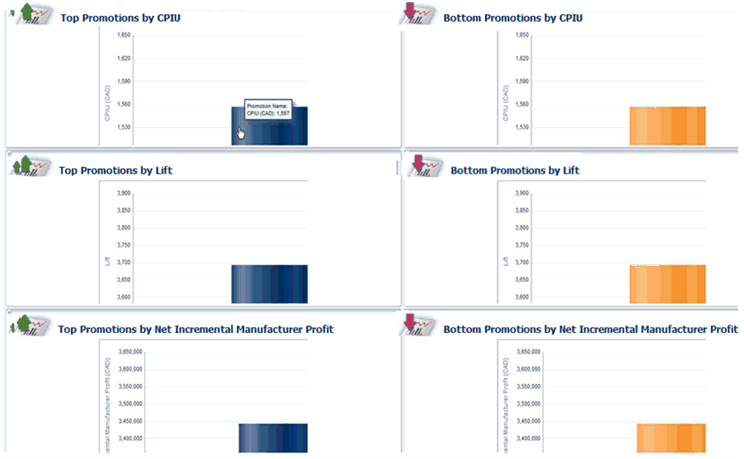
Top and Bottom Promotions
These graphs respectively show Top and Bottom Promotions by:
-
CPIU
-
Lift
-
Net Incremental Manufacturer Profit
Promotion by Retailer
In this report, you can review details by retailer or details for the items in the promotion group by drilling down from the Retailer or Promotion Group columns, respectively.

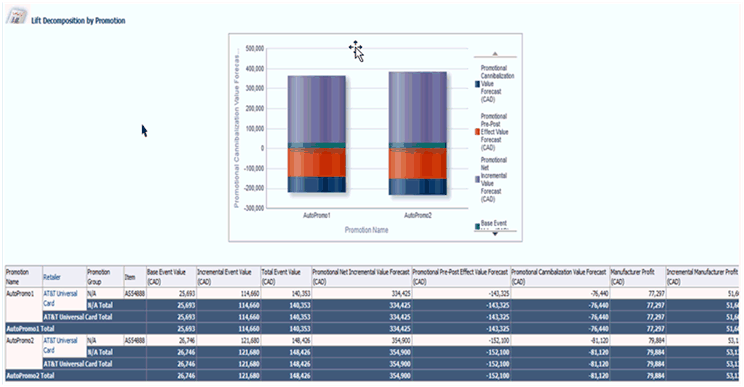
Lift Decomposition by Promotion Graph and Report
This example shows the Lift Decomposition by Promotion graph followed by the corresponding report.
Compare Plans
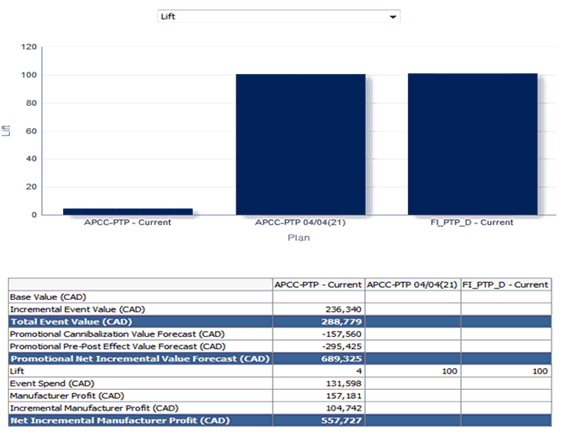
This example shows the Compare Plan graph followed by the corresponding report.
