Understanding the APCC Policy Planning Dashboard
Overview of APCC Policy Planning
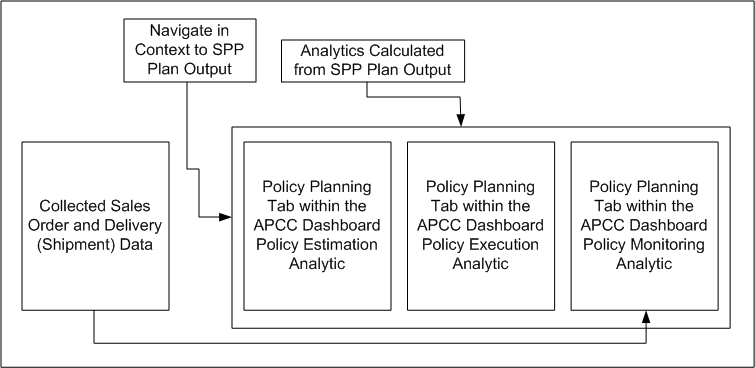
APCC has introduced a new Policy Planning dashboard in which you are able to view and analyze metrics associated with policy driven SPP Plans. You can view key SPP Plan outputs through the following analytics:
-
Plan Estimation: This metric shows the performance of the Policy Plan and compares it to targets.
-
Policy Execution: This metric provides insight into the current execution details associated with the Policy Plan.
-
Policy Monitory: This metric provides visibility into how the Policy Plan targets and current Plan results compare with historical metrics.
From each of these analytics, you can drill down to detailed graphs and the SPP Plan. An overview of the structure is shown below:

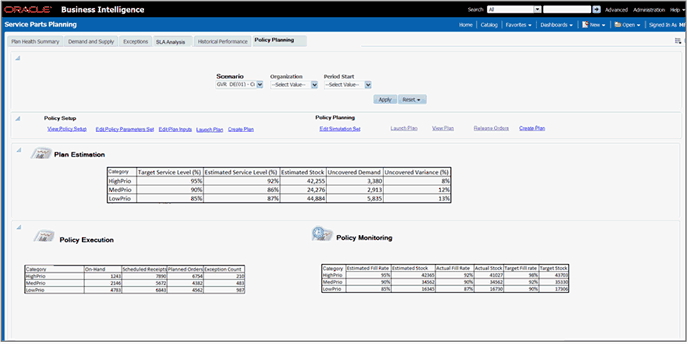
The Policy Planning dashboard has a selector region at the page level that lets you view analytics of the Scenario, the Organization, and the date range. Another region of the dashboard provides links so you can view, create, and launch SPP and IO Plans, as well as manage Policy Parameter set and Item Simulation set data.
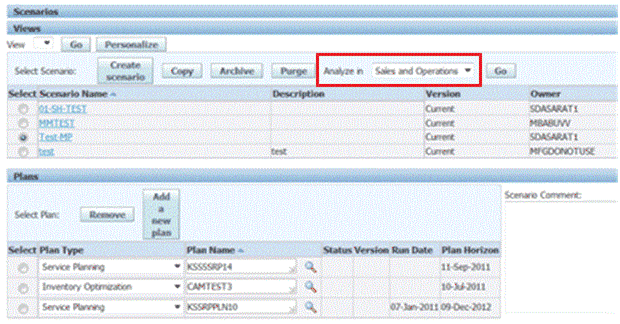
The Policy Planning setup lets you analyze data from multiple plans together by grouping them into one scenario in APCC. You can associate the scenario with the Policy Planning dashboard by setting the value of the Analyze In drop-down menu to Service Parts Planning.
Using the APCC Policy Planning Dashboard
The categories for which data shows in the Policy Planning dashboard is derived from a category set. In order to display the data, the profile, MSC: Category Set for Policy Planning APCC reports, must have the same value as the Category Set that is used to define Policy Parameters in the Policy Parameters Set.
Creating a Scenario to View Policy Planning Data
You may want to view several Policy Planning plans at higher aggregation levels in order to evaluate the performance of Policy Planning. To do this, you need to associate the plans within one scenario. If you want to view only one plan, it needs to be associated with a scenario because the Policy Planning page uses Scenario as a filter.
To create scenarios for policy planning:
-
Sign in under the Advanced Planning Scenario Manager
-
Click Scenario Management.
-
Click Scenarios.
-
Click Analyze in drop-down menu at the top right of the Views section of the Scenarios screen.
Analyze in drop-down shows the dashboard for which the created scenario is relevant. The current values are:
-
Sales and Operations
-
Supply Chain Analyst
-
Service Parts Planning
-

The APCC Policy Planning dashboard has the following page level selections:
| Field | Default Value | Comments |
| Scenario | None, user select | All Scenarios that are enabled for Service Items Planning appear in the selection list |
| Organization | All | Lists all Organizations associated with the Plans within the Scenario. |
| Period Start | Definition of period similar to existing APCC framework | You can select a range of dates. The Policy Monitoring Analytic has data from the past, so you can also select dates in the past on the date filter. |
Viewing Policy Planning Output
The Policy Planning tab is shown below:

The Policy Planning page is divided into two main areas: Policy Setup and Policy Planning.
Policy Setup
Under the Policy Setup section of the page, there are five links that related to various IO areas:
-
View Policy Setup: View the Material Plan for a named IO Plan showing the Policy details calculated by IO.
-
Edit Policy Parameters Set: This opens the Policy Parameters Set associated with the selected Plan.
-
Edit Plan Inputs: This opens the existing IO Edit Plan Inputs screen, which allows you to:
-
Edit IO Plan Options
-
Edit Service Level Set associated with the Plan
-
Edit IMM Policy Parameters, grouped by Parameter type
-
-
Launch Plan: This enables you to launch the IO Plan.
-
Create Plan: This link enables you to create a new plan. When you create a new Plan, you can associate it to an existing, or create a new Policy Parameters Set, Item Simulation Set, Assignment Set and Service Level Set.
Policy Planning
Under the Policy Planning section of the page, there are five links that related to various SPP areas:
-
Edit Simulation Set: This enables you to view and edit a simulation set and update planning related properties, if required.
-
Plan View: This link enables you to view the SPP Policy Plan within the SPP work area. From the work area, you can view the SPP Policy Plan details through the material plan and copy and relaunch the plan, as required.
Note: When you create a new plan, the plan must be included in the scenario for its data to make it visible in the Policy Planning tab.
You need to select the Plan Name to view the plan.
Policy Planning Analytics
There are three seeded analytics in the Policy Planning dashboard:
-
Plan Estimation
-
Inventory Policy Execution
-
Inventory Policy Monitoring
Plan Estimation Analytic
The Plan Estimation Analytic analyzes whether Items have sufficient inventory to meet their Target Service Levels. If Items do not have enough inventory to meet your requirements, this analytic helps you to understand the extent of shortage of Items required to achieve the necessary Target Service Levels.
The example of Plan Estimation Analytic below depicts the Analytic when seen by Category across the entire Plan Horizon and across all Orgs:
| Category | Target Service Level (%) | Estimated Service Level (%) | Estimated Stock | Uncovered Demand | Uncovered Variance (%) |
| HighPrio | 95 | 92 | 42,255 | 3,380 | 8 |
| MedPrio | 80 | 86 | 24,276 | 2,913 | 12 |
| LowPrio | 85 | 87 | 44,884 | 5,835 | 13 |
This analytic displays the following measures:
| Measure | Origin | Comments |
| Target Fill Rate (%) | Target Fill Rate (%): As specified in Policy Parameters and inherited in the setup plan. | This is an input measure into the SPP Plan through the IO Plan reference. It is non editable within SPP. Aggregation: Weighted Average based on Forecast Quantity. |
| Estimated Fill Rate (%) | This corresponds to the Service Level associated with the PAB value on a day . | This is calculated by the SPP Plan every day based on the PAB value for that day. Aggregation: Weighted Average based on Forecast Quantity |
| Estimated Stock | PAB value on a given day | This is the PAB value per day calculated within the Plan. Aggregation: Sum |
| Uncovered Demand | For the PAB on any day, this is the quantity of demand that may not be fulfilled (with reference to the forecast distribution relevant for the Item-org) | This is calculated by the Plan. Aggregation: Sum |
| Uncovered Variance (%) | Corresponding to the PAB value, the probability that is uncovered (1-cumulative probability covered). | This is calculated by the Plan Aggregation: Weighted Average based on Forecast Quantity |
This Analytic is viewable at different granularities. The list of distinct Analytics that are available at different granularities, and their drill-downs, is shown in the following table:
| Analytic Name | Dimension Level | Drill Down To: | |
| 1 | Plan Estimation Analytic by Category | Category, All Orgs, All Time | 2,3,6 |
| 2 | Plan Estimation Analytic by Category and Org | Category, Org, All Time | 3,6 |
| 3 | Plan Estimation Analytic by Category and Org by Day | Category, Org, By Day | 5 |
| 4 | Plan Estimation Analytic by Item and Org | Item, Org, All Time | 5 |
| 5 | Plan Estimation Analytic by Item and Org By Day | Item, Org, By Day | Supply/Demand screen within the SPP Plan for that Item/Org |
| 6 | Plan Estimation Analytic by Item | Item, All Orgs, All Time | 4 |
You can also drill-down to the Supply/Demand Analysis screen within an SPP plan from the Analytics 4, 5, and 6 that are at the Item level.
Policy Plans have an Org and Item assigned to only a single Plan, although there are multiple Plans within the scenario associated with APCC. It is possible from the Analytic at the Item level to drill into the Supply / Demand Analysis screen in context of the Item and Org(s).
Inventory Policy Execution Analytic
The Inventory Policy Execution Analytic is a view into the current execution details associated with the plan. At the highest level of Aggregation, this analytic shows the following kind of data:
| Category | On-Hand | Scheduled Receipts | Planned Orders |
| HighPrio | 1243 | 7890 | 6754 |
| MedPrio | 2146 | 5672 | 4382 |
| LowPrio | 4783 | 6843 | 4562 |
The following measures are available in the Inventory Policy Execution Analytic:
| Measure | Origin | Comments |
| On-Hand | The following measures are available in the Inventory Policy Execution Analytic: | On-Hand data is collected and used in the Plan Aggregation: Sum |
| Scheduled Receipts | This is the sum of already created transactional orders: Purchase Orders, Purchase Requisitions and Internal Requisitions. | At the lowest level, drill into the Supply/Demand Analysis screen. Aggregation: Sum |
| Planned Orders | These are the Planned orders created within the current Plan. | At the lowest level, drill into the Supply/Demand Analysis screen. Aggregation: Sum |
This Analytic is viewable at different granularities. The list of distinct Analytics that are available at different granularities, and their drill-downs, is shown in the following table:
| Analytic Name | Dimension Level | Drill Down To: | |
| 1 | Policy Execution Summary by Category | Category, All Orgs, All Time | 2,6 |
| 2 | Policy Execution Summary by Category and Org | Category, Org, All Time | 3,6 |
| 3 | Policy Execution Summary by Category and Org Across Time | Category, Org, By Day | 5 |
| 4 | Policy Execution Summary by Item and Org | Item, Org, All Time | 5 |
| 5 | Policy Execution Summary by Item and Org Across Time | Item, Org, By Day | Supply/Demand Analysis |
| 6 | Policy Execution Summary by Item | Item, All Orgs, All Time | 4 |
Inventory Policy Monitoring Analytic
An Items planner has visibility into whether his policy settings have been effective from an execution standpoint, by looking at past data. You can see:
-
Estimated Fill Rate%: From the current Plan Data and assumed = Estimated Service Level %
-
Estimated Stock: From the Current Plan Data and assumed = PAB (Projected Available Balance). This is the same measure calculated in the Plan Estimation Analytic.
-
Actual Fill Rate %: From collected historical data = (Shipped Order Quantity)/(Requested Order Quantity)
-
Actual Stock: Actual On-Hand value available as of today
Target Fill Rate %: Target service level as per current policy
Target Safety Stock: Safety Stock required to meet Target Service Level %, and calculated as the “Safety Stock” value within the Plan – this needs to be exported out of the Plan for use in APCC.
A sample of this Analytic, as viewed at the highest level of granularity, might look as shown in the table below:

Note: The Actual Fill Rate and the Actual Stock values are calculated from Collected Data, not from a Plan
The following measures are Item of the above Analytic:
| Measure | Origin | Comments |
| Estimated Fill Rate% and Estimated Stock | Estimated Fill Rate% corresponds to the Service Level associated with the PAB value on a day. Estimated Stock is the PAB value on a given day. |
None |
| Actual Fill Rate % | Must be calculated from collected historical delivery data. Refer to the following section. | Delivery data is the shipment data that will be collected from Oracle Shipping. The Actual Fill Rate % will be calculated based on this data. This is calculated daily |
| Actual Stock | Collected on-hand data | Current on-hand data. |
| Target Fill Rate % and Target Safety Stock | This is available from the SPP Plan | None |
This Analytic is viewable at different granularities. The list of distinct Analytics that are available at different granularities, and their drill-downs, is shown in the following table:
| Analytic Name | Dimension Level | Drill Down To: | |
| 1 | Policy Monitoring Summary by Category | Category, All Orgs, All Time | 2,3,6 |
| 2 | Policy Monitoring Summary by Category and Org | Category, Org, All Time | 3,6 |
| 3 | Policy Monitoring Summary by Category and Org Across Time | Category, Org, By Day | 5 |
| 4 | Policy Monitoring Summary by Item and Org | Item, Org, All Time | 5 |
| 5 | Policy Monitoring Summary by Item and Org Across Time | Item, Org, By Day | Supply/Demand Analysis |
| 6 | Policy Monitoring Summary by Item | Item, All Orgs, All Time | 4 |
Calculation of the Actual Fill Rate
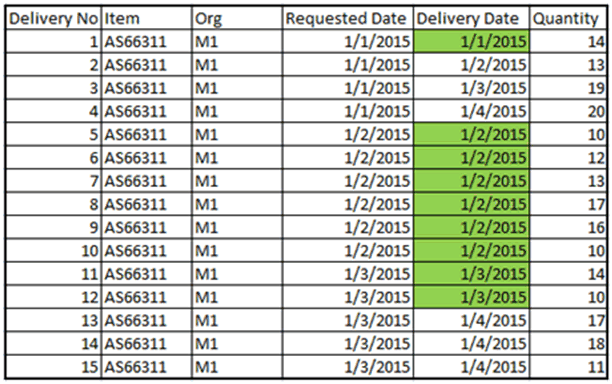
Collected Shipment data is used to calculate the Actual Fill Rate. Shipments retain the original Requested Date of the Sales Order that they correspond to. Consider the following collected shipment/delivery data.
Note: EPS shipping refers to shipments as deliveries.

On each requested date, the fill rate is calculated as: Qty Delivered on Time/Total Qty Requested
Therefore, on:
-
1/1/2015, Actual Fill Rate % = 14/66 = 21.21%
-
1/2/2015, Actual Fill Rate % = 78/78 = 100%
-
1/3/2015, Actual Fill Rate % = 24/70 = 34.2%
The Actual Fill Rate is calculated at an Item/Org/Day level. Aggregation across Days, Orgs and Items are the weighted average, using the Quantity delivered on time as the weighting factor.
Thus, to aggregate the above calculations across Day 1, Day 2 and Day 3, the weighted average calculation is:
(21.21% * 14 + 100% * 78 + 34.2% * 24) / (14+78+24) = 76%
Collections Support
Shipment/Delivery data required to calculate the Actual Fill Rate is collected from EBS. Legacy collects are also available to collect this data.