Oracle Service Contracts Command Center
This chapter covers the following topics:
Service Contracts Command Center
Overview
The Oracle Service Contracts Command Center presents sales managers and sales representatives with information to help prioritize activities in their work queue, formulate trends, and forecast accurately. The command center enables you to collaborate, review, analyze, and act to:
-
Increase on-time renewals.
-
Gather insights into booked and pending renewals to increase conversion rates.
-
Identify critical risk contracts that are due for renewal.
-
Predict the likelihood of contract renewals accurately.
-
Identify and analyze the factors that impact the renewal probability.
-
-
Improve customer satisfaction.
-
Monitor turbulence of services provided to customers.
-
Coordinate activities between the renewals and service teams.
-
-
Maximize productivity.
-
Focus sales representative daily activity on critical contracts.
-
Quickly identify the top contracts needing attention and take necessary action.
-
Note: You must complete the Service Contracts Command Center configuration and setup after the installation and common configurations are completed as described in My Oracle Support Knowledge Document 2495053.1, Installing Enterprise Command Center Framework, Release 12.2. For additional ECC overview information, see Overview of Enterprise Command Centers, Oracle E-Business Suite User's Guide
Searching Enterprise Command Center Dashboards
Use the dashboard sidebar to refine (filter) the data on each dashboard. You can select a value or record from the Available Refinements component, or use Search to find a keyword, a value, or a specific record. The type-ahead feature suggests matches for your entry that correspond to the available refinements. When you submit a search, the search term is added to the Selected Refinements list, and the dashboard data is refined to include only records that match the search. You can add multiple refinements and remove any of them at any time. Use Saved Search to create and save your search. You can edit, delete, or refer to this saved search. You can also use data sets to further refine your search.
Use an asterisk (*) or percent (%) to perform a partial keyword or record search that matches any string of zero or more characters. You can also use a question mark (?) to perform a partial search that matches any single character.
For more information about searching for and refining data in enterprise command centers, see: Overview of Enterprise Command Centers, Oracle E-Business Suite User's Guide.
Additional Information: For more information about searching for and refining data in enterprise command centers, see "Search" in Highlights of an Enterprise Command Center, Oracle E-Business Suite User's Guide.
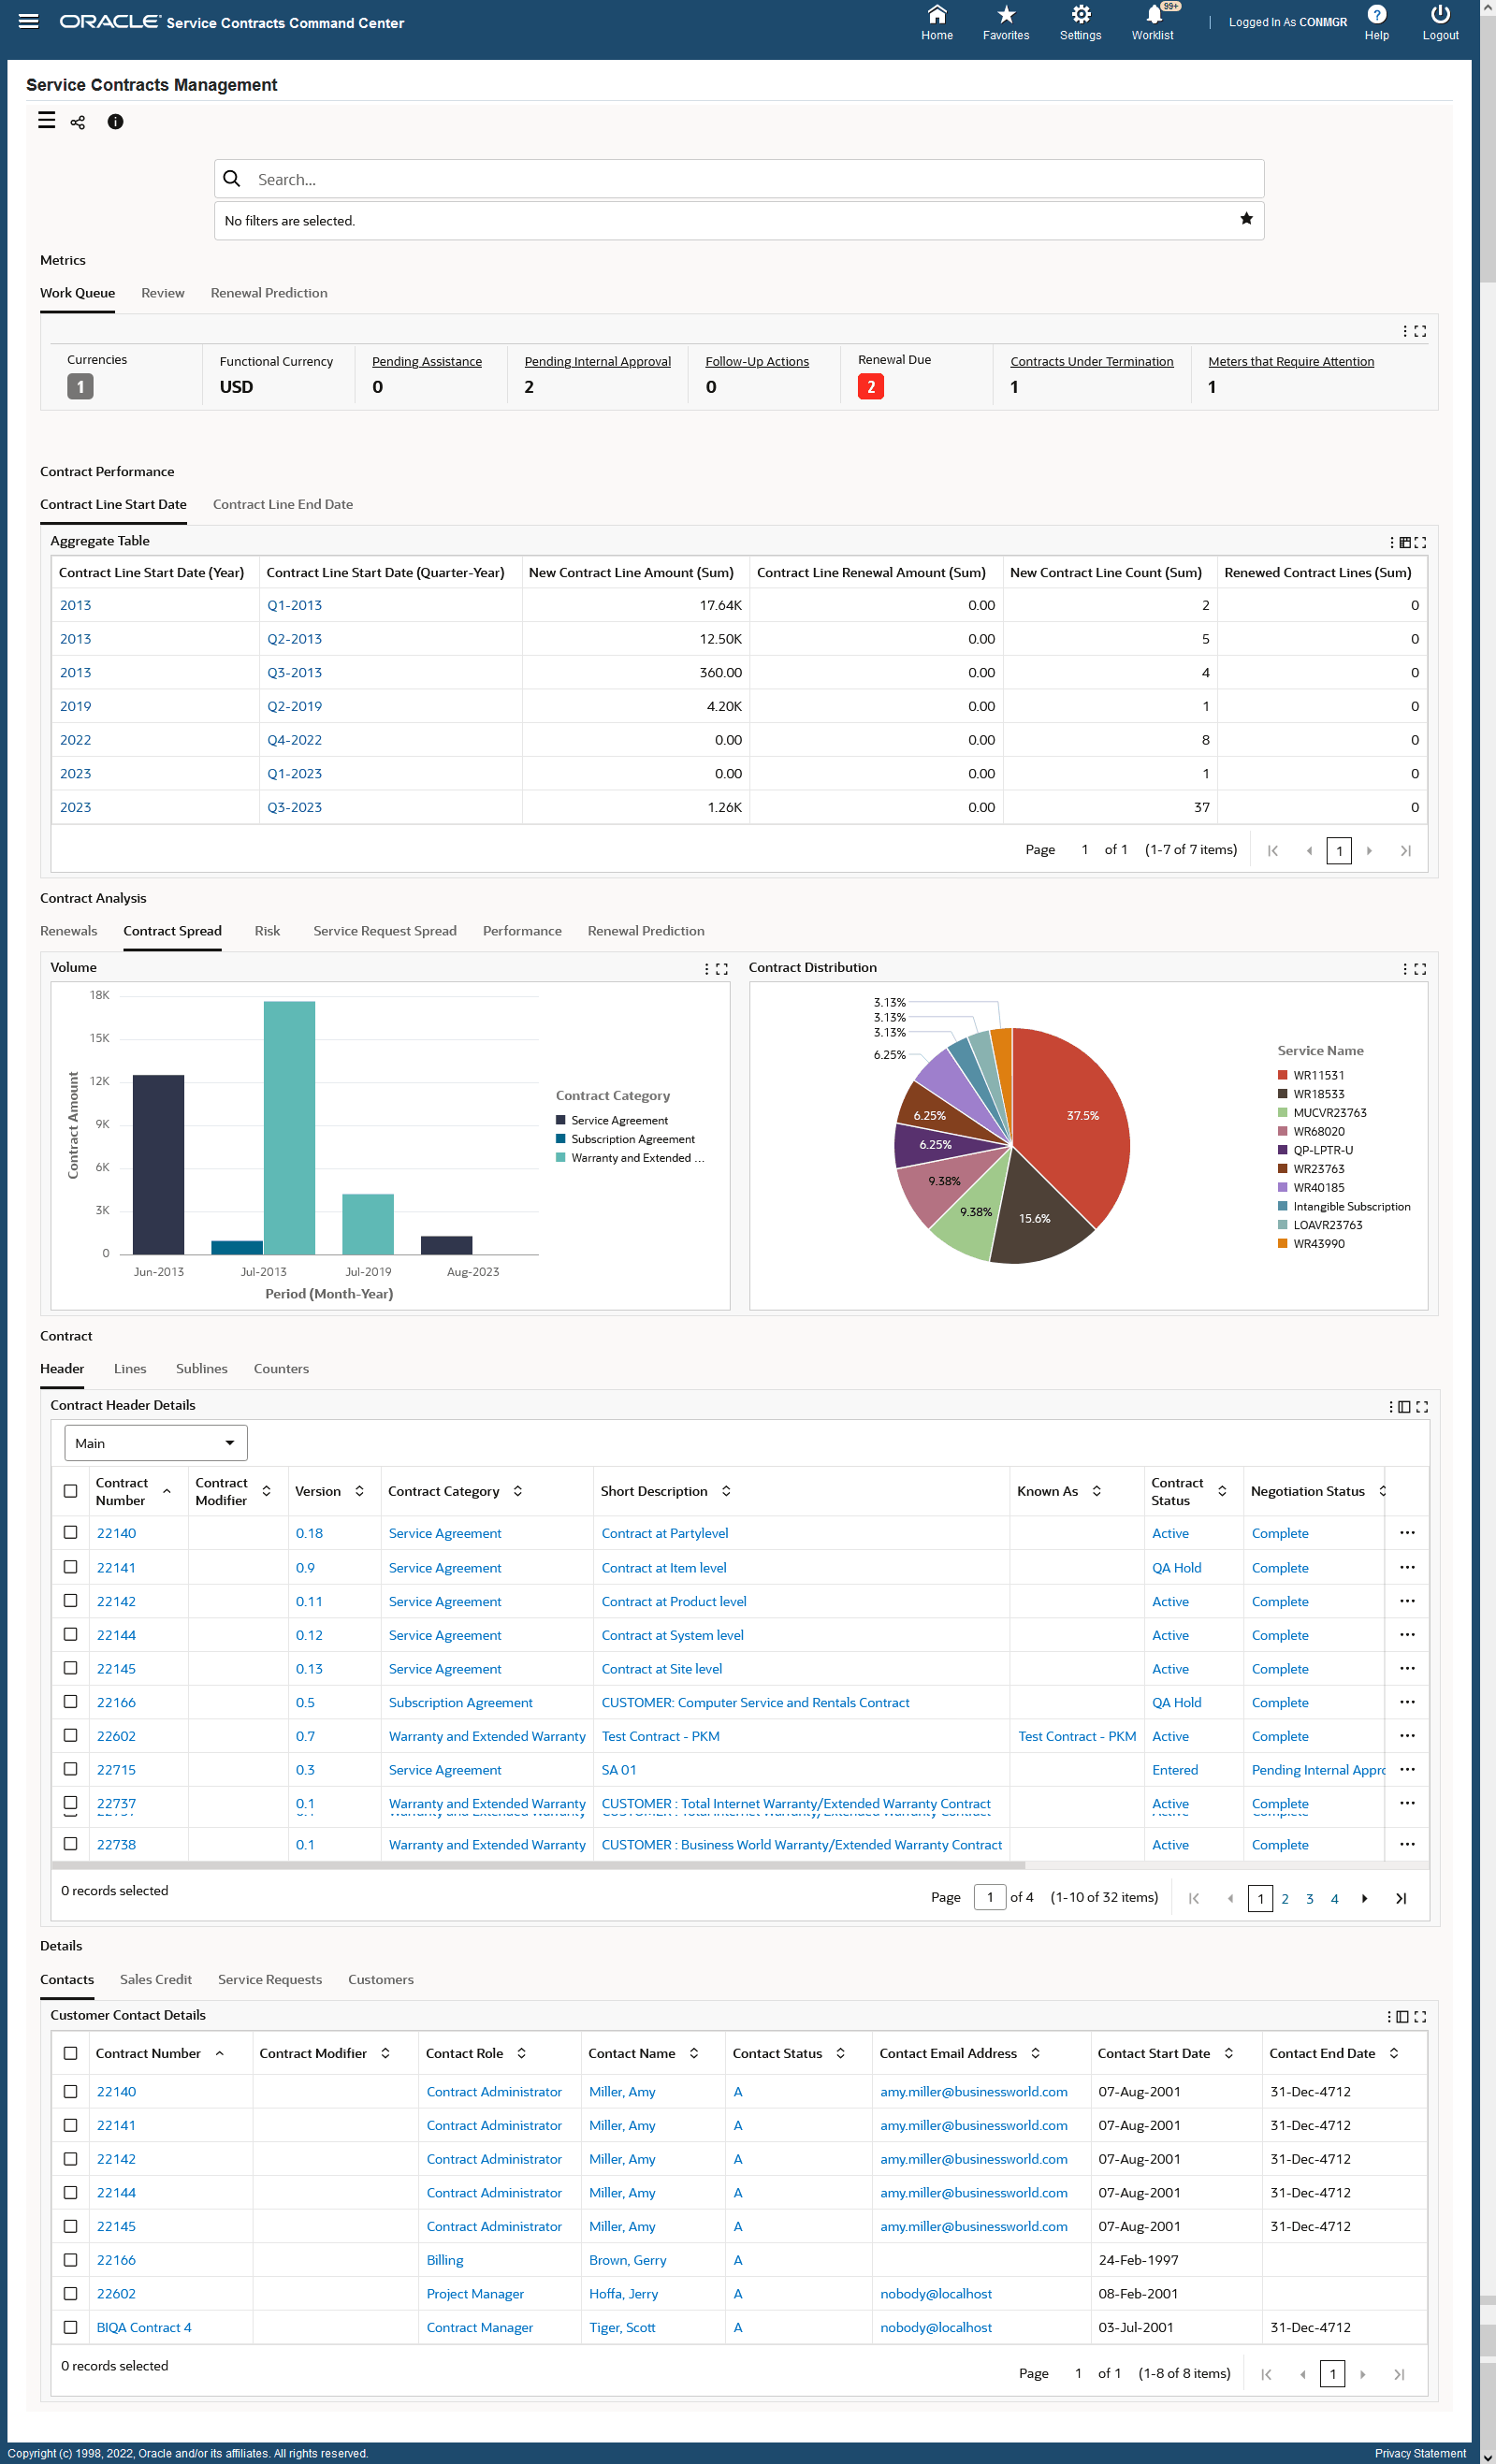
Service Contracts Management Dashboard
Use the Service Contracts Management dashboard to view contracts information, customer risk information, and service request information.
Use the Service Contracts Manager responsibility to navigate to the Service Contracts Management dashboard:
(N) Service Contracts Command Center > Service Contracts Management
Service Contracts Management Dashboard

| Components | Description |
|---|---|
| Metrics (tabbed component) Work Queue (tab) |
This summary bar displays the following key metrics. You can further refine the data by clicking on the metric value.
|
| Metrics (tabbed component)Review (tab) | This summary bar displays the following key metrics. You can further refine the data by clicking on the metric value.
|
| Metrics (tabbed component) Renewal Prediction (tab) | This summary bar displays the following key prediction metrics. You can further refine the data by clicking on the metric value.
Note: To use Renewal Prediction, you must complete the setup as described in My Oracle Support Knowledge Document 2933050.1, Setting Up the Contract Renewal Prediction Feature and Additional Patches Required for Oracle Service Contracts ECC V10. |
| Contract Performance (tabbed region) | This tab contains the following aggregate tables:
Note: The contract lines considered are those that have an end date in the year that is filtered, but have not been renewed or have been terminated. |
| Contract Analysis (chart) Renewals (tab) |
This tab contains the following charts about customer renewals:
|
| Contract Analysis (tabbed component) Contract Spread (tab) |
This tab contains the following charts about the spread of contracts:
|
| Contract Analysis (tabbed component) Risk (tab) |
This tab contains the following charts about the risk of contracts:
|
| Contract Analysis (tabbed component) Service Request Spread (tab) |
This tab contains a graph that shows the count of service requests by customer, by service request severity, and by service request status. |
| Contract Analysis (tabbed component) Performance (tab) |
This tab contains the following charts about the performance of contracts:
|
| Contract Analysis (tabbed component) Renewal Prediction (tab) | This tab contains the following charts about the performance of contracts:
|
| Contract (results table) | This results table shows contract details in the following tabs:
Click the Options icon to perform actions. To compare two or more rows, select the rows and then click Compare. From the Headers tab, select Mass Update to update multiple contracts, or select Administrator Workbench to navigate to the Service Contracts page. |
| Details (results table) | This results table shows contract details in the following tabs:
Click the Options icon to perform actions. To compare two or more rows, select the rows and then click Compare. |