17 Monitoring Oracle Mediator Service Components and Engines
This chapter describes how to monitor runtime instance information, component states, and faults for Oracle Mediator service components and engines using Oracle Enterprise Manager Fusion Middleware Control.
This chapter includes the following sections:
-
Section 17.1, "Introduction to the Oracle Mediator Dashboard Pages"
-
Section 17.2, "Monitoring Oracle Mediator Service Component Instances and Faults"
-
Section 17.3, "Monitoring Oracle Mediator Service Engine Instances and Faults"
For more information, see the following sections:
In addition to monitoring Mediator components using Oracle Enterprise Manager Fusion Middleware Control, you can also set up watches and notifications for resequencing groups have stopped processing but still have messages pending. You can also run a diagnostic dump with this information. For more information, see Chapter 12, "Diagnosing Problems with SOA Composite Applications."
17.1 Introduction to the Oracle Mediator Dashboard Pages
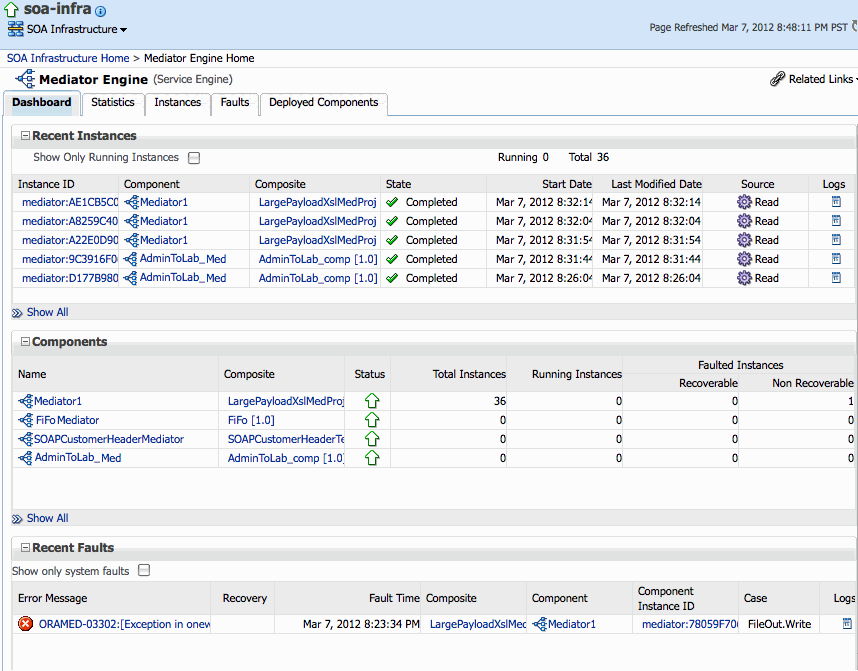
The Mediator Component Dashboard lets you view information about the current state of the selected Mediator service component, and to manage faulted instances and messages. The Mediator Engine Dashboard lets you view the same information, but for all Mediator service components running on the Mediator service engine.
Each section of the dashboard includes links to further information that can help you monitor the status of your environment. The following sections describe the instance information in the different sections of the Dashboard page.
Note:
When viewing instances for Mediator service components that use message resequencing, additional fields appear on some of the tabbed pages. These fields provide additional information about the resequencing groups.
17.1.1 Recent Instances Section
This section describes the types of information you can view for recent Mediator instances. You can select whether to view all instances or only running instances.
-
Instance ID: The unique ID of a specific Mediator instance.
-
Component: The name of the Mediator service component for which the instance was initiated (Mediator Engine Dashboard only).
-
Composite: The name of the composite application in which the instance was initiated (Mediator Engine Dashboard only).
-
State: The state of the specific Mediator instance. The possible states are described below.
-
Stale: The composite for which this Mediator instance was created is undeployed.
-
Terminated by User: The instance was terminated manually through Oracle Enterprise Manager Fusion Middleware Control, or automatically by a fault policy.
-
Faulted: The instance is faulted and cannot be recovered.
-
Completed successfully: Everything is fine with this instance and it ran successfully.
-
Recovery required: The instance is faulted and can be recovered manually through Oracle Enterprise Manager Fusion Middleware Control.
For more information about recovering a fault, see Section 18.3, "Recovering From Oracle Mediator Service Engine Faults".
-
Running: One or more routing rules of the Mediator instance are still running.
-
-
Start Date: The date when the Mediator instance was started.
-
Last Modified Date: The date when the Mediator instance was last modified.
-
Source: The operation or event that triggered the Mediator instance.
-
Logs: The location of the log file containing the log messages related to the Mediator instance.
17.1.2 Components Section
This section appears on the Mediator Engine Dashboard only, and displays the following information about the Mediator service components running on the Mediator service engine.
-
Name : The name of each Mediator service component running on the service engine.
-
Composite: The name of each composite that includes a Mediator service component running on the service engine.
-
Status: An indicator of whether the Mediator service component is up or down.
-
Total Instances: The number of total instances processed or being processed for the service component.
-
Running Instances: The number of instance currently being processed for the service component.
-
Recoverable Instances: The number of faulted instances that are recoverable.
-
Non Recoverable Instances: The number of faulted instances that are not recoverable.
17.1.3 Recent Faults Section
This section provides the following information about the recent faults that occurred while the Mediator service component or service engine was running:
-
Error Message: The detailed error message associated with the faulted instance.
-
Recovery: An indicator of whether the fault is recoverable or not. If a fault is marked as recoverable on the Mediator Component Dashboard, you can select it and choose a recovery action from the Recovery Actions list. You can also click Recover for that fault to access more recovery options at the service component instance level.
-
Fault Time: The time when the fault occurred in the instance.
-
Component: The name of the Mediator service component in which the fault occurred (on the Mediator Engine Dashboard only).
-
Component Instance ID: The unique ID of the Mediator service component instance.
-
Case: The routing source case where the fault occurred.
-
Logs: The log file containing the log message related to the fault. Click this link to see more details about the fault and potential causes of the fault.
For more details about the information available on the Faults page, see Section 18.3, "Recovering From Oracle Mediator Service Engine Faults".
17.1.4 Routing Statistics Section
This section is on the Mediator Component Dashboard only, and provides the following information about the routing data of a source operation or subscribed event.
-
Number of Successfully Processed Messages: The number of messages successfully processed for the selected route source.
-
Number of Faulted Messages: The number of messages that threw faults for the selected route source.
-
Number of Incoming Messages: The total number of incoming messages for the selected route source.
-
Average Processing Time for Successful Messages: The average time taken to process each successful message for the selected route source.
-
Average Processing Time for Faulted Massages -The average time taken to process each faulted message.
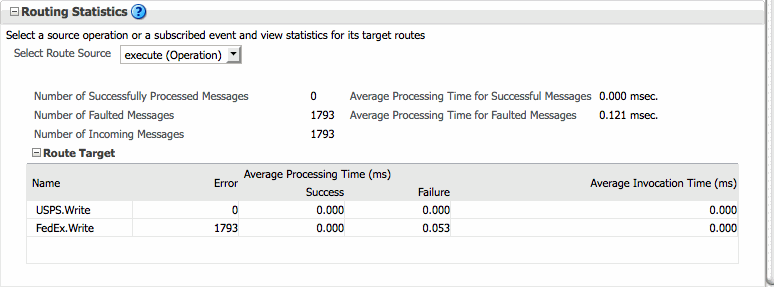
The Route Target subsection in the Routing Statistics section displays statistics of the target routes for the Mediator service component. This section provides the following information about an Mediator service component instance:
-
Name: The name of the route target of the Mediator service component.
-
Error: The number of errors that occurred during routing.
-
Average Processing Time: The average processing time for the instances of the Mediator service component. This field has two subfields, Success and Failure. The Success subfield shows the average processing time for the instances of the Mediator service component that were processed successfully. The Failure subfield shows the average processing time for the instances of the specific Mediator service component that failed to process successfully.
-
Average Invocation Time: The average invocation time for the instances of the Mediator service component.
17.1.5 Instance Rate Per Min Section
This section provides information about the execution rate of the Mediator instances per minute. This section displays a graph that shows real-time data for successful, faulted, and incoming instances in the last five minutes.
You can view the instance rate for the last five minutes in tabular form by clicking Table View.
17.2 Monitoring Oracle Mediator Service Component Instances and Faults
You can perform any of the following component-level monitoring tasks from the Mediator Component home page on Oracle Enterprise Manager Fusion Middleware Control:
-
Monitoring Oracle Mediator Service Component Recent Instances and Faults
-
Monitoring Audit Trail and Fault Details for an Oracle Mediator Component Instance
17.2.1 Monitoring Oracle Mediator Service Component Recent Instances and Faults
The Mediator Component Dashboard displays information about recent instances and faults. Each service component in a SOA composite application has its own instance ID. These IDs are different from the overall instance ID of the SOA composite application of which each service component is a part.
To monitor Mediator service component instances and faults:
-
Access the SOA Composite home Page through one of the following options:
From the SOA Infrastructure Menu... From the SOA Folder in the Navigator... -
Select Home.
-
Select the Deployed Composites tab.
-
In the Composite section, select a specific SOA composite application.
-
Expand soa-infra, and then select a specific SOA composite application.
-
-
In the Component Metrics section, select the Mediator service component.
-
Click the Dashboard tab.
Description of the illustration med_comp_main.gif
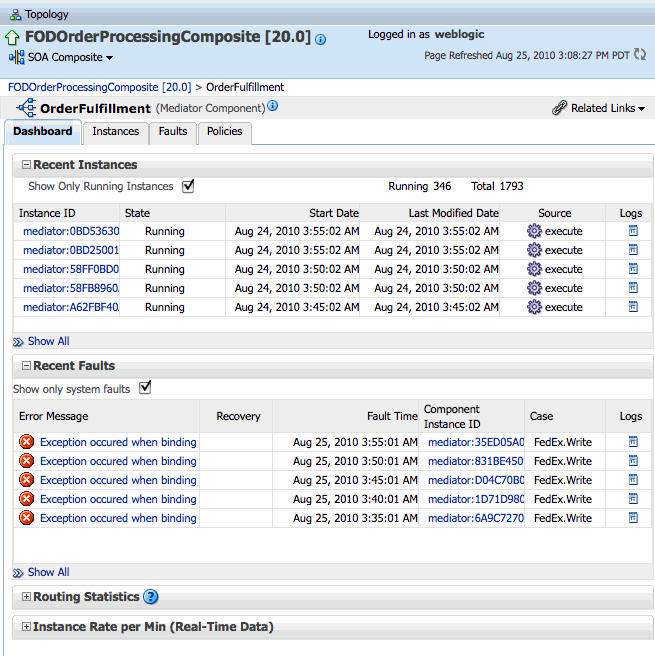
The Dashboard page displays the information described in Section 17.1, "Introduction to the Oracle Mediator Dashboard Pages."
-
In the Recent Instances section, perform any of the following tasks:
-
In the Instance ID column, click an instance ID to view its instance details, including an audit trail and faults.
-
In the Logs column, click a log icon to access the Log Messages page with messages specific to that instance.
-
Click Show Only Running Instances to view only those instances that are in the running state.
-
Click Show More below the section to access the Instances page of the service component and view all instances of the service component.
-
-
In the Recent Faults section, perform any of the following tasks:
-
In the Error Message column, click an error message to display complete information about the fault. If the fault is identified as recoverable, click Recover Now to perform fault recovery.
-
In the Recovery column, click a fault identified as Recoverable to perform fault recovery at the service component instance level.
-
In the Logs column, click a specific log to access the Log Messages page with filtered messages specific to that instance.
-
Click Show only system faults to display only the faults that were caused by a system error. System faults are related to system failure issues, such as a database or network being inaccessible.
-
Click Show More below the section to access the Faults page of the service component and view all component faults.
-
-
Expand the Routing Statistics section and select an operation or event in the Select Route Source field.
View the statistics for the selected operation or event. To view additional information, expand the Route Target section.
Description of the illustration med_rout_stat2.gif
-
Expand the Instance Rate per Min (Real-Time Data) section to view a graphical representation of the number of successful, faulted, and incoming (pending) instances of the Mediator service component over a specific time range.
Click Table View to display the same information in a tabular format.

Description of the illustration med_inst_rate.gif
For more information, see Section 1.2.3, "Introduction to SOA Composite Application Instances". For information about viewing and searching log files, see Oracle Fusion Middleware Administrator's Guide.
17.2.2 Monitoring Oracle Mediator Service Component Instances
The Instances page on the Mediator Component home page lets you search for a Mediator service component instance and view information about an instance based on the criteria specified.
To monitor the instance statistics of a Mediator service component:
-
Access the SOA Composite home page through one of the following options:
From the SOA Infrastructure Menu... From the SOA Folder in the Navigator... -
Select Home.
-
Select the Deployed Composites tab.
-
In the Composite section, select a specific SOA composite application.
-
Expand soa-infra, and then select a specific SOA composite application.
-
-
In the Component Metrics section, select the Mediator service component.
-
Click the Instances tab.
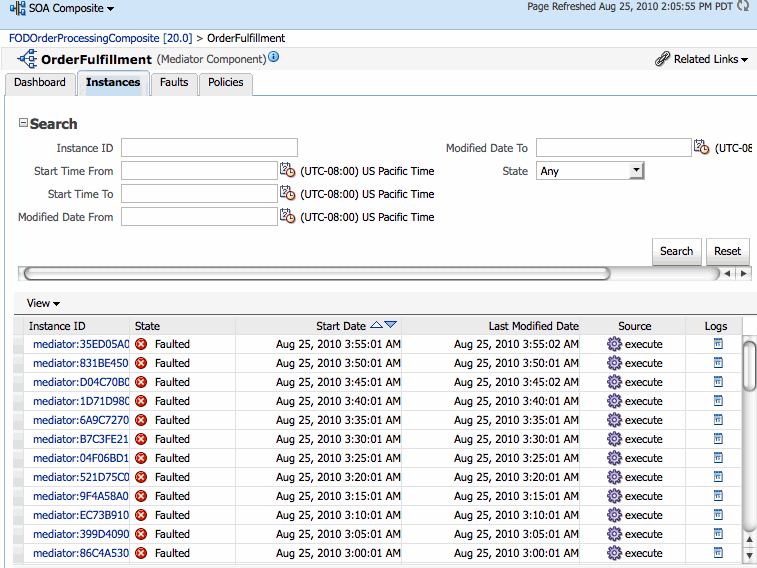
Description of the illustration med_comphome_inst.gif
-
To perform a search, enter criteria into any of the available fields, and then click Search. For the date and time fields, you can click the calendar icon next to the field to select a date or time. By default, instances are not displayed the first time you access this page. You must click Search to display any instances.
For information about the fields displayed on the Instances page, see Section 17.1.1, "Recent Instances Section."
17.2.3 Monitoring Oracle Mediator Service Component Faults
The Faults page of the Mediator Component home page lets you search for faults based on the specified criteria, to view information about faulted instances, and to recover or terminate multiple faults.
To monitor the faults for a Mediator service component:
-
Access the SOA Composite home page through one of the following options:
From the SOA Infrastructure Menu... From the SOA Folder in the Navigator... -
Select Home.
-
Select the Deployed Composites tab.
-
In the Composite section, select a specific SOA composite application.
-
Expand soa-infra, and then select a specific SOA composite application.
-
-
In the Component Metrics section, select the Mediator service component.
-
Click the Faults tab.
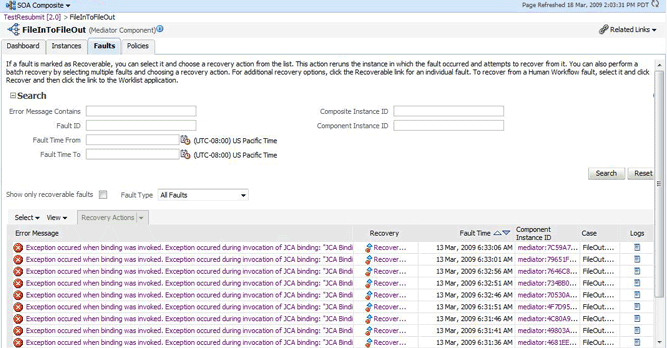
Description of the illustration med_comphome_flt1.gif
-
To perform a search, enter criteria into any of the available fields, and then click Search. For the date and time fields, you can click the calendar icon next to the field to select a date or time. By default, faults are not displayed the first time you access this page. You must click Search to display any faults.
For information about the fields displayed on the Faults page, see the Section 17.1.3, "Recent Faults Section." For information on handling faults, see Section 18.1, "Recovering From Oracle Mediator Service Component Faults."
17.2.4 Monitoring Oracle Mediator Routing Statistics
The Routing Statistics section of the Dashboard page in the Mediator Component home page displays the routing data of a source operation or subscribed event.
To monitor the routing statistics of a Mediator service component:
-
Access the SOA Composite home page through one of the following options:
From the SOA Infrastructure Menu... From the SOA Folder in the Navigator... -
Select Home.
-
Select the Deployed Composites tab.
-
In the Composite section, select a specific SOA composite application.
-
Expand soa-infra, and then select a specific SOA composite application.
-
-
In the Component Metrics section, select the Mediator service component.
-
Click the Dashboard tab.
-
In the Routing Statistics section, select a routing source from the Select Route Source list.

Description of the illustration med_rout_stats.gif
-
Expand the Route Target table.

Description of the illustration med_rout_stat2.gif
-
View the routing statistics for all targets in the Route Target table.
For information about the fields displayed in the Routing Statistics section, see Section 17.1.4, "Routing Statistics Section."
17.2.5 Monitoring Audit Trail and Fault Details for an Oracle Mediator Component Instance
You can click the links on the Mediator Component Dashboard, Instances, and Faults pages to view audit trail and fault information for the instance. You can also access this information from the Mediator Engine Dashboard, Instances, and Faults pages.
To view audit trail and fault details:
-
Access the SOA Composite home page through one of the following options:
From the SOA Infrastructure Menu... From the SOA Folder in the Navigator... -
Select Home.
-
Select the Deployed Composites tab.
-
In the Composite section, select a specific SOA composite application.
-
Expand soa-infra, and then select a specific SOA composite application.
-
-
In the Component Metrics section, select the Mediator service component.
-
Click the Dashboard tab, or click the Instances or Faults tab and perform a search.
-
Select the instance ID of the instance you want to view. On the Dashboard tab, you can click the instance ID from the Recent Instances or the Recent Faults section.
The Mediator Instance Details dialog appears with the audit trail displayed.
Figure 17-1 Mediator Component Instance Audit Trail
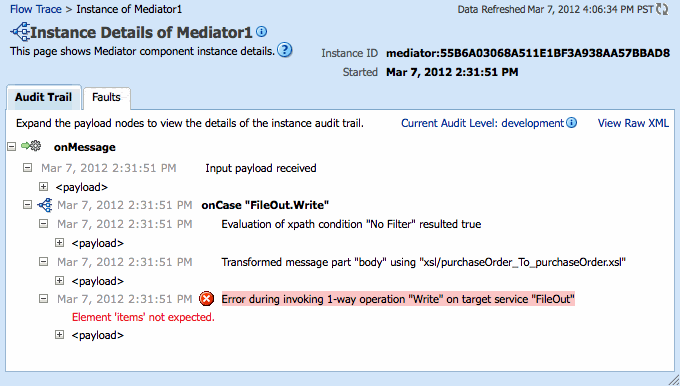
Description of "Figure 17-1 Mediator Component Instance Audit Trail"
-
To view a list of faults, click the Faults tab.
-
To view detailed information about a specific fault, click the fault in the Message column.
Figure 17-2 Mediator Component Instance Fault Details
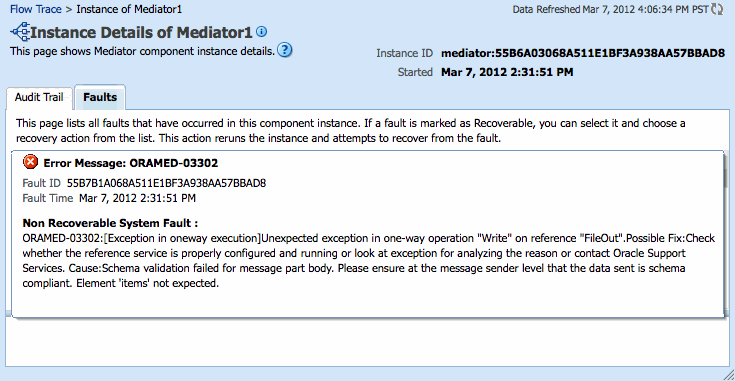
Description of "Figure 17-2 Mediator Component Instance Fault Details"
17.3 Monitoring Oracle Mediator Service Engine Instances and Faults
You can perform the following monitoring tasks at the Mediator service engine level from the Dashboard tab of the Mediator Engine home page in Oracle Enterprise Manager Middleware Control.
-
Monitoring Oracle Mediator Service Engine Recent Instances and Faults
-
Monitoring Deployed Oracle Mediator Service Components in the Service Engine
17.3.1 Monitoring Oracle Mediator Service Engine Recent Instances and Faults
To monitor Mediator service engine instances and faults:
-
Access the Mediator Engine home page through one of the following options:
From the SOA Infrastructure Menu... From the SOA Folder in the Navigator... -
Select Service Engines and then select Mediator.
-
Right-click soainfra, point to Service Engines and then select Mediator.
-
-
Click the Dashboard tab.
Description of the illustration med_engine_dash.gif
The Dashboard page displays the information described in Section 17.1, "Introduction to the Oracle Mediator Dashboard Pages."
-
In the Recent Instances section, perform any of the following tasks:
-
In the Instance ID column, click an instance ID to view its instance details, including an audit trail and faults.
-
In the Component column, click a service component name to view the home page for that component.
-
In the Composite column, click a composite name to view the home page for the SOA composite.
-
In the Logs column, click a log icon to access the Log Messages page with messages specific to that instance.
-
Click Show Only Running Instances to view only those instances that are in the running state.
-
Click Show More below the section to access the Instances page of the service engine and view all instances of the service engine.
-
-
In the Components section, perform any of the following tasks:
-
In the Name column, click a service component name to view the Mediator Component Dashboard for that service component.
-
In the Composite column, click the name of a SOA composite to view the home page for that composite.
-
Click Show More below the section to access the Deployed Components page of the service engine and view all deployed Mediator components.
-
-
In the Recent Faults section, perform any of the following tasks:
-
In the Error Message column, click an error message to display complete information about the fault. If the fault is identified as recoverable, click Recover Now to perform fault recovery.
-
In the Recovery column, click a fault identified as Recoverable to perform fault recovery at the service engine level.
-
In the Composite column, click a composite name to view the home page for the SOA composite.
-
In the Component column, click a service component name to view the home page for that component.
-
In the Component Instance ID column, click an instance ID to view its instance details, including an audit trail and faults.
-
In the Logs column, click a specific log to access the Log Messages page with filtered messages specific to that instance.
-
Click Show only system faults to display only the faults that were caused by a system error. System faults are related to system failure issues, such as a database or network being inaccessible.
-
Click Show More below the section to access the Faults page of the service engine and view all service engine faults.
-
For more information, see Section 1.2.3, "Introduction to SOA Composite Application Instances". For information about viewing and searching log files, see Oracle Fusion Middleware Administrator's Guide.
17.3.2 Monitoring Oracle Mediator Service Engine Instances
You can monitor all Mediator service component instances running in the service engine from the Mediator Engine home page. These service components can be part of several SOA composite applications.
To monitor Mediator service engine instances:
-
Access the Mediator Engine home page through one of the following options:
From the SOA Infrastructure Menu... From the SOA Folder in the Navigator... -
Select Service Engines > Mediator.
-
Right-click soa-infra.
-
Select Service Engines > Mediator.
-
-
Click the Instances tab.
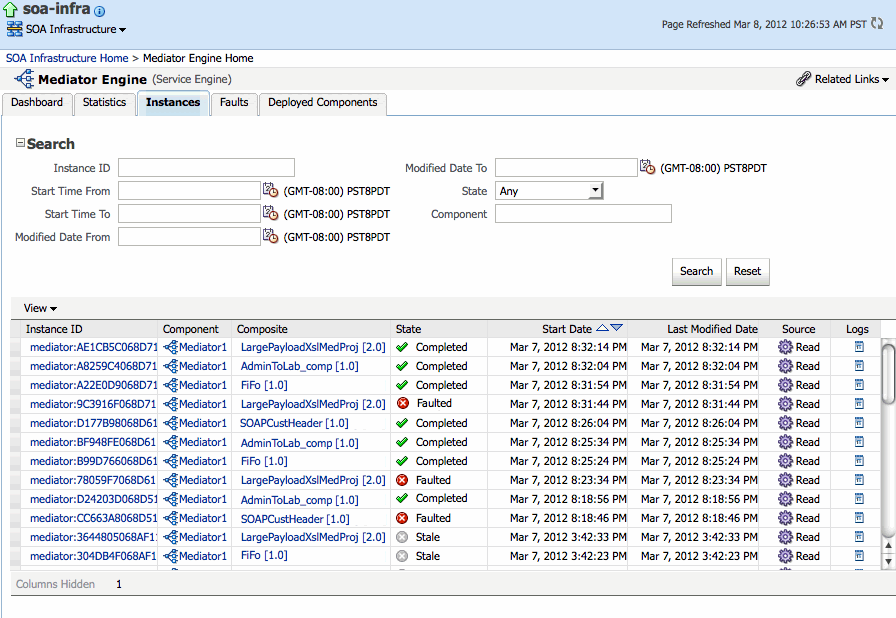
The Instances page includes two sections. The upper section lets you search for the instances to view and the lower section displays information about the instances returned by the search.
Description of the illustration med_instances.gif
-
In the Search section, enter any of the search criteria and click Search. To clear the search fields, click Reset. By default, instances are not displayed the first time you access this page. You must click Search to display any instances.
-
In the Instances section, perform any of the following monitoring tasks:
-
In the Instance ID column, click an instance ID for a service component to view its audit trail, process flow, and faults.
-
In the Component column, click a specific service component to access its home page.
-
In the Composite column, click a specific SOA composite application to access its home page.
-
In the Logs column, click a specific log to access the Log Messages page with filtered messages specific to that instance.
-
For more information, see Section 1.2.4, "Introduction to Service Components and Service Component Instances."
17.3.3 Monitoring Request Breakdown Statistics
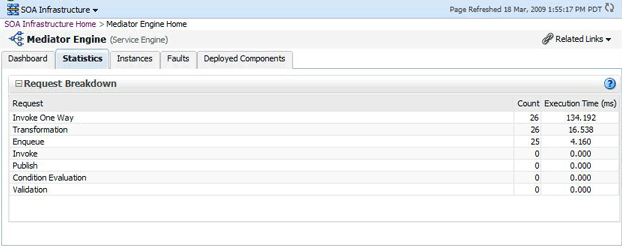
You can assess the efficiency level of the Mediator service engine by monitoring the request breakdown statistics.
To monitor the request breakdown statistics of the currently deployed Mediator service components:
-
Access the Mediator Engine home page through one of the following options:
From the SOA Infrastructure Menu... From the SOA Folder in the Navigator... -
Select Service Engines > Mediator.
-
Right-click soa-infra.
-
Select Service Engines > Mediator.
The Mediator Engine home page appears.
-
-
Click the Statistics tab.
-
View the request breakdown statistics.
Description of the illustration med_srveng_stat.gif
The Request Breakdown section provides information about the count and the average time taken for processing the following actions:
-
Invoke One Way: One-way invocations from the Mediator service engine.
-
Transformation: Transforming messages in the Mediator service engine.
-
Enqueue: Dehydrating messages for parallel routing rules.
Note:
Dehydrating of messages means storing the incoming messages in the database for parallel routing rules for processing later by worker threads.
-
Invoke: Request-response invocations from the Mediator Service Engine.
-
Publish: Publishing events from the Mediator service engine.
-
Condition Evaluation: Filtering conditions for evaluation by the Mediator service engine.
-
Validation: Message validations by the Mediator service engine.
-
17.3.4 Monitoring Deployed Oracle Mediator Service Components in the Service Engine
You can monitor all deployed SOA composite applications with Mediator service components running in the service engine.
To monitor deployed Mediator components in service engines:
-
Access the Mediator Engine home page through one of the following options:
From the SOA Infrastructure Menu... From the SOA Folder in the Navigator... -
Select Service Engines > Mediator.
-
Right-click soa-infra.
-
Select Service Engines > Mediator.
-
-
Click the Deployed Components tab.
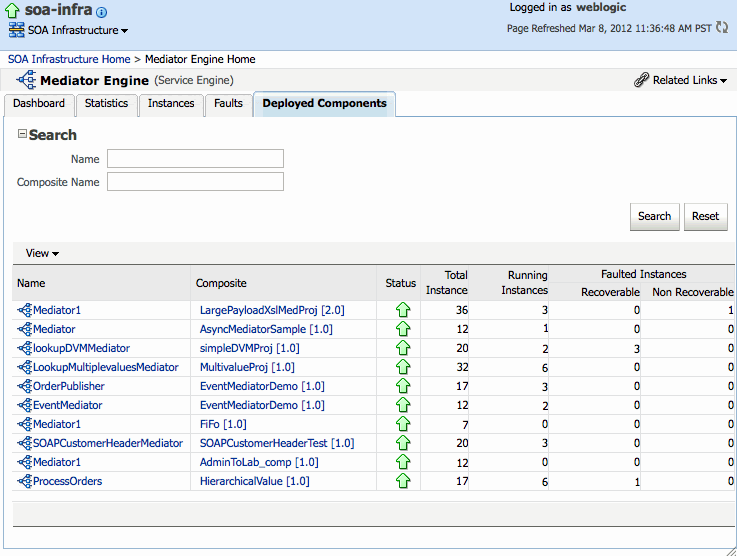
The Deployed Components page includes two sections. The upper section lets you search for the components to view and the lower section displays information about the components returned by the search.
Description of the illustration med_depl_comps.gif
-
In the Name column, click a specific service component to access its home page.
-
In the Composite column, click a specific SOA composite application to access its home page.
17.4 Monitoring Resequenced Messages
You can monitor the resequenced messages from the Mediator Component home page and the Mediator Instance Dialog. The following topics describe the monitoring processes:
-
Section 17.4.1, "Monitoring Resequenced Messages from the Mediator Service Component Home Page"
-
Section 17.4.2, "Monitoring Resequenced Messages from the Mediator Instance Dialog"
17.4.1 Monitoring Resequenced Messages from the Mediator Service Component Home Page
On the Mediator Component home page, the Dashboard, Instances, and Faults pages include additional fields for monitoring components that use the resequencing feature. These additional fields only appear when the Mediator service component you are monitoring includes a resequencer.
17.4.1.1 Dashboard Page
The Dashboard page of the Mediator Component home page has one additional column, Group, in the Recent Instances and Recent Faults tables. This field contains the group ID of the resequenced messages. If you click the group ID for a row, additional information about the group appears. For more information, see Section 17.4.1.4, "Mediator Resequencing Group Dialog." For more information about the Dashboard page, see Section 17.1, "Introduction to the Oracle Mediator Dashboard Pages."
17.4.1.2 Instances Page
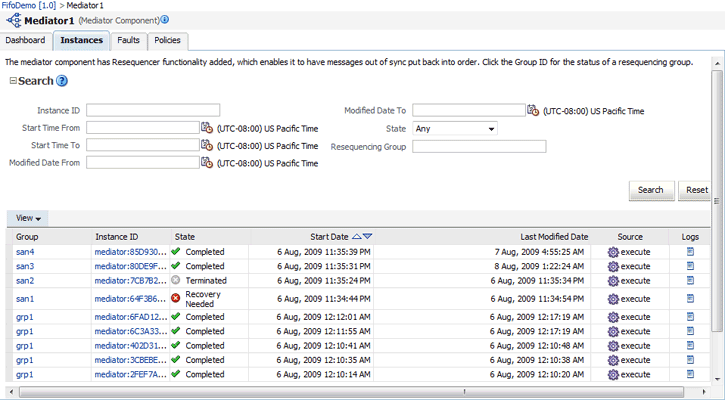
As shown in Figure 17-3, the Instances page of the Mediator Component home page provides an additional search field, Resequencing Group, so you can search for a Mediator component instance based on group criteria. The Instances section, which displays information about Mediator service component instances that match the search criteria, has one additional column, Group. This column contains the group ID of the resequenced messages. If you click the group ID for a row, additional information about the group appears. For more information, see Section 17.4.1.4, "Mediator Resequencing Group Dialog." For more information about the Instances page, see Section 17.2.2, "Monitoring Oracle Mediator Service Component Instances."
Figure 17-3 Instances Page for Resequenced Messages
Description of "Figure 17-3 Instances Page for Resequenced Messages"
17.4.1.3 Faults Page
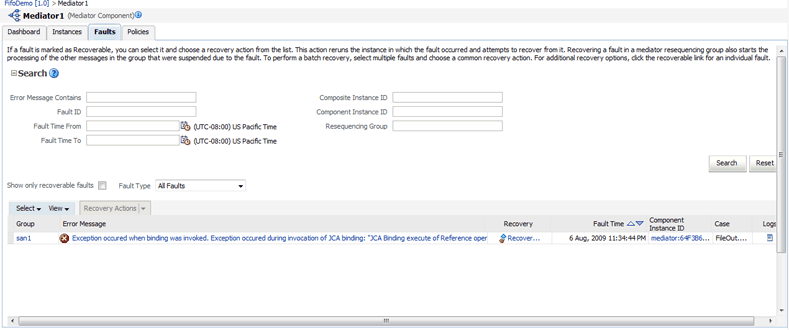
As shown in Figure 17-4, the Faults page of the Mediator Component home page provides an additional search field, Resequencing Group, so you can search for Mediator service component instances based on group criteria. The Faults section, which displays information about Mediator component instances that match the search criteria, provides one additional column, Group. This column contains the group ID of the resequenced messages. If you click the group ID for a row, additional information about the group appears. For more information, see Section 17.4.1.4, "Mediator Resequencing Group Dialog." For more information about the Faults page, see Section 18.3, "Recovering From Oracle Mediator Service Engine Faults."
Figure 17-4 Faults Page for Resequenced Messages
Description of "Figure 17-4 Faults Page for Resequenced Messages"
17.4.1.4 Mediator Resequencing Group Dialog
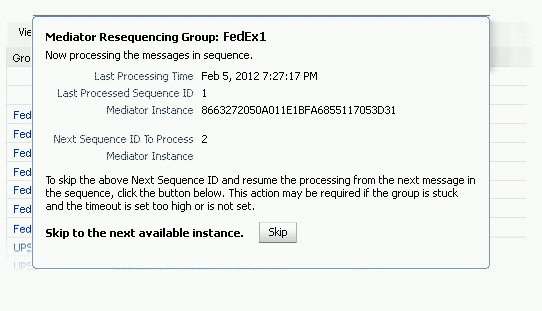
If all the messages in a group are processed without any fault or timeout interval, the Mediator Resequencing Group dialog displays a message indicating that the group is working. For standard resequencer groups, this dialog also provides an option to skip the next sequence ID and resume processing from the following message in the sequence. In this case, the group is still running, but might be waiting for a message that will never arrive. Figure 17-5 illustrates the dialog.
Figure 17-5 Mediator Resequencing Group Dialog
Description of "Figure 17-5 Mediator Resequencing Group Dialog"
The Mediator Resequencing Group dialog provides the following information about a group:
-
Whether the group is timed-out or faulted
-
The blocking message in the group, if any
-
The next message to be processed after the group is unlocked
-
The time after which the processing of the messages in the group stopped
-
The instruction text to unlock the group
When processing of messages in a group is suspended due to a fault or a timeout, the Mediator Resequencing Group dialog provides information about the suspended group. The processing of messages in a group can be suspended for the following reasons:
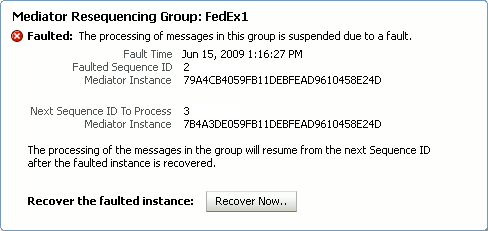
A group is in the faulted state when one of its messages throws an error while it is processed, as shown in Figure 17-6. The following information is displayed for a faulted group:
-
The sequence ID of the faulted message
-
The sequence ID of the next message to processed, along with its Mediator Instance ID
Click Recover Now to access the Faults page of the Mediator Instance Details page to perform single fault recovery.
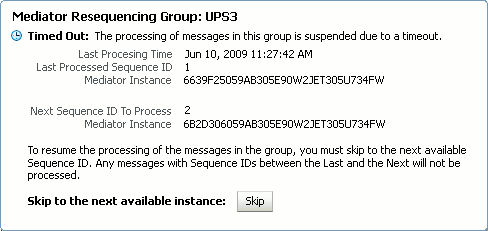
A group is in the timed-out state when processing of the group stops while waiting for an expected message, as shown in Figure 17-7. The following information is displayed for a timed-out group:
-
The sequence ID of the last processed message
-
The sequence ID of the next message to be processed, along with its Mediator Instance ID
Click Skip to unlock the group and start processing the next available instances in the group.
Group Is Faulted Due to a System Error
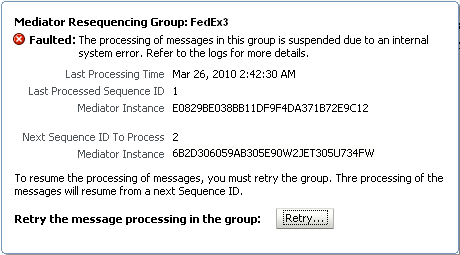
A group can be in a faulted state when processing of the group is suspended due to a system error, as shown in Figure 17-8. This is a special case for a Faulted Group; the group is not timed out and there is no faulted message for the group. The groups in this state can be described as Errored Groups. The following information is displayed for an Errored Group:
-
The sequence ID of the last processed message
-
The sequence ID of the next message to be processed, along with its Mediator Instance ID
Click Retry to unlock the group and start processing the next instances in the group.
Figure 17-8 Group Is Faulted Due to a System Error
Description of "Figure 17-8 Group Is Faulted Due to a System Error"
17.4.2 Monitoring Resequenced Messages from the Mediator Instance Dialog
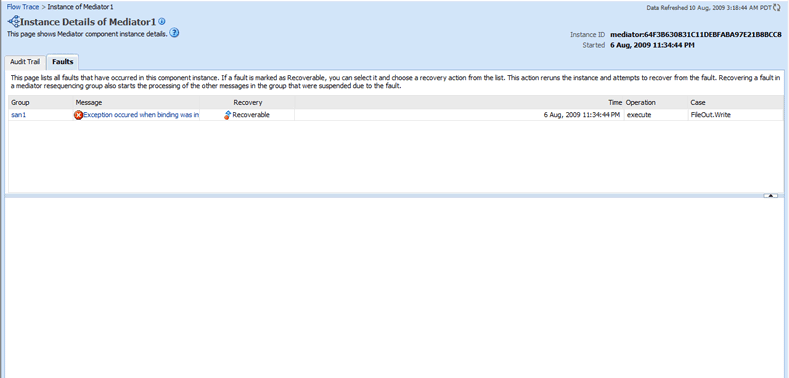
The Faults page of the Mediator Instance Details dialog provides the following resequencer-specific information:
-
Group ID of the resequenced message
-
Operation performed on the resequenced message (Figure 17-9)
For more information about the Mediator Instance Details dialog, see Figure 17-0.
Figure 17-9 Resequenced Message Faults on the Mediator Instance Details Dialog
Description of "Figure 17-9 Resequenced Message Faults on the Mediator Instance Details Dialog"
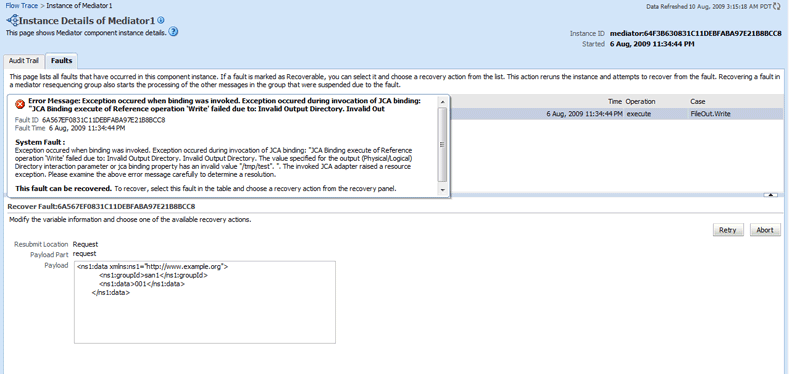
If you click a fault message, more information about the fault appears, as shown in Figure 17-10. If you click Retry, the Mediator service engine tries to reprocess the message. If you click Abort, the Mediator service engine terminates the faulted message, unlocks the group, and then resumes processing from the next message in the sequence.
Figure 17-10 Fault Message Details for Resequenced Messages
Description of "Figure 17-10 Fault Message Details for Resequenced Messages"
