28 Monitoring Oracle User Messaging Service
This chapter describes how to monitor Oracle User Messaging Service by using Oracle Enterprise Manager Fusion Middleware Control.
This chapter includes the following sections:
28.1 Monitoring Oracle User Messaging Service
You can monitor Oracle User Messaging Service logs and metrics using Oracle Enterprise Manager Fusion Middleware Control.
To monitor Oracle User Messaging Service:
-
Go to the Oracle Enterprise Manager Fusion Middleware Control page for your SOA farm.

Description of the illustration ns_login.gif
-
Select Fusion Middleware > SOA > User Messaging Service.
-
Select the server or driver of your choice.
If you select a driver, quick statistics are displayed that indicate the state and performance of the driver.
If you select a server, you see a list of associated drivers, in addition to the quick statistics. You can select one of the drivers to view its statistics, or you can click the Configure Driver icon to configure it. For more information on configuring drivers, see Chapter 27, "Configuring Oracle User Messaging Service."

Description of the illustration ns_configdrv.gif
-
Right-click the server to select an action.
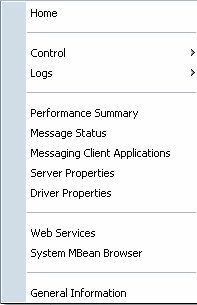
Selection Action Home
The home page lists the quick statistics for the selected driver.
Control
Start Up or Shut Down driver.
Logs
View and configure message logs for the selected driver.
Performance Summary
Displays performance statistics on a customizable metrics page. Use this page to view statistics for this driver. Customize this page using the Metric Palette. The Metric Palette enables you to choose from all of the available metrics so that you see only the information that is most valuable to you.
Message Status
Check the delivery status of messages sent and received, and resend selected messages. You can filter the search by adding more search fields and setting the desired operator and search value. Some fields can be added multiple times to use them with different and complementary operators, or with the Contains operator.
Messaging Client Applications
Messaging client applications registered with the User Messaging Service can be manually deregistered in cases where the applications have been undeployed and are holding onto access points that must be made available to other applications.
Server Properties
Configure message storage method and business terms for message filter creation. See Chapter 27, "Configuring Oracle User Messaging Service" for more information.
System MBean Browser
System MBean Browser and its configuration settings.
General Information
General Information displays the name, version, Oracle home, and host for the selected driver.
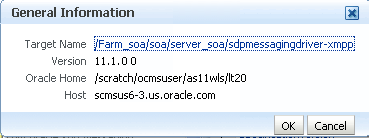
Description of the illustration ns_geninfo.gif
28.1.1 Using Message Status
You can check the delivery status of messages sent and received, and resend selected messages.
To check message status:
-
In the navigation tree, right-click the UMS target for which you want to view message status.
-
Select Message Status. The Message Status page appears.
-
Click Search to search the messages using the default criteria. The search returns a listing for the messages.
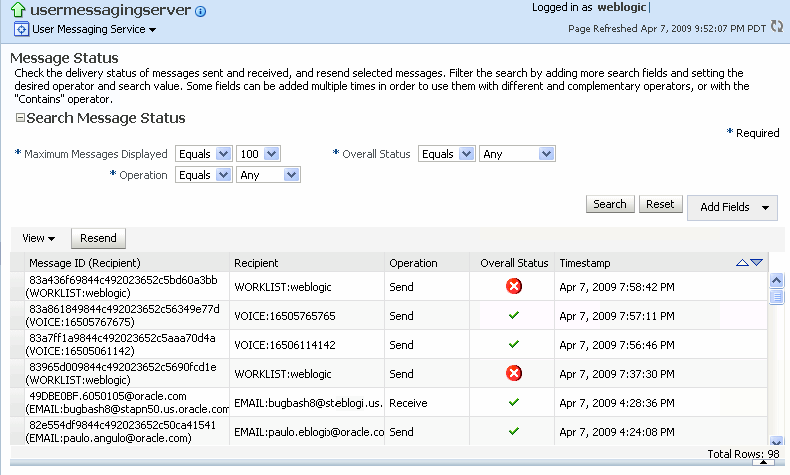
Description of the illustration ns_msgstatus.gif
You can customize the search by adding more search fields and setting the desired operator and search value. Some fields can be added multiple times to use them with different and complementary operators, or with the Contains operator. To customize the search:
-
Click Add Fields.
-
Select the field(s) on which you want to search.
-
Choose operators and fill in variables as needed.
-
Click Search. The customized search is done and results returned.

Description of the illustration ns_msgcust.gif
-
If you want to resend a message, select the message in the list and click Resend.
28.1.2 Deregistering Messaging Client Applications
You can manually deregister Messaging Client Applications after the applications have been undeployed and are holding onto access points that must be made available to other applications. To deregister Messaging Client Applications:
-
Right-click a target in the navigation tree, and select Messaging Client. The Messaging Client page appears.
-
Select the message to deregister.
-
Click De-register.

Description of the illustration ns_mca.gif
A confirmation box appears asking you to confirm your choice.
-
Confirm your choice.
28.1.3 Monitoring Drivers Using the All Tab
The All tab only lists successfully-registered drivers in the domain (not all drivers that exist).
Since the drivers are not configured out-of-the-box, they are not registered unless you configure them. To ensure that you see all of the drivers in the All tab, configure the SMPP, VoiceXML and XMPP drivers (if you plan to use them). Once configured, they are registered with the engine and are displayed in the All tab.
28.2 Viewing Log Files
You can view log files.
To view log files:
-
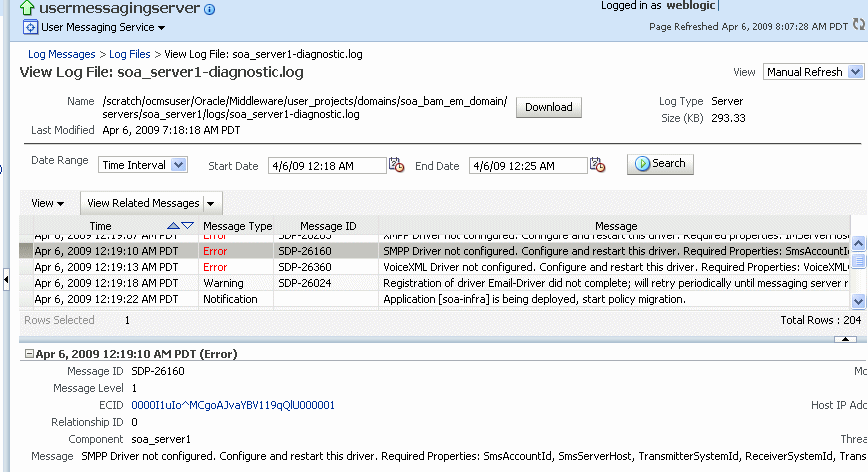
Right-click the driver (or server) for which you want to view log information, then choose Logs > View Log Files.
The Log Messages page appears.
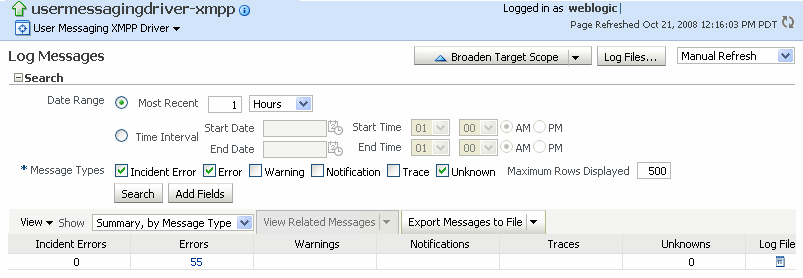
Description of the illustration ns_logme.gif
Use this page to query for log information about a driver (or server). Fields and lists are used to customize the query.
-
After entering your search criteria, click Log Files. The Log Files page appears.
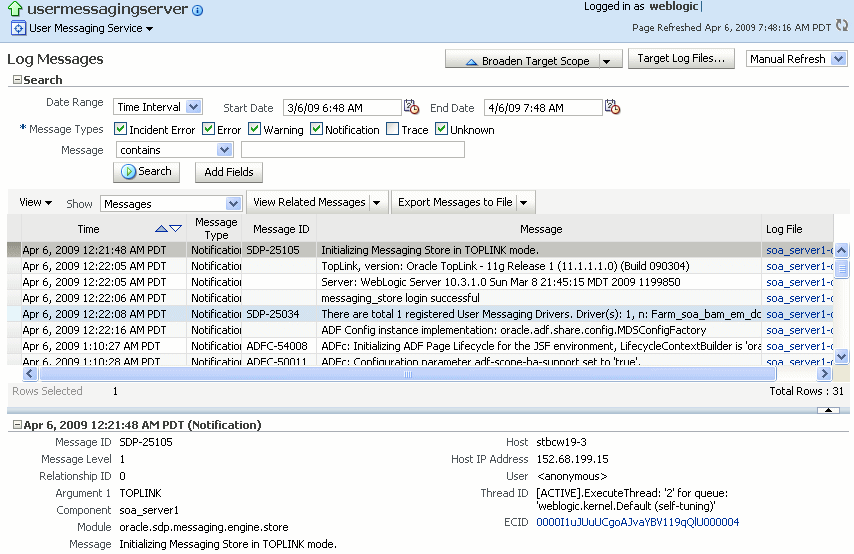
Description of the illustration ns_five.gif
-
View log information or download the log.
28.2.1 Configuring Logging
Use Oracle Enterprise Manager Fusion Middleware Control to configure log levels, as shown in Figure 28-1.
For each logger, set the notification level, as shown in Figure 28-2.
As a result of your configuration actions, notifications appear according to your specification. Figure 28-3 and Figure 28-4 provides details.
28.3 Viewing Metrics and Statistics
The performance of your applications is reflected in metrics and statistics.
To view metrics and statistics:
-
Select the Performance Summary for a driver (or server).
The Performance Summary page appears.

Description of the illustration ns_fourteen.gif
Many metrics are available for capture and display. To get the most valuable, focused information, use Metric Palette.
-
Click Show Metric Palette to display the Metric Palette.
-
Choose the metrics in which you are most interested. As you select or deselect metrics from the palette, the metrics display is automatically updated.

Description of the illustration ns_fifteen.gif


