46 Monitoring Oracle Service Bus at Runtime
The chapter describes the Oracle Service Bus (OSB) monitoring framework, including statistics, alerts, operational settings, and the OSB Administration Console dashboard.
Oracle Service Bus enables you to monitor and collect runtime information required for system operations. Oracle Service Bus aggregates runtime statistics, which you can view on the dashboard. The dashboard lets you monitor the health of the system and notifies you when alerts are generated in your services. With this information, you can quickly and easily isolate and diagnose problems as they occur.
This section provides information on the following topics:
-
Section 46.3, "What are the Consequences of Renaming or Moving a Service?"
-
Section 46.4, "What Statistics Are Available for Oracle Service Bus Services?"
-
Section 46.5, "Accessing Statistical Information for Services"
-
Section 46.7, "What are Operational Settings for a Service?"
-
Section 46.8, "SLA Alerting Functionality in Oracle Service Bus"
46.1 What is Service Monitoring?
You can monitor Oracle Service Bus at runtime to know how many messages in a particular service have processed successfully and how many have failed.
The Oracle Service Bus monitoring framework provides access to information about the number of messages that were processed successfully or failed, which project the service belongs to, the average execution time of message processing, and the number of alerts associated with the service. Using the Oracle Service Bus Administration Console you can view monitoring statistics for the period of the current aggregation interval or for the period since you last reset statistics for this service or since you last reset statistics for all services. Using the public APIs you can access only the statistics since the last reset.
46.1.1 About the Oracle Service Bus Monitoring Framework
Monitoring in Oracle Service Bus involves monitoring of the operational resources, servers, and Service Level Agreements (SLAs). Figure 46-1 is an illustration of the architecture of the Oracle Service Bus monitoring framework.
Figure 46-1 Monitoring Framework in Oracle Service Bus
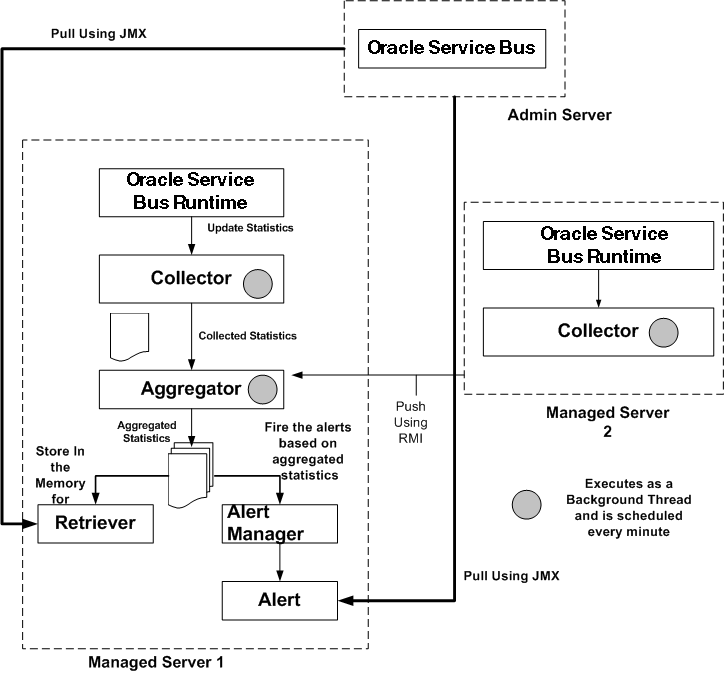
Description of "Figure 46-1 Monitoring Framework in Oracle Service Bus"
Oracle Service Bus monitoring architecture consists of the following components:
-
Collector–Each Managed Server in a cluster hosts a Collector. The Collector collects statistics on operational resources at regular intervals of time, which is managed in a RMI object. It also keeps samples history within the aggregation interval for the collected statistics.
Oracle Service Bus runtime invokes a collector at the beginning of each minute. At every system-defined checkpoint interval, it stores a snapshot of current statistics into a persistent store for recovery purposes and sends the information to the Aggregator in raw format, as raw format is optimized for fast collection and small footprint.
Note:
An operational resource is defined as the unit for which statistical information can be collected by the monitoring subsystem. Operational resources include proxy services, business services, service level resources such as Web Services Definition Language (WSDL) operations, flow components in a pipeline, and endpoint URIs. -
Aggregator–The Aggregator is present only on only one Managed Server. The server on which this resides is selected arbitrarily when you generate domain using the config wizard. It aggregates all the statistics that are collected from all Managed Servers across all Managed Servers in a cluster.
Oracle Service Bus runtime invokes the aggregator twenty-five seconds past each minute, to enable collectors to collect data and send it to the aggregator. At system-defined checkpoint intervals, each Managed Server in the cluster sends a snapshot of its contributions to the Aggregator. Data structures in aggregator are optimized for aggregating and retrieving data.
-
Retriever–The Retriever retrieves the statistics that are stored in the memory. This is present only in that Managed Server, which contains the aggregator.
-
Alert Manager–The alert manager fires alerts based on the aggregated statistics. This is present only in that Managed Server, which contains the aggregator.
The Collector collects the updated statistics from Oracle Service Bus runtime and sends it to Aggregator.The Aggregator aggregates the statistics over the aggregation interval. The aggregated statistics are pushed to the Alert Manager. The Alert Manager triggers alerts based on these statistics. The aggregated statistics are also stored and can be retrieved by the Retriever. The following steps are executed when you monitor a service in Oracle Service Bus runtime:
In a cluster, all the statistics which are collected in the Managed Servers are pushed to the aggregator. You can access the cluster wide statistics from the Service Health tab. For more information, see Section 46.5.3, "How to Access Statistics in a Cluster." You can also access statistics using APIs. For more information, see Section 46.5.2, "How to Access Statistical Information Using the JMX Monitoring APIs."
The alerts are pulled from the Managed Server that hosts the aggregator, and they are displayed in the Oracle Service Bus Administration Console.
46.2 Aggregation Intervals
In Oracle Service Bus, the monitoring subsystem collects statistics, such as message count over an aggregation interval. The aggregation interval is the time period over which statistical data is collected and displayed in the Oracle Service Bus Administration Console. Statistics which are not based on an aggregation interval are meaningless. In addition to statistics collected over well-defined aggregation interval you can also collect cumulative statistics.
46.2.1 The Refresh Rate of Monitoring Data
Aggregation interval is a moving window, which always refers to an interval of time in minutes, hours or days. It does not move with infinite granularity or precision, but at regular intervals of time called the sampling interval. This enables an aggregation interval to move smoothly and produce accurate statistics.
Figure 46-2 Illustration of Aggregation Interval and Sampling Interval
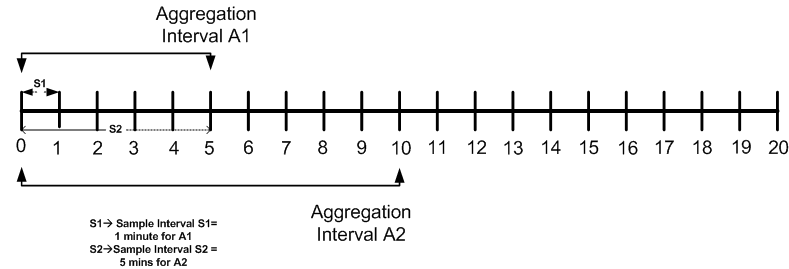
Description of "Figure 46-2 Illustration of Aggregation Interval and Sampling Interval"
Figure 46-2 is an illustration of the of Aggregation interval. For example aggregation interval A1 is set at five minutes and aggregation interval A2 has been set at ten minutes. Oracle Service Bus runtime collects statistics for the service with aggregation interval A1 for every minute (S1). It aggregates the statistics at the end of the aggregation interval.
Similarly for aggregation interval A2 it collects statistics for every five minutes (S2). Intervals S1 and S2 are called sampling intervals. For more information about sample interval, see Section 46.2.2, "Sample Intervals Within Aggregation Intervals."
46.2.2 Sample Intervals Within Aggregation Intervals
In Oracle Service Bus runtime statistics are computed at regular intervals, within every aggregation interval. These regular sub intervals are known as the sample interval. The duration of the sample interval depends on the aggregation interval. Table 46-1 gives the length of sample interval for different aggregation intervals:
| Aggregation Interval | Sample Interval |
|---|---|
|
1, 2, 3, 4, and 5 minutes |
1 minute |
|
10, 15, 20, 25, and 30 minutes |
5 minutes |
|
40, 50, and 60 minutes |
10 minutes |
|
90 and 120 minutes |
30 minutes |
|
3, 4, 5, and 6 hours |
1 hour |
|
8, 10, and 12 hours |
2 hours |
|
16, 20, and 24 hours |
4 hours |
|
2, 3, 4, 5, 6, and 7 days |
1 day |
46.2.3 How to Set the Aggregation Interval for Monitoring Data
Aggregation interval in Oracle Service Bus has the following properties:
-
You can track statistics for a service over only one aggregation interval.
-
You cannot set an arbitrary value for an aggregation interval. You must choose from one of the values in the list.
-
You can set the aggregation interval for the following:
-
A service–You must set the aggregation interval for a service in Operation tab of View a Proxy service or View a Business Service page. For more information about how to set aggregation interval for a service, see Section 26.10, "Setting the Aggregation Interval for a Service."
-
An alert rule–You must set the aggregation interval for an alert rule by editing Conditions on View Alert Rule Details page. For more information about how to edit conditions for an alert rule, see Section 26.23.2, "Defining Alert Rule Conditions."
-
You can only specify an aggregation interval less than or equal to seven days.
46.2.4 What are the Consequences Of Changing Aggregation Interval Of A Service?
When you modify the aggregation interval of a service, the statistics of the service in the current aggregation interval is reset. However, the status of the endpoint URI for the service remains unaffected by the change in the aggregation interval. A running count metrics of the service is not reset when modify the aggregation interval.
46.3 What are the Consequences of Renaming or Moving a Service?
When you rename or move a service within Oracle Service Bus, all the monitoring statistics that have been collected in the Oracle Service Bus Administration Console are lost. All current aggregation interval and cumulative metrics are reset and the service is monitored from start. If endpoint URI for a service was marked offline before it was renamed or moved, then after you rename or move the service, the URIs are marked online again and the status of the URI is displayed as online.
46.4 What Statistics Are Available for Oracle Service Bus Services?
You can monitor services in Oracle Service Bus and collect statistics for all services. Monitoring system in Oracle Service Bus supports the following types of statistics:
-
Counter–A counter simply keeps track of the count of events in Oracle Service Bus runtime such as number of messages received and number of failovers. This is scalar and takes on integral values.
-
Interval–An interval keeps track of time elapsed between two well-defined events. This tracks the total, average, minimum, and maximum of such events in Oracle Service Bus. This takes on integral and non-integral values.
-
Status Type–A Status statistic keeps track of the status. Using this you can keep track of the initial status and the current status of the object.
For more information about different types of statistics, see Appendix F, "Monitoring Statistics in Oracle Service Bus." For more information on how to access statistics using APIs, see Section 46.5.2, "How to Access Statistical Information Using the JMX Monitoring APIs."
46.5 Accessing Statistical Information for Services
You can access the statistical information for a service through the Oracle Service Bus Administration Console or directly by using the JMX monitoring APIs. This section describes accessing the information through the Oracle Service Bus Administration Console and the JMX monitoring APIs. For more information about accessing the statistical information through JMX monitoring APIs, see Appendix D, "JMX Monitoring API."
46.5.1 How to Access Service Statistics from the Oracle Service Bus Administration Console
You can access the service statistics from the Oracle Service Bus Administration Console for a stand alone server or a cluster. This section describes how to access statistics for a standalone server. For information on how to access service statistics for a cluster, see Section 46.5.3, "How to Access Statistics in a Cluster."
In the you can access the statistical information for services in the current aggregation interval or for time interval since the last reset. The Service Health tab of dashboard provides the statistical information for current aggregation interval and since last reset.
For more information, see Section 46.9.1, "How to Access Service Statistics for the Current Aggregation Interval" and Section 46.9.2, "How to Access Running Count Statistics for Services."
46.5.2 How to Access Statistical Information Using the JMX Monitoring APIs
You can also access statistical information directly from a program using the Java Management Extensions (JMX) monitoring APIs. Using the JMX monitoring APIs you can access only the running count statistics. The JMX monitoring APIs provide an efficient lower level support for bulk operations. For more information about using JMX monitoring APIs, see Appendix D, "JMX Monitoring API."
46.5.3 How to Access Statistics in a Cluster
In a cluster environment, statistics are available at individual Managed Server level and the cluster level. In Service Health tab choose Cluster or the name of a Managed Server from the Server list, to view statistics for the cluster or the individual Managed Server.
To get detailed statistics for a particular service in a cluster, access the service monitoring details page for the service from the Service Health tab. On the Service Monitoring Details page, you can access the cluster wide statistics by setting the Server list to Cluster. By setting it to the individual Managed Server value, statistics pertaining to that specific server can be viewed.
Set Display Statistics to Current Aggregation Interval to view cluster statistics in the current aggregation interval or Since Last Reset to view the running count statistics for the cluster.
46.5.4 How to Reset Statistics
You can reset the statistics of business services and proxy services from the Service Health tab of the dashboard or from the Service Monitoring Details page for a service. The following table describes how to reset statistics in each case.
| To Reset Statistics from | Description |
|---|---|
| Service Health Tab | Click the Service Health tab to go to the Service Health page. Click Reset Statistics icon to reset statistics for a service. Click Reset All Statistics link to reset statistics for all the services for which monitoring is enabled.
Note: The reset Statistics Icon is available only when you set Display Statistics to Since Last Reset.JMS For more information about how to reset statistics, see Section 26.7, "Resetting Statistics for Services." |
| Service Monitoring Details Page | Click the name of the service in the alert history table or on the Service Health page to go to the Service Monitoring Details page. In the Service Monitoring Details page in the Display Statistics field select Since Last Reset. Click Reset Statistics to reset the statistics for the given service. |
46.5.4.1 What are the Consequences of Resetting the Statistics?
When you reset statistics for a service in the Oracle Service Bus Administration Console, all the statistics collected for the service since the last reset is lost. You cannot undo this action. The status of endpoint URIs is not reset when you reset statistics.
46.6 The Role of Alerts in Service Monitoring
SLA alerts are raised in Oracle Service Bus to indicate potential violation of the Service Level Agreements (SLAs). You can use alerts for:
-
Monitoring and generating email notification of WS-Security errors.
-
Monitoring the number of messages passing through a particular pipeline.
-
Detecting the violation of service level agreements with third-party products.
-
Detecting a non-responsive endpoint.
Pipeline alerts can be raised in the message flow of the proxy service. You can use the alerts in a message flow for:
-
Detecting errors in a message flow.
-
Indicating business occurrences.
46.6.1 Assigning Severity for Alerts
You can configure the severity of an alert in an alert rule for SLA alerts or in the Alert action of a message flow of a proxy service. The severity level of alerts is user configurable and has no absolute meaning. You can configure alerts with one of the following levels of severity:
-
Normal
-
Warning
-
Minor
-
Major
-
Critical
-
Fatal
The alert destinations are notified when an alert is raised. For more information in alert destinations, see Section 46.6.7, "What are Alert Destinations?"
46.6.2 What are SLA Alerts?
SLA alerts are automated responses to violations of Service Level Agreements (SLAs). These alerts are displayed on the Oracle Service Bus dashboard. They are generated when the service violates the service level agreement or a predefined condition.
To raise an SLA alert, you must enable SLA alerting both at the service level and at the global level. For more information about how to configure operational settings for services, see Section 46.7.1, "How to Configure the Operational Settings for a Service." The Alert History panel contains a customizable table displaying information about violations or occurrences of events in the system.
You must define alert rules to specify unacceptable service performance according to your business and performance requirements. Each alert rule lets you specify the aggregation interval for that rule when configuring the alert rule. This aggregation interval is not affected by the aggregation interval set for the service.
For more information about aggregation interval, see Section 46.2, "Aggregation Intervals." Alert rules also allow you to send notifications to the configured alert destinations. For information on defining alert rules, see Section 26.23, "Creating and Editing Alert Rules."
46.6.2.1 A Sample Use Case for SLA Alerts
Consider the following use case to verify the service level agreements:
Assume that a particular proxy service is generating SLA alerts due to slow response time. To investigate this problem, you must log in to the Oracle Service Bus Administration Console and review the detailed statistics for the proxy service. At this level, you can able to identify that, a third-party Web service invocation stage in the pipeline is taking a lot of time and is the actual bottleneck.
You can use these alerts as the basis for negotiating SLAs. After successfully renegotiating SLAs with the third-party Web service provider, you must configure alert metrics to track the Web service provider's compliance with the new agreement terms.
46.6.3 What are Pipeline Alerts?
Pipeline alerts can be generated in a message flow whenever you define an Alert action available under the reporting category in the message flow.
You can also define conditions under which a pipeline alert is triggered using the conditional constructs available in the pipeline editor such as XQuery Editor or an if-then-else construct, and you select an Alert Destination resource to sent the alerts to.
You can have complete control over the alert body including the pipeline, and context variables. Also you can extract the portions of the message. For more information about how to configure Alert actions in a stage, see Section 21.25, "Adding Alert Actions." When the alert action is executed the alerts are notified to the appropriate alert destinations.
You can obtain an integrated view of all the pipeline alerts generated by a service on the dashboard page in the Oracle Service Bus Administration Console.
46.6.3.1 A Sample Use Case for Pipeline Alerts
Consider the following use case for pipeline alerts:
Consider a case when you want to be notified when special business conditions are encountered in a message flow. You can configure an alert action is a message flow to raise alerts when such predefined conditions are encountered. You can also configure email alert destination to receive an email notification of the alert. You can also send the details to the email recipient in the form of payload.
For example, in the case of a proxy service that routes orders to a purchase order website, and you want to be notified when an order exceeding $10 million is routed. For this you must configure an alert action in the appropriate place in the pipeline, with the condition and configure email alert destination with the email information and use it as the target destination in the alert action. You can also include the details of the order in the form of payload.
You can also use pipeline alerting to detect errors in a message flow. For example, in the case of a proxy service that validates the input document, you want to be notified when the validation fails so that you can contact the client to fix the problem.
For this you must configure an alert action within the error handler for the message flow of the proxy service. In the action you can include the actual error message in the fault variable and other details in the SOAP header, to be sent as the payload. You can also configure additional alert destinations using an alert destination resource in the alert action.
46.6.4 How to View or Delete SLA Alerts
In the Oracle Service Bus Administration Console the extended alert history page for the SLA alerts contains information about all the SLA alerts that have been generated in the domain. You can view all the alerts that were triggered or search for specific alerts from the table. For more information about data displayed in the extended SLA alert history page, see Section 26.3, "Locating Alerts."
You can delete the alerts from the Extended Alert History page or the View Alert Details page. You can filter your search using the Extended Alert History Filters pane. For more information on how to filter your search, see Section 46.6.6.1, "How to Filter a Search for SLA Alerts."
To view a pie or bar chart of the alerts, click View Bar Chart or View Pie Chart in the page. Click Purge SLA Alert History to delete all the SLA alerts. You can also purge the alerts based on the date and time they were raised.
46.6.5 How to View or Delete Pipeline Alerts
The extended alert history page for the pipeline alerts contains information about all the pipeline alerts that have been generated in the domain. You can view all the alerts that were triggered or search for specific alerts from the table. For more information about data displayed in the extended pipeline alert history page, see Section 26.3, "Locating Alerts."
You can delete the alerts from the Extended Pipeline Alerts page or from the View Alert Details page. For more information on how to filter your search, see Section 46.6.6.2, "How to Filter a Search for Pipeline Alerts." To view a pie or bar chart of the alerts, click View Bar Chart or View Pie Chart link in the page. Click Purge Pipeline Alert History to delete all the pipeline alerts. You can also purge the alerts based on the date and time they were raised.
46.6.6 How to Filter a Search for Specific Alerts
Use Extended Alert History to filter a search for specific alerts. The following sections describe how to search for SLA alerts and pipeline alerts using extended alert history filters.
46.6.6.1 How to Filter a Search for SLA Alerts
Use Extended Alert History Filters pane to filter a search for SLA alerts. Table 46-2 describes the various criteria on which you can filter SLA alerts.
Table 46-2 Search Criteria for SLA Alerts
| Search Criterion | Description |
|---|---|
|
Date Range |
Use this to search for pipeline alerts that were generated in the given interval of time. You can set the interval in one of the following ways:
|
|
Alert Severity |
Specify the level of severity. The search result includes all the alerts that have the specified level of severity and above. |
|
Service |
Use this to search for a specific service. |
|
Service Type |
This is updated automatically when you search for a specific service. |
|
Alert Name |
Use this to search by alert name. |
46.6.6.2 How to Filter a Search for Pipeline Alerts
Use Extended Alert History Filters pane to filter a search for pipeline alerts. Table 46-3 describes the various criteria on which you can filter pipeline alerts.
Table 46-3 Search Criteria for Pipeline Alerts
| Search Criterion | Description |
|---|---|
|
Date Range |
Use this to search for pipeline alerts that were generated in the given interval of time. You can set the time interval in one of the following ways:
|
|
Alert Severity |
Specify the level of severity. The search result includes all the alerts that have the specified level of severity and above. |
|
Service |
Use this to search for a specific service. |
|
Service Type |
This is updated automatically when you search for a specific service. |
|
Alert Summary |
Use this to search by alert summary. |
46.6.7 What are Alert Destinations?
Alert destinations are resources to which alerts are sent. Alert rules require that you select a predefined alert destination for handling alerts. Alert destinations give you the flexibility configure whether alerts are sent to SNMP traps, are collected for reporting, are logged to the local server's alert log, and sent to email recipients or JMS destinations.
With alert logging enabled, the Oracle Service Bus Administration Console provides information about the alerts generated due to SLA violations or as a result of alert actions configured in the pipeline. The dashboard page displays the overall health of Oracle Service Bus. It provides an overview of the state of the system comprising server health, services health, and alerts.
For more information about how to interpret the information on the dashboard, see Section 46.9, "The Oracle Service Bus Dashboard."
46.6.7.1 Email
Email alert destinations allow you to receive messages when alerts are raised in the Oracle Service Bus Administration Console. To configure this alert destination you have to use the SMTP server global resource or a JavaMail session in the Oracle WebLogic Server. For more information on configuring a default SMTP Server resource, see Section 31.8, "Configuring a Default SMTP Server." For more information about configuring JavaMail sessions, see "Configure Access to JavaMail" in the Oracle Fusion Middleware Oracle WebLogic Server Administration Console Online Help.
The SMTP server global resource captures the address of the SMTP server, port number, and if required, the authentication credentials. The authentication credentials are stored inline and are not stored as a service account. The alert manager makes use of the email alert destination to send the outbound email messages when both pipeline alerts and SLA alerts are generated. When an alert is delivered, an email metadata consisting of the details about the alert is prefixed to the details of the payload that is configured.
You can specify the email ID of the recipients in the Mail Recipients field. For more information about configuring an email alert destination, see Section 6.3.1, "Adding Email Recipients."
46.6.7.2 SNMP Traps
The Simple Network Management Protocol (SNMP) traps allow any third-party software to interface monitoring service level agreements within Oracle Service Bus. By enabling the notification of alerts using SNMP, Web Services Management (WSM) and the Enterprise Service Management (ESM) tools can monitor SLA violations and pipeline alerts by monitoring alert notifications.
SNMP is an application-layer protocol which allows the exchange of information on the management of a resource across a network. It enables you to monitor a resource and, if required, take some action based on the data obtained from the resource.
Both the SNMP version 1 and SNMP version 2 are supported by Oracle Service Bus. SNMP includes the following components:
-
Managed Resource
-
Management Information Base(MIB)
-
SNMP Agent
-
SNMP Manager
-
Network Management System (NMS)
For more information, see Appendix E, "SNMP Components."
46.6.7.3 Reporting
The Reporting destination lets you send notifications of pipeline alerts or SLA alerts to the custom reporting provider that can be developed using the reporting APIs provided with Oracle Service Bus. This allows third parties to receive and process alerts in custom Java code.
46.6.7.4 Alert Logging
Each alert destination lets you configure whether the alerts sent to that destination are logged. Logged alerts are sent to the local alert log. Each Oracle Service Bus server has its own alert log. In a cluster, the Admin Server collects the alert logs from all Managed Servers and aggregates the alerts in the Oracle Service Bus Administration Console.
46.6.7.5 JMS
Java Messaging Service (JMS) is another destination for pipeline alerts and SLA alerts. You must configure a JNDI URL for the JMS destination for alerts. When you configure an alert rule to post a message to a JMS destination, you must create a JMS connection factory and a queue or topic, and target them to the appropriate JMS server in the Oracle WebLogic Server Administration Console.
For information on how to do this, see Configuring a JMS Connection Factory and JMS Resource Naming Rules for Domain Interoperability in "Methods for Configuring JMS System Resources" in Oracle Fusion Middleware Configuring and Managing JMS for Oracle WebLogic Server. When you define the JMS alert destination you can either use a destination queue or a destination topic. The message type can be bytes or text. For more information about how to configure JMS alert destination see Section 6.3.2, "Adding JMS Destinations."
46.7 What are Operational Settings for a Service?
Operational settings enable you to control the state of a service in the Oracle Service Bus Administration Console. Table 46-4 describes operational settings for services in the Oracle Service Bus Administration Console.
Table 46-4 Operational Settings for Services in the Administration Console
| Operational Settings | Usage | Default Value When a Service is Created |
|---|---|---|
|
State |
Use this to enable or disable a service. |
Enabled |
|
Monitoring |
Use this to enable service monitoring at a specific level or above. You can also use this to disable service monitoring for proxy services. |
Disabled |
|
Aggregation Interval |
Use this to set the aggregation interval for the service. |
10 minutes |
|
SLA Alerts |
Use this to enable SLA alerting for services at a specific level of severity or above. You can also use this to disable SLA alerting for a service. |
Enabled |
|
Pipeline Alerts |
Use this to enable pipeline alerting for proxy services at a specific severity level or above. You can also use this to disable pipeline alerting for proxy services. |
Enabled at Normal level or higher |
|
Reports |
Use this to enable or disable message reporting for proxy services. |
Enabled at Normal level or higher |
|
Logs |
Use this to enable logging at a specific severity level or above. You can also use this to disable logging for proxy services. In proxy service log actions, the severity level of the log actions must match the Logging severity level on the proxy service operational settings. Note: To see log data in the log file or standard out (server console), Oracle WebLogic Server logging must be set to the following severity levels:
For information on setting log severity levels, see "Using Log Severity Levels" in Oracle Fusion Middleware Configuring Log Files and Filtering Log Messages for Oracle WebLogic Server. |
Enabled at Debug level or higher |
|
Execution Tracing |
Use this to enable or disable execution tracing for proxy services. Note: To see tracing in the log file or standard out (server console), Oracle WebLogic Server logging must be set to the following severity levels:
For information on setting log severity levels, see "Using Log Severity Levels" in Oracle Fusion Middleware Configuring Log Files and Filtering Log Messages for Oracle WebLogic Server. |
Disabled |
|
Message Tracing |
Use this to enable or disable message tracing for proxy services at a specific detail level or above. You can also set the payload limit (in kilobytes) and the default encoding. Note: See note for Execution Tracing. |
Disabled |
|
Offline Endpoint URIs |
Use this to enable or disable non responsive endpoints for business services. You can also specify the interval of time to wait before retrying the offline endpoint URI. You can enable or disable offline URIs for business services only. |
Disabled |
|
Throttling State |
Use this to enable or disable throttling for a business service. |
Disabled |
|
Maximum Concurrency |
Use this to restrict the number of messages that can be concurrently processed by a business service. |
0 |
|
Throttling Queue |
Use this to restrict the maximum number of messages in the throttling queue. |
0 |
|
Message Expiration |
The maximum time interval (in milliseconds) for which a message can be placed in throttling queue. |
0 |
|
Result Caching State |
Use this to enable or disable result caching for a business service |
Enabled Result caching is globally enabled by default |
The operational settings at the service level is overridden by the global settings. For more information about configuring operational settings globally, see Section 46.7.2, "How to Configure the Operational Settings at the Global Level."
46.7.1 How to Configure the Operational Settings for a Service
You can enable or disable the operational settings for an individual service from the Operation Settings view of the View a Proxy Service (see Figure 46-3) or View a Business Service page (see Figure 46-4). For more information, see Section 19.1, "Creating and Configuring Business Services" and Section 20.1, "Creating and Configuring Proxy Services."
Some operational settings such as service state, monitoring, SLA alerting, and pipeline alerting can enabled or disabled through public APIs. For more information, see Oracle Fusion Middleware Java API Reference for Oracle Service Bus.
Figure 46-3 View a Proxy Service Operational Settings
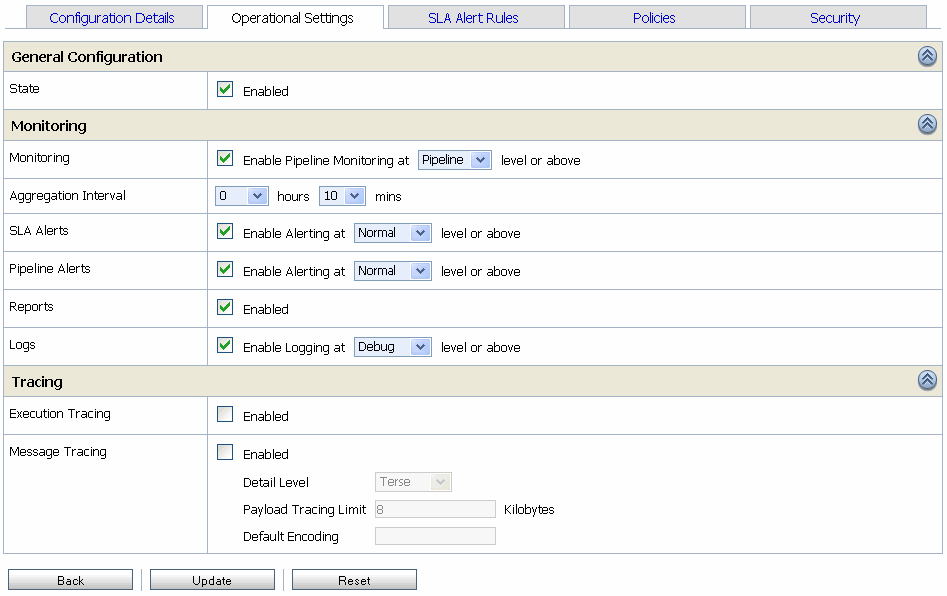
Description of "Figure 46-3 View a Proxy Service Operational Settings"
Figure 46-4 View a Business Service Operational Settings
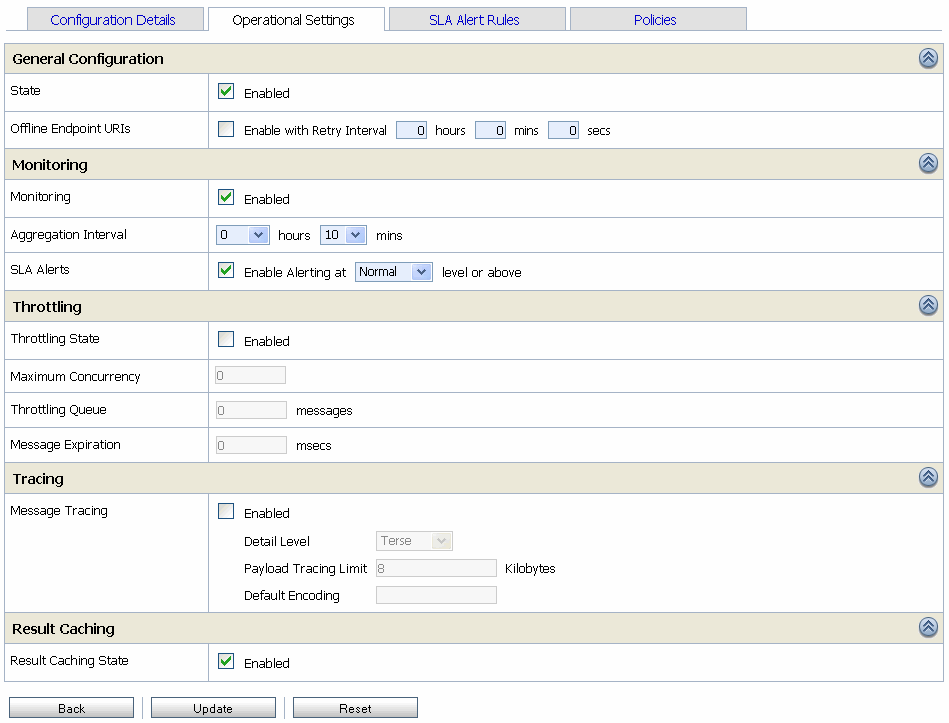
Description of "Figure 46-4 View a Business Service Operational Settings"
You can perform the following operational settings for proxy services and business services:
-
State
-
Aggregation Interval
-
Monitoring
-
SLA Alerting
-
Pipeline Alerting
-
Message Reporting
-
Tracing
-
Pipeline Logging
-
URI Offline Interval
-
Throttling settings
For a detailed description of the usage of each operational setting for business services, see Section 26.9, "Configuring Operational Settings for Business Services." For a detailed description of the usage of each operational setting for proxy services, see Section 26.8, "Configuring Operational Settings for Proxy Services."
46.7.2 How to Configure the Operational Settings at the Global Level
You can access the Global Settings page from the operations module. You can use the Global Settings page (see Figure 46-5) to configure the operational settings for services. Table 46-5 describes the usage of the operational settings at the global level.
Table 46-5 Usage of Operational Settings at the Global Level
| Operational Settings | Usage |
|---|---|
|
Monitoring |
Use this to enable monitoring for all services in a domain. Click the check box associated with Enable Monitoring to enable or disable monitoring for all the services in the domain. |
|
SLA Alerting |
Use this to enable SLA alerting for all services in a domain. Click the check box associated with Enable SLA Alerting to enable or disable monitoring for all the services in the domain. |
|
Pipeline Alerting |
Use this to enable pipeline alerting for proxy services in a domain. Click the check box associated with Enable Pipeline Alerting to enable or disable monitoring for all the services in the domain. |
|
Message Reporting |
Use this to enable message reporting for proxy services in a domain. Click the check box associated with Enable Reporting to enable or disable monitoring for all the services in the domain. |
|
Logging |
Use this to enable logging for proxy services in a domain. Click the check box associated with Enable Logging to enable or disable monitoring for all the services in the domain. |
|
Result Caching |
Use this to enable or disable result caching for business services in a domain. Even though you can configure business services to use result caching, this global option must be enabled for result caching to work. If you disable result caching globally, cached results for all business services enabled with result caching are flushed. |
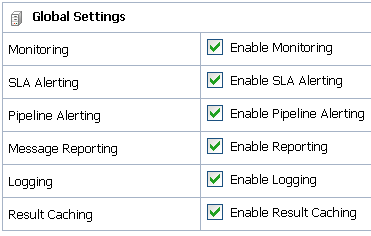
For more information, see Section 27.2, "Enabling Global Settings."
Notes:
The Enable Monitoring option lets you enable or disable monitoring of all services that have individually been enabled for monitoring. If monitoring for a particular service has not been enabled, you must first enable it and set the aggregation interval on the Manage Monitoring page before the system starts collecting statistics for that service.Enable or disable these settings at the global level in conjunction with the settings at the service level to effectively enable or disable them. The operational settings at the global level supersede the operational settings at the service level.
46.7.3 Updates to Operational Settings During Import of Oracle Service Bus Configurations
When a service is overwritten by the way of importing configuration from a config jar, the operational settings of this service can be also be overwritten. To preserve the operational settings during import, you must set the Preserve Operational Settings flag to true while importing the service. For more information, see Section 46.8.4, "What Happens to Alert Rules When You Import Oracle Service Bus Configurations?"
46.7.4 Updates to Global Settings During the Import of Oracle Service Bus Configurations
When you import Oracle Service Bus configurations, if the config jar that is being imported also contains the global settings of the domain from which it is being imported, then these domain level settings can get overwritten. In order to prevent this, set Preserve Operational Settings flag to true while importing the service.
46.7.5 How to Preserve Operational Settings During the Import of Oracle Service Bus Configuration Through APIs
You can preserve operational settings during import of Oracle Service Bus configurations using APIs. For more information, see ALSBConfigurationMBean documentation in the Oracle Fusion Middleware Java API Reference for Oracle Service Bus. Modify the MBean as shown in Example 46-1 to preserve the during the import.
Example 46-1 Preserve Operational Settings During the Import of Oracle Service Bus Configurations Through APIs
/**
 // Imports a configuration jar file, applies customization, activates it and exports the resources again
 // @throws Exception
 /
static private void simpleImportExport(String importFileName, String passphrase) throws Exception {
SessionManagementMBean sm = ... // obtain the mbean to create a session;
// obtain the raw bytes that make up the configuration jar file
 File importFile = new File(importFileName);
 byte[] bytes = readBytes(importFile);
// create a session
 String sessionName = "session." + System.currentTimeMillis();
 sm.createSession(sessionName);
// obtain the ALSBConfigurationMBean that operates on the
 // session that has just been created
 ALSBConfigurationMBean alsbSession = getConfigMBean(sessionName);
// import configuration into the session. First we upload the
 // jar file, which will stage it temporarily.
 alsbSession.uploadJarFile(bytes);
// then get the default import plan and modify the plan if required
 ALSBJarInfo jarInfo = getImportJarInf();
 ALSBImportPlan importPlan = jarInfo.getDefaultImportPlan();
// preserve operational values
 importPlan. setPreserveExistingOperationalValues(true);
// Modify the plan if required and pass it to importUploaeded method
 ImportResult result = alsbSession.importUploaded(importPlan);
// Pass null to importUploaded method to mean the default import plan.
 //ImportResult result = alsbSession.importUploaded(null);
// print out status
 if (result.getImported().size() > 0) {
     System.out.println("The following resources have been successfully imported.");
     for (Ref ref : result.getImported()) {
         System.out.println("\t" + ref);
     }
 }
if (result.getFailed().size() > 0) {
     System.out.println("The following resources have failed to be imported.");
     for (Map.Entry e : result.getFailed().entrySet()) {
         Ref ref = e.getKey();
         // Diagnostics object contains validation errors
         // that caused the failure to import this resource
         Diagnostics d = e.getValue();
         System.out.println("\t" + ref + ". reason: " + d);
     }
// discard the changes to the session and exit
     System.out.println("Discarding the session.");
     sm.discardSession(sessionName);
     System.exit(1);
}
// peform the customization to assign/replace environment values and
 // to modify the references.
...
// activate the session
 sm.activateSession(sessionName, "description");
// export information from the core data
 ALSBConfigurationMBean alsbcore = getConfigMBean(null);
 //export the information at project level, pass only a collection of project refs to this method
 byte[] contentsProj = alsbcore.exportProjects(Collections.singleton(Ref.DEFAULT_PROJECT_REF),null);
// the byte contents can be saved as jar file
}
46.8 SLA Alerting Functionality in Oracle Service Bus
In Oracle Service Bus you must define conditions based on which alerts are raised. The conditions are configured in an SLA alert rule. The alert rule also configures the severity level and an alert destination for an alert.
46.8.1 How to Configure SLA Alert Rules
SLA alerts are automated responses to SLAs violations, which are displayed on the dashboard. You must define alert rules to specify unacceptable service performance according to your business and performance requirements. When you configure an alert rule, you must specify the aggregation interval. The alert aggregation interval is not affected by the aggregation interval set for the service. For more information about aggregation interval, see Section 46.2, "Aggregation Intervals."
Creating an alert rule involves the following steps:
-
General Configuration–defines the name, description, summary, duration, severity, frequency, state of the enabled alert rule and other general characteristics.
-
Define Condition–defines one or more conditions that trigger the alert rule. Additionally, you must define the aggregation interval for the condition on this page.
Note:
You can create alert rules even if you have not enabled for monitoring for a service.
For more information about creating an alert rule, see Section 26.23, "Creating and Editing Alert Rules."
For a service for which monitoring is enabled, Alert rule is evaluated at discrete intervals. Once an alert rule is created it is first evaluated at the end of the aggregation interval, and after that at the end of each sample interval. For example, if the aggregation interval of an alert rule is five minutes, it is evaluated five minutes after it is created, and then every minute after that (since sample interval for five minutes, is one minute).
If a rule evaluates to false no alert is generated. If the rule evaluates to true the alert generation is governed by the Alert Frequency. If the frequency is Every Time, an alert is generated every time an alert rule evaluates to true. If the frequency is Notify Once, an alert is generated only if no alert is generated in the previous evaluation. In other words, an alert is generated the first time the alert rule evaluates to true and no more notifications are generated until the condition resets itself and evaluates to True again.
46.8.2 How to Lookup or Edit Existing Alert Rules
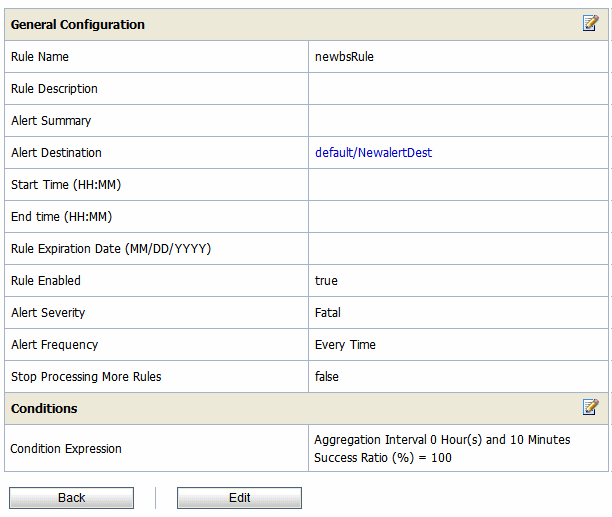
The View Alert Rule Details page displays complete information about a specific alert rule, as shown in Figure 46-6. You can view the details of the alert rule in this page. You can edit an alert rule configuration from this page. For more information about how to edit an alert rule, see Section 26.23, "Creating and Editing Alert Rules."
46.8.3 How to Rename Alert Rules
You can rename the alert rules from the SLA Alert Rules tab of View a Business Service or View a Proxy Service page. To rename an alert rule click Rename Alert Rule icon. Enter the new name for the alert rule in New Alert Rule Name field of the Rename Alert Rule window. Click Rename. Click Update and activate the session to complete. For more information, see Section 26.21, "Viewing Alert Rules." The Rename icon for the renamed alert is now disabled.
46.8.3.1 What are the Consequences of Renaming an Alert Rule?
When alerts are triggered, they are listed on the alert history page. Click View Alert Rule Details action icon to access the alert rule page. However, when you rename an alert rule, you cannot access the alert rule by clicking the View Alert Rule Details action from the alert history page, for the alerts that were raised before it was renamed.
You can access the Alert Details page from the alert history page for the alerts that are raised before-and after renaming the alert rule. The alert name is greyed in the Alert Details page for the alerts that were raised before the alert rule was renamed. When you rename an alert details icon for the renamed alert gets disabled.
Similar limitations exist when you attempt to access the alert rule page by clicking the alert name link on the alert details page. The alert name generated by alerts rules that are later renamed refers to an outdated name. You can view the old alert rule, but the name is grayed out indicating that the alert rule has been renamed.
When you rename an alert rule, the conditions on which a rule is based are preserved. The aggregation interval of the alert rule is also preserved. The alert is raised at the end of the first aggregation interval after the alert rule is renamed. For example, consider an alert rule a1 with aggregation interval five minutes. If the alert rule is renamed to a2 after two minutes of execution the next alert under the name a2 is generated three minutes after the is renamed.
46.8.4 What Happens to Alert Rules When You Import Oracle Service Bus Configurations?
You can preserve the alert rule configurations when you import Oracle Service Bus configurations. When you import Oracle Service Bus configurations, the operational settings are preserved. When services with alert rules exists in a jar that you import but does not exist in the target domain, then these services along with the alerts rules are imported as is.
However, if the same service exists in the target domain as well, then the import behavior is governed by the state of the Preserve Operational Settings during the import operation. For more information on how to preserve operational settings, see Section 46.7.3, "Updates to Operational Settings During Import of Oracle Service Bus Configurations."
46.9 The Oracle Service Bus Dashboard
The Oracle Service Bus dashboard displays service health, server health and details of all the alerts that have been triggered in Oracle Service Bus runtime. The dynamic refresh of this display is controlled by the Dashboard Refresh Rate setting in the User Preferences page. The default option for this setting is No Refresh. These alerts can be the result of SLA violations or pipeline alerts.
Service Level Agreements (SLAs) are agreements that define the precise level of service expected from the business and proxy services in Oracle Service Bus. Pipeline alerts are defined in the message flow for business purposes such as record the number of message that flow through the message pipeline, to track occurrences of certain business events, or to report errors but not for the health of the system.
Each row of the table displays the information that you have configured, such as the severity, timestamp, and associated service. Clicking the Alert Name link displays Alert Details page for more details about the SLA alert. This helps you to analyze the cause of the SLA alert. Clicking the Alert Summary link displays the Alert Details for more details about the pipeline alert. This helps you to analyze the cause of the SLA alert.
From the dashboard, you can drill-down into the system and easily find specific information, such as the average execution time of a service, the date and time an alert occurred, or the duration for which server has been running.
The following sections helps you to understand the information displayed on Oracle Service Bus dashboard.
Figure 46-7 Oracle Service Bus Dashboard for SLA Alerts
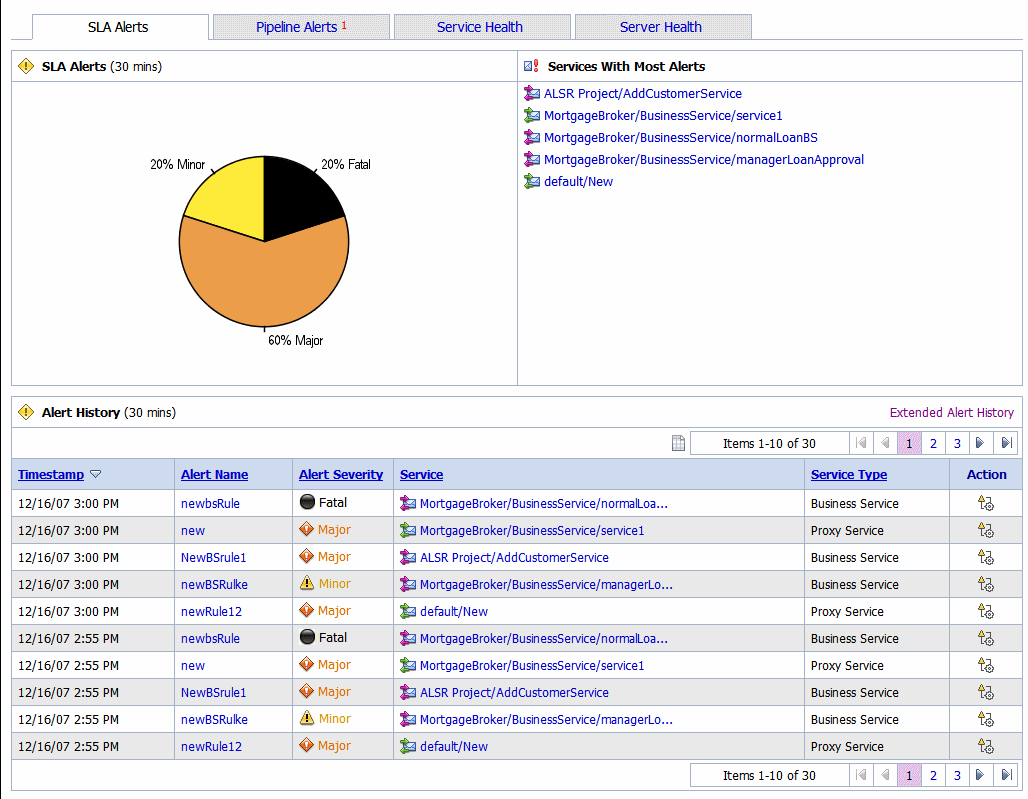
Description of "Figure 46-7 Oracle Service Bus Dashboard for SLA Alerts"
46.9.1 How to Access Service Statistics for the Current Aggregation Interval
Click the Service Health tab to access the Service Health page. The Service Health page is displayed.
This is a dynamic view of statistical data collected by each service. This view is available when you select Current Aggregation Interval in the Display Statistics field. The aggregation interval displayed in this view determines the statistics that are displayed. For example, if the aggregation interval of a particular service is twenty minutes, that service's row displays the data collected in the last twenty minutes.
From this page you can view all services or search for services based on the given criteria. For more information about the statistics displayed in this page, in the Current Aggregation Interval view, see Section 26.11, "Viewing Service Metrics."
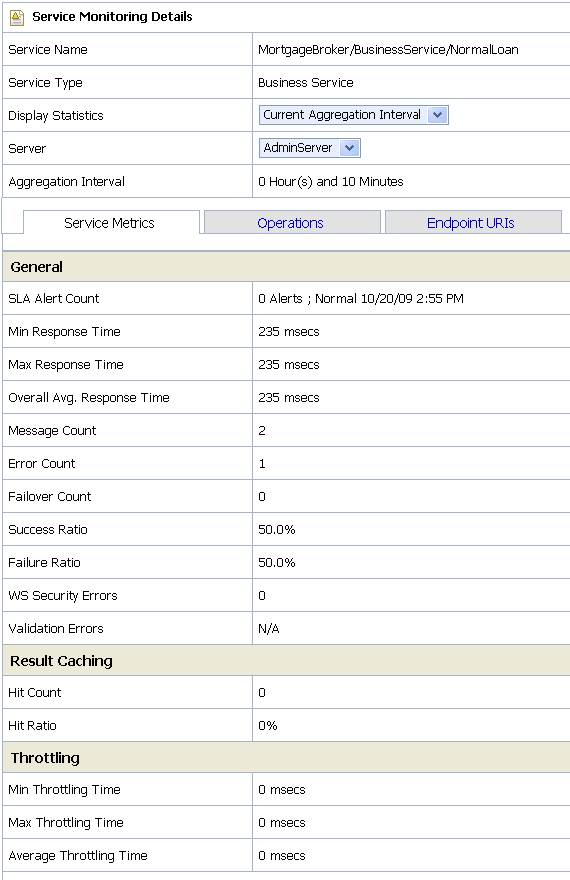
The Service Monitoring Details page provides you with two views of detailed information about a specific service. Figure 46-8 shows the Service Monitoring Details page for a business service in the current aggregation interval. Figure 46-9 shows the Service Monitoring Details page for a proxy service.
To access this page click the name of the service in the Service With Most Alerts section, Alert History table, or extended alert history table for SLA alerts and pipeline alerts. Also the name of the service in Service Health tab is a link to Service Monitoring Details page.
Figure 46-8 Service Monitoring Details for Business Service–Current Aggregation Interval
Description of "Figure 46-8 Service Monitoring Details for Business Service–Current Aggregation Interval"
Figure 46-9 Service Monitoring Details for Proxy Services–Current Aggregation Interval
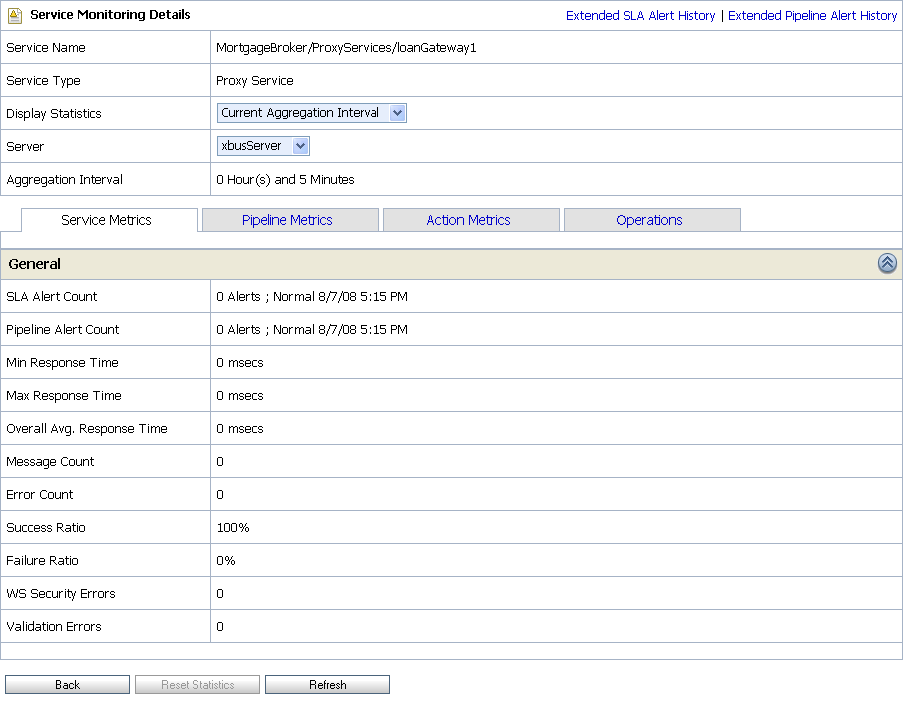
Description of "Figure 46-9 Service Monitoring Details for Proxy Services–Current Aggregation Interval"
This is a dynamic view of statistical data collected by each service. This view is available when you select Current Aggregation Interval in the Display Statistics field. The aggregation interval displayed in this view determines the statistics that are displayed. For example, if the aggregation interval of a particular service is twenty minutes, this page displays the data collected in the last twenty minutes for that service.
For more information on different tabs available for a business service, see Section 46.9.2.1, "Service Metrics," Section 46.9.2.2, "Operations," and Section 46.9.2.5, "Endpoint URIs." For more information on different tabs available for a proxy service, see Section 46.9.2.1, "Service Metrics," Section 46.9.2.3, "Pipeline Metrics," Section 46.9.2.4, "Action Metrics," and Section 46.9.2.2, "Operations."
For more information about the statistics displayed in this page, in the Current Aggregation Interval view, see Section 26.11, "Viewing Service Metrics."
46.9.2 How to Access Running Count Statistics for Services
The running count statistics for a service are statistics that are available since the last reset.
Figure 46-10 Service Health Tab—Since Last Reset
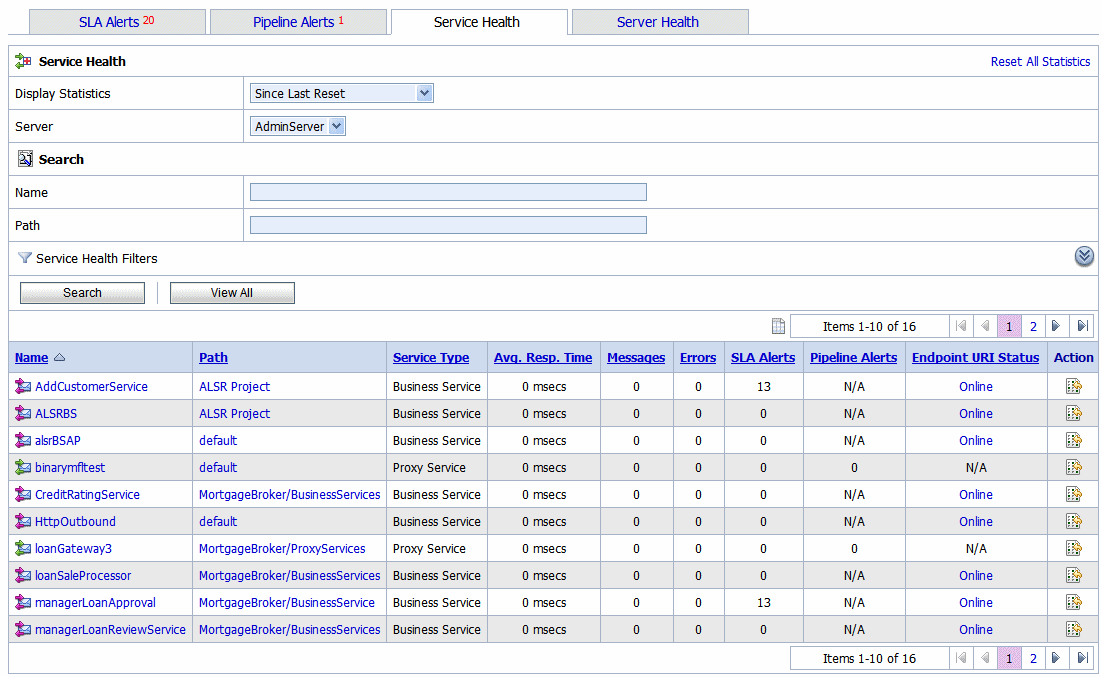
Description of "Figure 46-10 Service Health Tab—Since Last Reset"
This view is a running count of the service health metrics. This view is available when you select Since Last Reset in the Display Statistics field. The statistics displayed in each row are for the period since you last reset the statistics for an individual service or since you last reset the statistics for all services.
You can also reset statistics for selected services or for all services. For more information about the statistics displayed in this page, in the Since Last Reset view, see Section 26.11, "Viewing Service Metrics."
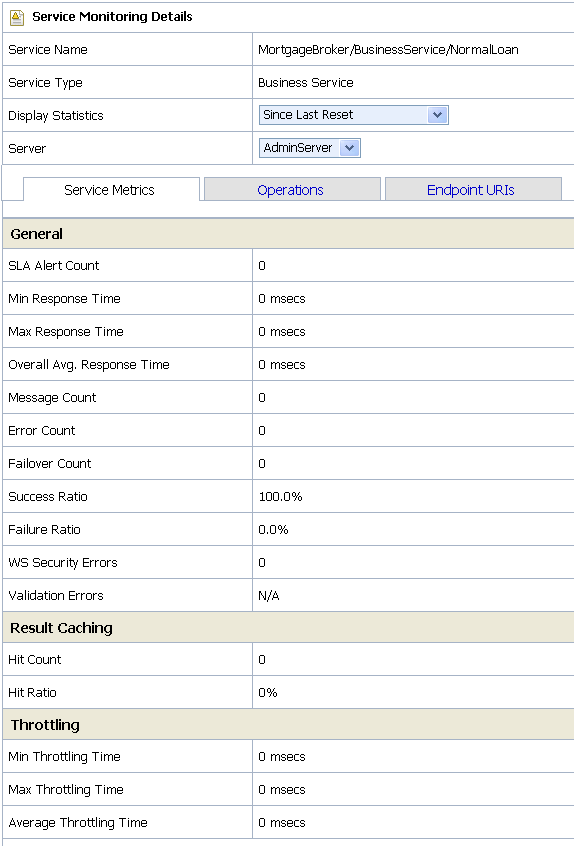
Figure 46-11 Service Monitoring Details Page for a Business Service—Since Last Reset
Description of "Figure 46-11 Service Monitoring Details Page for a Business Service—Since Last Reset"
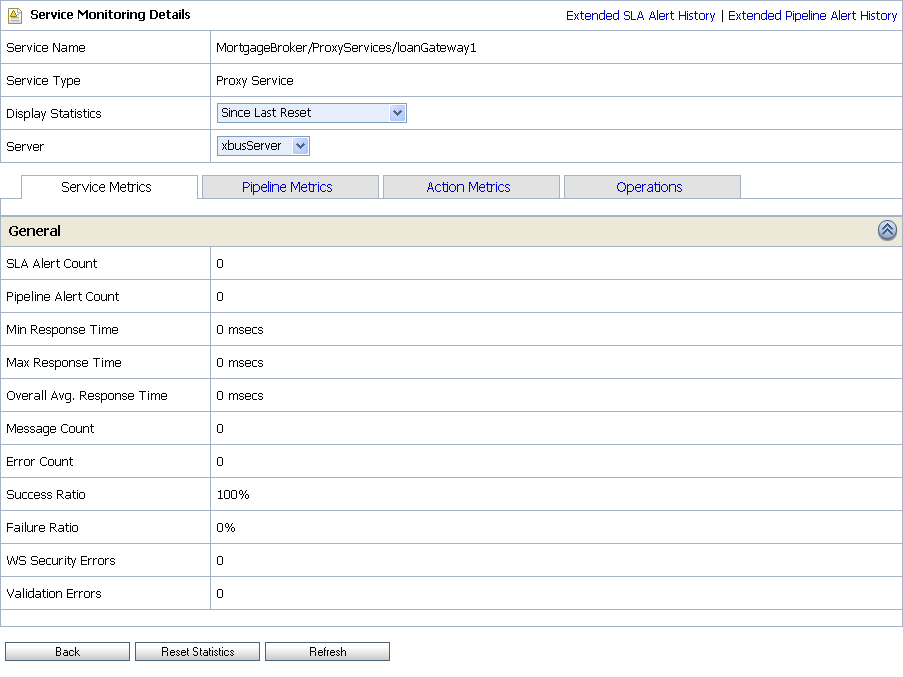
Figure 46-12 Service Monitoring Details Page for a Proxy Service–Since Last Reset
Description of "Figure 46-12 Service Monitoring Details Page for a Proxy Service–Since Last Reset"
This view is a running count of the service monitoring metrics. This view is available when you select Since Last Reset in the Display Statistics field. The statistics displayed in each row are for the period since you last reset the statistics for an individual service or since you last reset the statistics for all services.
From this page you can view all services or search for services based on the given criteria. You can also reset statistics for this service. For more information about the statistics displayed in this page, in the Since Last Reset view, see Section 26.11, "Viewing Service Metrics."
You have the following tabs in the Service Monitoring Details page for each of the views:
46.9.2.1 Service Metrics
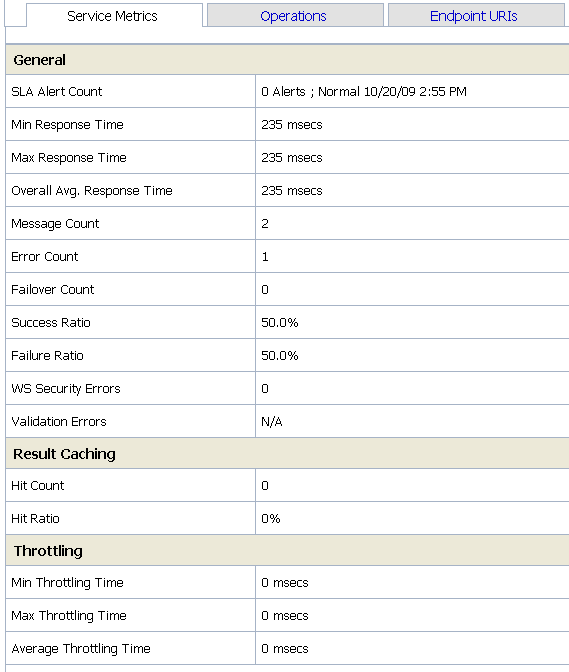
The Service Metrics (see Figure 46-13) view displays the metrics for a proxy service or a business service.
Figure 46-13 Service Monitoring Details Page for a Business Service-Service Metrics Tab
Description of "Figure 46-13 Service Monitoring Details Page for a Business Service-Service Metrics Tab"
The Service Metrics tab displays the following types of metrics:
-
General–This section enables you to quickly view the status of the alerts and service level statistics for the service in the current aggregation interval. When you view the service level statistics for the time interval since the last reset, this displays all the metrics since they were last rest. For more information about the metrics displayed in this view, see Section 26.11, "Viewing Service Metrics."
-
Throttling –This section enables to view the throttling statistics for a business service. You can also see the minimum and maximum throttling time in milliseconds. For more information on throttling statistics, see Section 26.11, "Viewing Service Metrics."
46.9.2.2 Operations
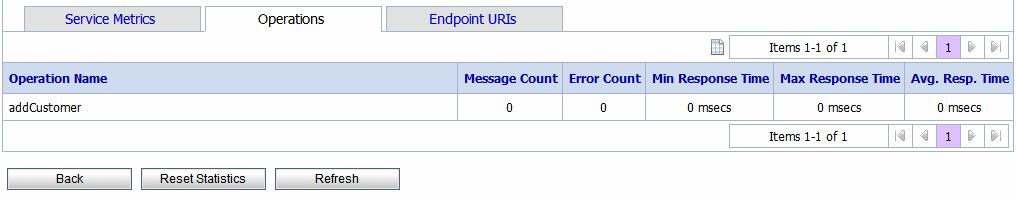
These metrics are displayed for WSDL based services for which you have defined operations. The Operations tab (see Figure 46-14) displays the statistics for the operation defined in a WSDL based service. For more information statistics displayed in this tab, see Section 26.12, "Viewing Operations Metrics for WSDL-Based Services."
Figure 46-14 Service Monitoring Details Page-Operation View
Description of "Figure 46-14 Service Monitoring Details Page-Operation View"
46.9.2.3 Pipeline Metrics
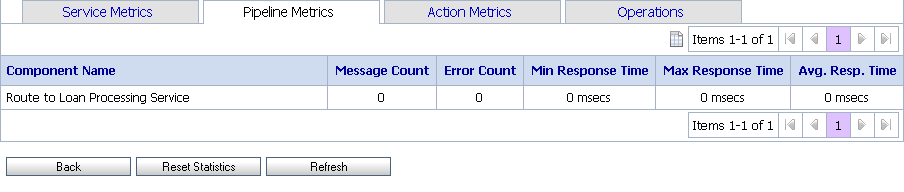
This view (see Figure 46-15) gives information on various components of the pipeline of the service. The Pipeline Metrics tab is available only for proxy services. For more information about the statistics displayed in this tab, see Section 26.13, "Viewing Pipeline Metrics."
Figure 46-15 Service Monitoring Details Page-Pipeline Metrics View for Proxy Services
Description of "Figure 46-15 Service Monitoring Details Page-Pipeline Metrics View for Proxy Services"
46.9.2.4 Action Metrics
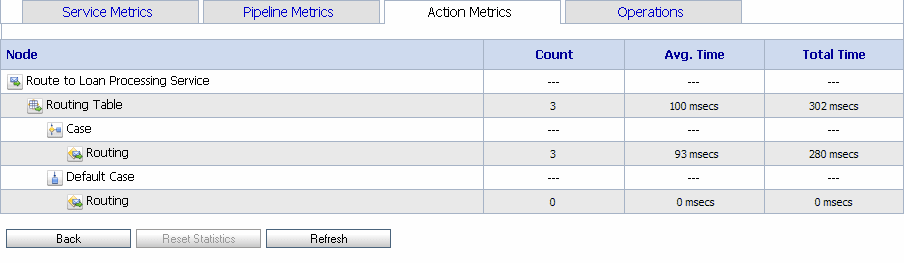
This view (see Figure 46-16) presents information on actions in the pipeline of the service, displayed as a hierarchy of nodes and actions. Figure 46-16, for example, shows the Routing Table action nested under the route node Route to Loan Processing Service.
Similarly, actions nested under various branches of the Routing Table action are displayed accordingly. The table also contains entries that mark branches, in this case, the rows labeled Case and Default Case.
Figure 46-16 Service Monitoring Details Page-Action Metrics View for Proxy Services
Description of "Figure 46-16 Service Monitoring Details Page-Action Metrics View for Proxy Services"
The Action Metrics tab is available only for proxy services. For more information about the statistics displayed in this tab, see Section 26.14, "Viewing Action Metrics."
46.9.2.5 Endpoint URIs
The Endpoint URIs tab of the Service Monitoring page for a business service gives statistics of the various endpoint URIs configured for a business service and their status. For more information about the statistics displayed in this view, see Section 26.15, "Viewing Business Services Endpoint URIs Metrics."
Figure 46-17 Service Monitoring Details Page-Endpoint URI for Business Services
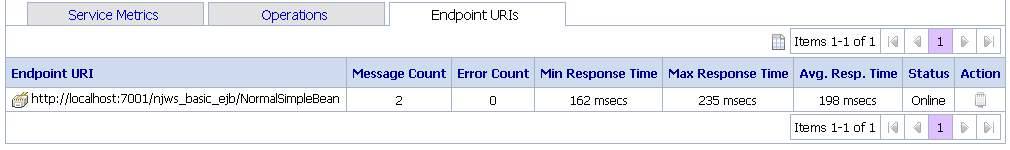
Description of "Figure 46-17 Service Monitoring Details Page-Endpoint URI for Business Services"
46.9.3 Viewing SLA Alerts in the Dashboard
You can view the details of SLA alerts in the SLA Alerts tab of the dashboard. Table 46-6 describes the dashboard for SLA alerts:
Table 46-6 Oracle Service Bus Dashboard for SLA Alerts
| Section | Description |
|---|---|
|
SLA Alerts |
The pie chart shows the distribution of SLA alerts based on their severity for the duration set for alert history in the dashboard settings page. The severity level of alerts is user configurable and has no absolute meaning. For more information about alert severity, see Section 46.6.1, "Assigning Severity for Alerts." Click a specific area in the pie chart to display the Extended SLA Alert History page for alerts for the chosen level of severity and alert history duration. |
|
Services With Most SLA Alerts |
This section lists all the services with most SLA alerts in the current aggregation interval. |
|
Alert History |
This section gives details for all the SLA alerts generated during the alert history duration. For more information, see Section 46.9.4.1, "Viewing the Alert History for Pipeline Alerts." |
46.9.3.1 Viewing the Alert History for SLA Alerts
The Alert History (Figure 46-7) for SLA alerts table shows all the SLA alerts, which have occurred in the alert history duration you have set in the User Preferences page. For more information about alert history table, see Section 26.1, "Viewing SLA Alerts."
To view a complete list of alerts, click Extended Alert History. For more information about Extended Alert History, see Section 46.6.4, "How to View or Delete SLA Alerts."
46.9.4 Viewing Pipeline Alerts in the Dashboard
You can view the pipeline alerts in the Pipeline Alerts tab of the dashboard (see Figure 46-18). Table 46-7 describes the dashboard for pipeline alerts.
Figure 46-18 Oracle Service Bus Dashboard for Pipeline Alerts
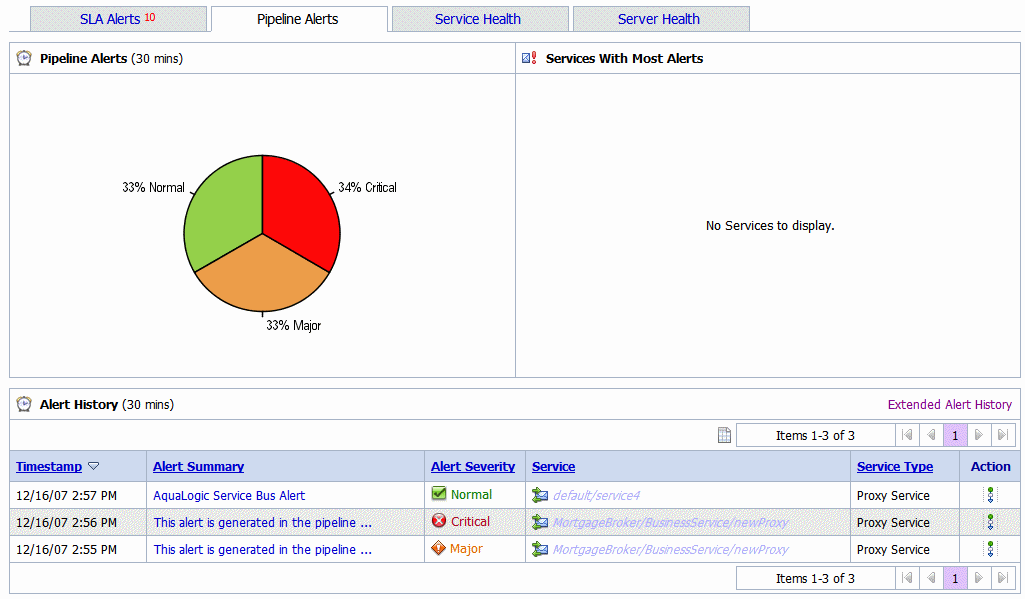
Description of "Figure 46-18 Oracle Service Bus Dashboard for Pipeline Alerts"
Table 46-7 Dashboard for Pipeline Alerts
| Section | Description |
|---|---|
|
Pipeline Alerts |
The pie chart shows the distribution of pipeline alerts based on their severity for the duration set for alert history in the dashboard settings page. The severity level of alerts is user configurable and has no absolute meaning. For more information about alert severity, see Section 46.6.1, "Assigning Severity for Alerts." Click a specific area in the pie chart to display the Extended pipeline Alert History page for alerts for the chosen level of severity and alert history duration. |
|
Service With Most Alerts |
This section lists all the services with most pipeline alerts in the current aggregation interval. |
|
Alert History |
This section gives details for all the pipeline alerts generated during the alert history duration. For more information, see Section 46.9.4.1, "Viewing the Alert History for Pipeline Alerts." |
46.9.4.1 Viewing the Alert History for Pipeline Alerts
The Alert History (Figure 46-7) for pipeline alerts table shows all the pipeline alerts, which have occurred in the alert history duration you have set in the User Preferences page. For more information about Alert History table, see Section 26.2, "Viewing Pipeline Alerts."
To view a complete list of alerts, click Extended Alert History. For more information about Extended Alert History, see Section 46.6.5, "How to View or Delete Pipeline Alerts."
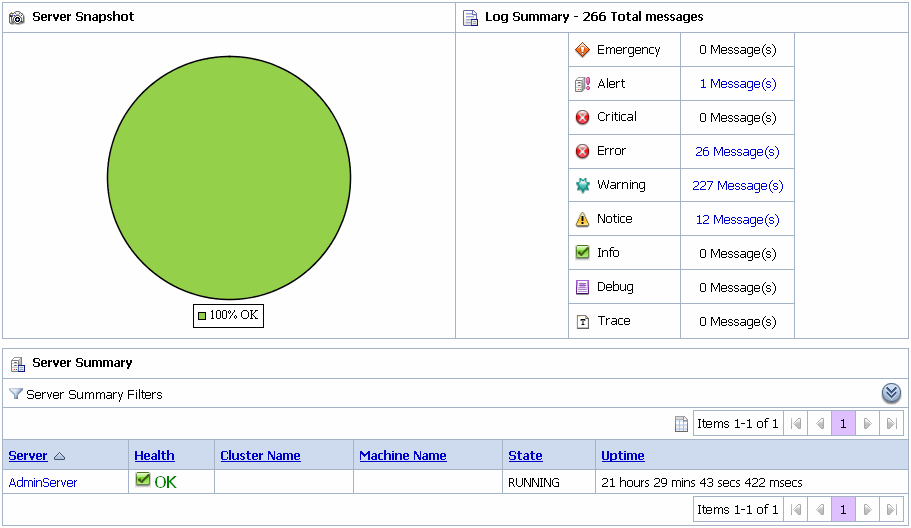
46.9.5 Viewing Server Health in the Dashboard
You can view the server summary in Server Health tab of the dashboard.
46.9.5.1 Viewing Log Summary
The Log Summary section in the Server Health tab displays the summary log for the servers associated with the domain. The domain log file provides a central location from which to view the overall status of the domain. Each server instance forwards a subset of its messages to a domain-wide log file.
By default, servers forward only messages of severity level Notice or higher. You can modify the set of messages that are forwarded. For more information, see "Understanding WebLogic Logging Services" in Oracle Fusion Middleware Configuring Log Files and Filtering Log Messages for Oracle WebLogic Server.
If you configure the logging action in a pipeline, the log is forwarded to the Admin Server log. You can view the logging messages in the Server Health tab of the Oracle Service Bus Administration Console.
In a cluster, log action messages are forwarded to the Managed Server, so by default you cannot view these logging messages in the Oracle Service Bus Administration Console. To view managed server logs in the Oracle Service Bus Administration Console, configure Oracle WebLogic Server to forward these messages to the domain log. For information on how to do this, see "Create Log Filters" in the Oracle Fusion Middleware Oracle WebLogic Server Administration Console Online Help.
To see the number of messages currently raised by the system, click the View Log Summary link in the Server Summary panel. A table is displayed that contains the number of messages grouped by severity, as shown in Figure 46-19.
You can view the log summary only if you posses administrator privileges in the Oracle WebLogic Server Console.
Table 46-8 describes the status messages in the log summary.
Table 46-8 Log Summary Messages
| Message | Description |
|---|---|
|
Emergency |
This indicates that the server is in an unusable state. This severity indicates a severe system failure. |
|
Alert |
This indicates that a particular service is in an unusable state while other parts of the system continue to function. Automatic recovery is not possible; immediate attention of the administrator is required to resolve the problem. |
|
Critical |
This indicates that a system or service error has occurred. The system can recover but there might be a momentary loss or permanent degradation of service. |
|
Error |
This indicates that a user error has occurred. The system or application can handle the error with no interruption. Limited degradation of service may occur. |
|
Warning |
This indicates that a suspicious operation or configuration has occurred. However, normal operations may not be affected. |
|
Notice |
This is an informational message with a higher level of importance than Info messages. |
|
Info |
This reports normal operations; a low-level informational message. |
|
Debug |
This shows the number of debug messages logged. |
This display is based on the health state of the running servers, as defined by the WebLogic Diagnostic Service. For more information about the WebLogic Diagnostic Service, see Oracle Fusion Middleware Configuring and Using the Diagnostics Framework for Oracle WebLogic Server.
To view the domain log for a particular status of alert message, click the number corresponding with the status of alert message. shows an example of a domain log file displayed in the Oracle Service Bus Administration Console.
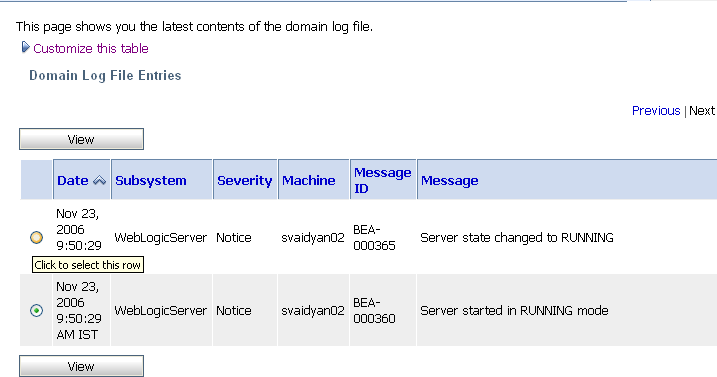
For more information about domain log file, see Section 26.18, "Viewing Domain Log Files." For more information, see Message Attributes in "Understanding WebLogic Logging Services" in Oracle Fusion Middleware Configuring Log Files and Filtering Log Messages for Oracle WebLogic Server. To display details of a single log file on the page, select the appropriate log, then click the View. You can also customize the Domain Log File Entries table to view the following additional information:
-
Machine
-
Server
-
Thread
-
User ID
-
Transaction ID
-
Context ID
-
Timestamp
For additional description of these information, see Section 26.20, "Viewing Details of Domain Log Files.". For more information about how to customize the Domain Log File Entries table, see Section 26.19, "Customizing Your View of Domain Log File Entries."
46.9.5.2 Viewing Server Summary
You can view the Server Summary in the Server Health tab of the dashboard. In a single node domain, the Server Summary displays the summary of the Admin Server. In a cluster domain, it displays the health of all the servers in a cluster, in case of a cluster environment. For more information on Server Summary, see Section 26.16, "Viewing Server Information."
46.9.5.3 Viewing Server Details
To access this page, click the name of a server under server summary or click the name of a server in the Servers Summary page.
This page enables you to view more server monitoring details.
The information displayed on this page is a subset of the Monitoring tab in the Oracle Service Bus Administration Console Server Settings page. Table 46-9 describes the available information.
| Information | Description |
|---|---|
|
General |
This provides general runtime information about the server. Click Advanced to view more information, such as Oracle WebLogic Server version or operating system name. |
|
Channels |
This provides monitoring information about each channel. |
|
Performance |
This provides information about the performance of the server. |
|
Threads |
This provides current runtime characteristics and statistics for the server's active executable queues. |
|
Timers |
This provides information about the timer used by the server. |
|
Workload |
This provides statistics for Work Managers, constraints, and policies configured on the server. |
|
Security |
This statistics for Work Managers, constraints, and policies configured on the server. |
|
JMS |
This lets you monitor JMS information about the server. |
|
JTA |
This provides the summary of all transaction information for all resource types on the server. |