2 Getting Started Managing Oracle Enterprise Scheduler
This chapter describes how to access Oracle Enterprise Manager Fusion Middleware Control and Oracle Enterprise Scheduler configuration, monitoring, and management tasks.
Note:
You can also use Oracle Weblogic Scripting Tool to perform server management tasks. For more information, see "Enterprise Scheduler Custom WLST Commands" in the Oracle Fusion Middleware WebLogic Scripting Tool Command Reference.
This chapter includes the following sections:
-
Section 2.1, "Logging into Oracle Enterprise Manager Fusion Middleware Control Console"
-
Section 2.2, "Navigating to Oracle Enterprise Scheduler Administration Tasks"
-
Section 2.4, "Logging Out of Oracle Enterprise Manager Fusion Middleware Control"
2.1 Logging into Oracle Enterprise Manager Fusion Middleware Control Console
You can administer Oracle Enterprise Scheduler by using the Oracle Enterprise Manager Fusion Middleware Control. This section describes how to start and log in to the console.
To log in to Oracle Enterprise Manager Fusion Middleware Control Console:
-
Use Internet Explorer 7, Mozilla Firefox 2.0.0.2, or Firefox 3.0.x to access the following URL:
http://host_name:port/emwhere host_name is the name of the host on which Oracle Enterprise Manager Fusion Middleware Control Console is installed and port is a number that is dynamically set during installation. This port is typically
7001, but is the HTTP port associated with the Oracle HTTP Server. For environments in which the SSL port was enabled during configuration, the default port is7002. -
Enter
weblogic/passwordand click Login.where:
-
weblogicis the default administrator user name for Oracle Enterprise Manager Fusion Middleware Control. You can change this during installation. You can also add new administrator users using the WebLogic console. -
password is the password you entered during installation.
The Accessibility Preference dialog appears the first time you log in. If you want, you can select to not display this option again.
-
-
Select an appropriate action and click Continue.
The farm home page is displayed. From there, you can navigate to the Scheduling Service.
2.2 Navigating to Oracle Enterprise Scheduler Administration Tasks
The Scheduling Service menu of Fusion Middleware Control or Cloud Control provides access to administrative tasks for Oracle Enterprise Scheduler.
To navigate to Oracle Enterprise Scheduler pages in Fusion Middleware Control or Cloud Control:
-
From the navigation pane, expand the farm and then Scheduling Services, and select the Oracle Enterprise Scheduler component.

Description of the illustration nav_ess.gif
The Scheduling Service home page displays. See Section 2.3 for further information about the contents of the home page.
-
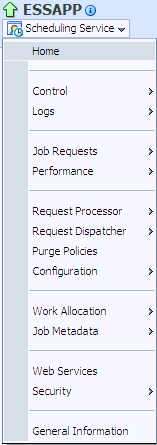
Select the Scheduling Service menu.

Description of the illustration ess_menu.gif
The Scheduling Service menu displays the following options.
Menu Option Description Home
Displays the Scheduling Service home page. For more information about the contents of this page, see Section 2.3.
Control
Displays the following options:
-
Start Up: This option runs the Oracle Enterprise Scheduler server. For more information, see Section 3.6.
-
Shut Down: This option shuts down the Oracle Enterprise Scheduler server. For more information, see Section 3.6.
Logs
The View Log Messages option displays the Log Messages page for viewing the contents of event log files. See "Managing Log Files and Diagnostic Data" chapter in Oracle Fusion Middleware Administrator's Guide for more information.
The log files are stored in the following directories:
-
DOMAIN_HOME/servers/SERVER_HOME/logs -
DOMAIN_HOME/servers/SERVER_HOME/logs/apps -
DOMAIN_HOME/servers/SERVER_HOME/logs/owsm/msglogging/diagnostic.log -
DOMAIN_HOME/servers/SERVER_HOME/sysman/log/emoms.log
Job Requests
Displays the following options:
-
Search Job Requests: Allows you to search for job requests according to particular parameters. For more information, see Section 4.2.2.
-
Submit Job Requests: Allows you to submit an execution request for a particular job. For more information, see Section 4.2.1.
-
Define Schedules: This option displays the Schedules page which allows you to create, edit and delete schedules for work assignments, workshifts and job request purge policies. For more information, see Section 4.2.3.
Performance
Displays the following options:
-
Service Summary: This option displays a brief overview of the service performance. For more information, see Section 6.3.1.
-
Current Activity: This option displays current Oracle Enterprise Scheduler activity. For more information, see Section 6.3.2.
-
Historical Reports: This option displays a chart or table depicting previous Oracle Enterprise Scheduler data. For more information, see Section 6.3.3.
Request Processor
Displays the following options:
-
Start/Stop: This option causes the request processor to start or stop running. For more information, see Section 3.6.
-
Configure: This option displays the Configure Request Processor page, which allows you to enable the request processor, create work assignment bindings and so on. For more information, see Section 3.4.
Request Dispatcher
Displays the following options:
-
Start/Stop: This option causes the request dispatcher to start or stop running. For more information, see Section 3.6.
-
Configure: This option displays the Configure Request Dispatcher page, which allows you to enable the request dispatcher, manage polling intervals, and so on. For more information, see Section 3.4.
Purge Policies
Allows you to configure and manage job request purge policies including job request purge criteria, retention criteria and purge policy schedules. For more information, see Section 4.3.
Work Allocation
Displays the following options:
-
Work Assignments: This option displays the Work Assignments page which allows you to create, edit and delete work assignments. For more information, see Section 5.3.1.
-
Workshifts: This option displays the Workshifts page which allows you to create, edit and delete workshifts. For more information, see Section 5.3.2.
-
Schedules: This option displays the Schedules page which allows you to create, edit and delete schedules for work assignments, workshifts and job request purge policies. For more information, see Section 5.3.3.
Job Metadata
Displays the following options:
-
Job Definitions: This option displays the Job Definitions page, which allows you to manage job definitions. See Section 5.2.1 for further information.
-
Job Sets: This option displays the Job Sets page, which allows you to create and edit job sets for a given application. For more information, see Section 5.2.2.
-
Incompatibilities: This option displays the Incompatibilities page, which allows you to create and edit incompatibilities for a given application. For more information, see Section 5.2.3.
Web Services
Displays a page that provides an overview of the web services in the application including web service endpoints and application-level metrics. For more information, see Section 3.9.
Security
Displays the following options:
-
Application Policies: This option displays the authorization policies that an application relies upon for controlling access to its resources. See Section 3.8 for further information.
-
Application Roles: This option displays the roles used by security aware applications specific to the application. See Section 3.8 for further information.
General Information
Target Information
Displays general details about the Oracle Enterprise Scheduler instance. Known as Target Information in Cloud Control. For more information, see Section 6.5.
-
2.3 The Scheduling Service Home Page
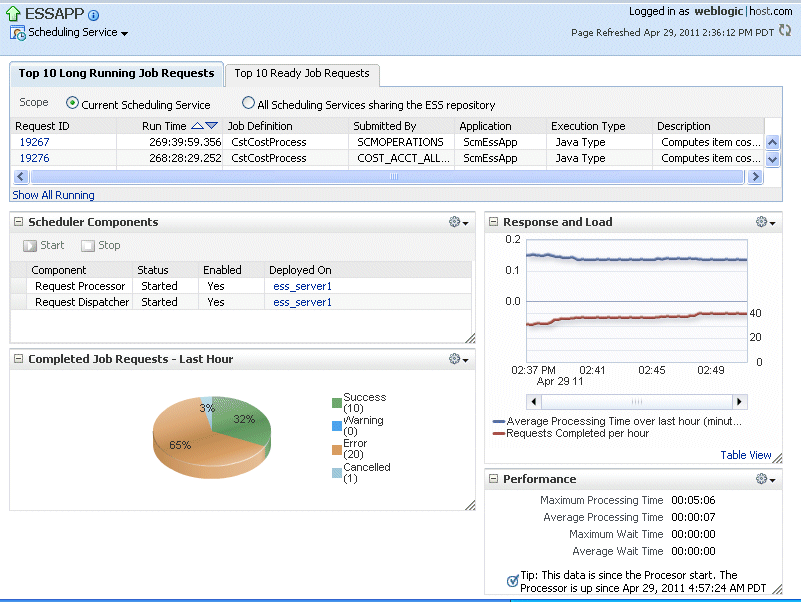
The Scheduling Service home page provides an overview of the performance of Oracle Enterprise Scheduler components and jobs, including component status, the number of completed job requests in the last hour, as well as the processing times for running jobs.
You can use this page as a starting point for monitoring and administering Oracle Enterprise Scheduler. Figure 2-1 shows a portion of the Scheduling Service home page.
These pages contain the following regions:
-
Top Ten Long Running Requests and Top Ten Ready Job Requests Regions
The Top Ten Long Running Requests region displays the top ten long running scheduled job requests, including request ID, job runtime, job definition used, executing application, job execution type and description. You can set the scope of the top ten long running requests displayed to the current scheduling service only, or all scheduling services sharing the Oracle Enterprise Scheduler repository. For more information, see "Viewing Top Ten Long Running Oracle Enterprise Scheduling Service Requests" in Chapter 6, "Monitoring Oracle Enterprise Scheduler".
-
Scheduler Components Region
The Scheduler Components region displays the components of Oracle Enterprise Scheduler, including the job request processor and dispatcher. The tab displays the status of each component, the name of the server to which it is deployed and whether or not the component is enabled. You can start and stop each component as required. For more information, see "Viewing Top Ten Oracle Enterprise Scheduling Service Jobs Ready to Be Executed" in Chapter 6, "Monitoring Oracle Enterprise Scheduler".
-
Completed Job Requests Region
The Completed Job Requests region displays the status of scheduled jobs completed within the last hour. For more information, see "Viewing Completed Job Requests" in Chapter 6, "Monitoring Oracle Enterprise Scheduler".
-
Response and Load Region
The Response and Load region displays performance monitoring statistics regarding the time required to process to job requests. For more information, see "Viewing Job Request Response and Load" in Chapter 6, "Monitoring Oracle Enterprise Scheduler".
-
Performance Region
The Performance region displays performance data for job requests, such as processing times and wait times. For more information, see "Viewing Performance as Processing and Wait Times" in Chapter 6, "Monitoring Oracle Enterprise Scheduler".
-
Monitoring and Diagnostics Region (Cloud Control only)
The Monitoring and Diagnostics sub-section displays major incidents and changes that have occurred in the instance, including incidents at the instance level, incidents that have occurred in descendant targets, any configuration changes that have occurred over the last seven days and any support workbench problems. Incidents are listed by severity, namely fatal, critical, warning and escalation levels.
2.4 Logging Out of Oracle Enterprise Manager Fusion Middleware Control
This section describes how to log out of Oracle Enterprise Manager Fusion Middleware Control.
To log out of Oracle Enterprise Manager Fusion Middleware Control:
-
Note the following details about logging out.
-
If multiple pages are open, logging out of any page logs you out of the entire application in all open pages.
-
If you log out with any unsaved configuration changes, you receive no warning message and your changes are lost.
-
-
In the upper right-hand corner of any page, click the Log Out link.
