2 Getting Started
To help you get started with the Oracle BI Mobile App Designer use this tutorial to guide you through the creation of your first app.
This chapter includes the following section:
To complete this tutorial the following is required:
-
Sample App Lite is available in your environment
2.1 Creating Your First Tablet App
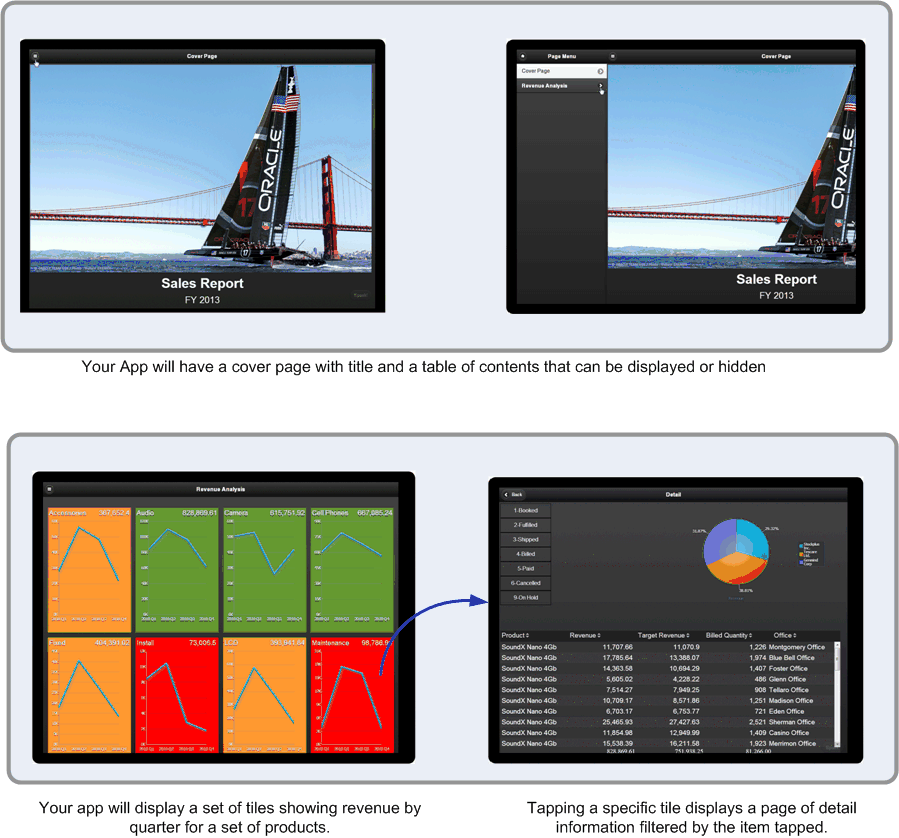
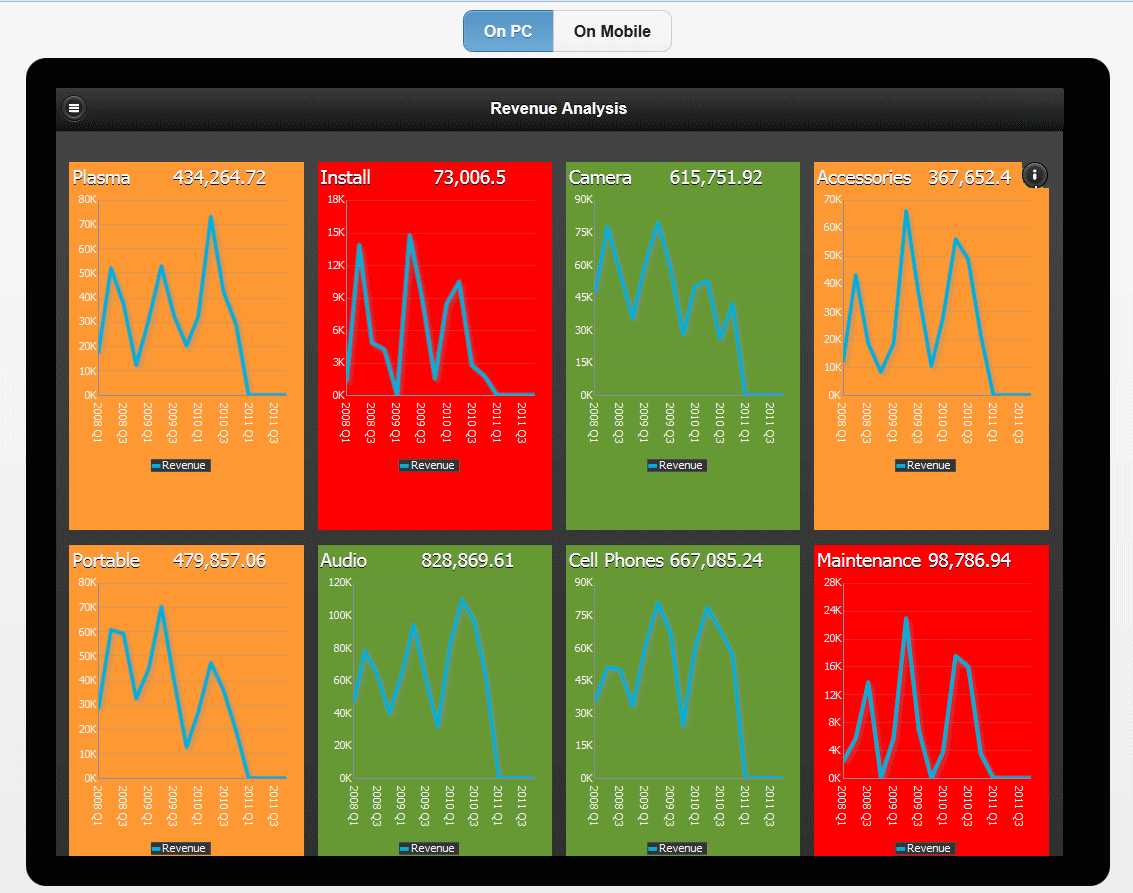
This tutorial demonstrates how to build a simple tablet app. To complete the tutorial use the sample data source "Sample Sales Lite" that is provided with Oracle BI EE. The app you will build in this tutorial is shown in Figure 2-1.
To build this app, follow these steps:
2.1.1 Choose Your Data Source and Save the App
-
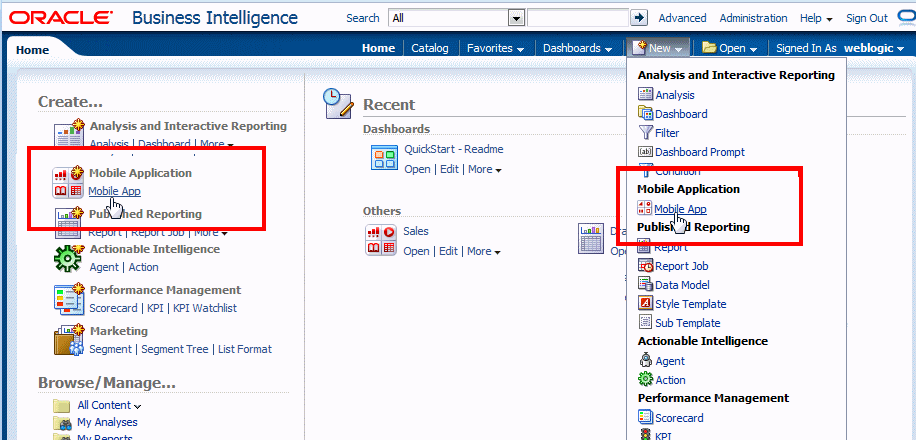
From the Oracle Business Intelligence Home page, select Create Mobile App.
-
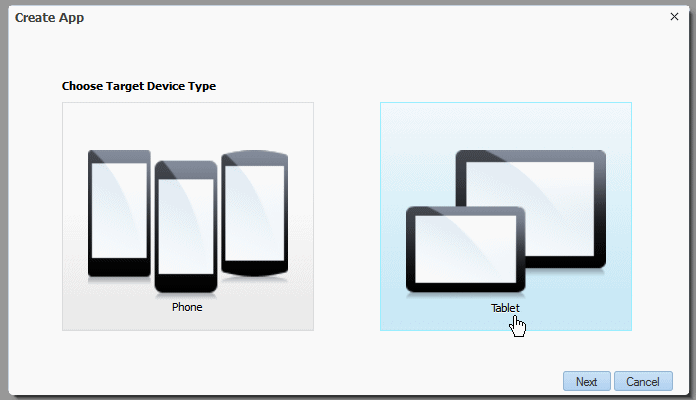
Click Tablet.
-
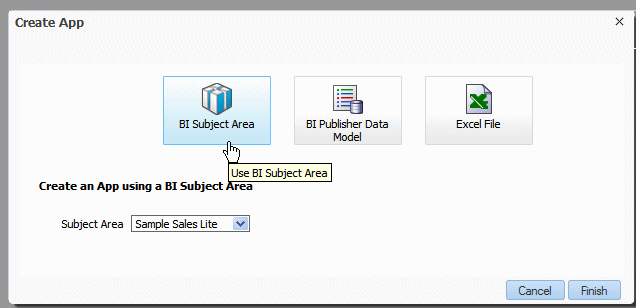
Select the source of data for your app. Click BI Subject Area and then select Sample Sales Lite from the list.
-
Click Save to save your app. Select a folder location, then enter a name and click Save.
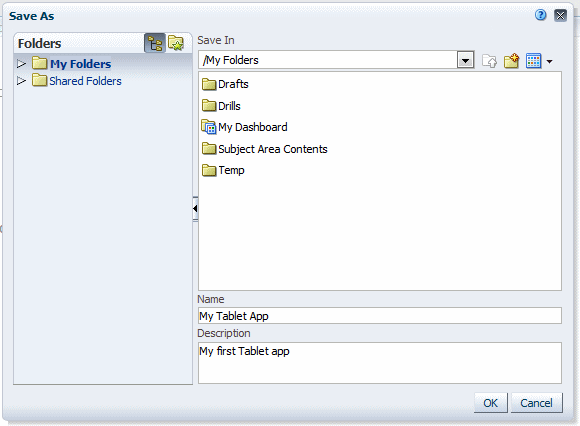
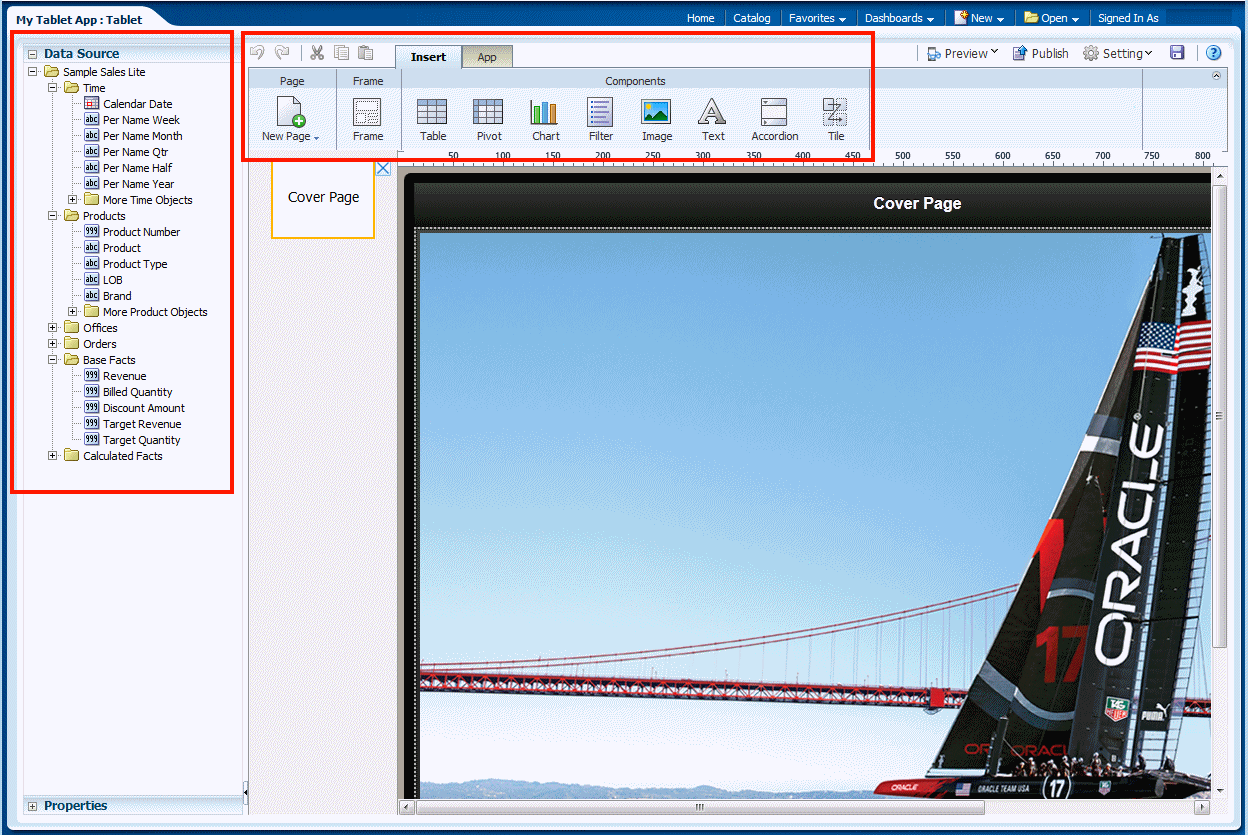
The app designer opens to display the default cover page.
Notice the data fields displayed on the left. Fields can be dragged from the left column to the components in the design area. Notice the Insert toolbar that displays the components you can drag and drop to your app page.
2.1.2 Add a Title to the Cover Page
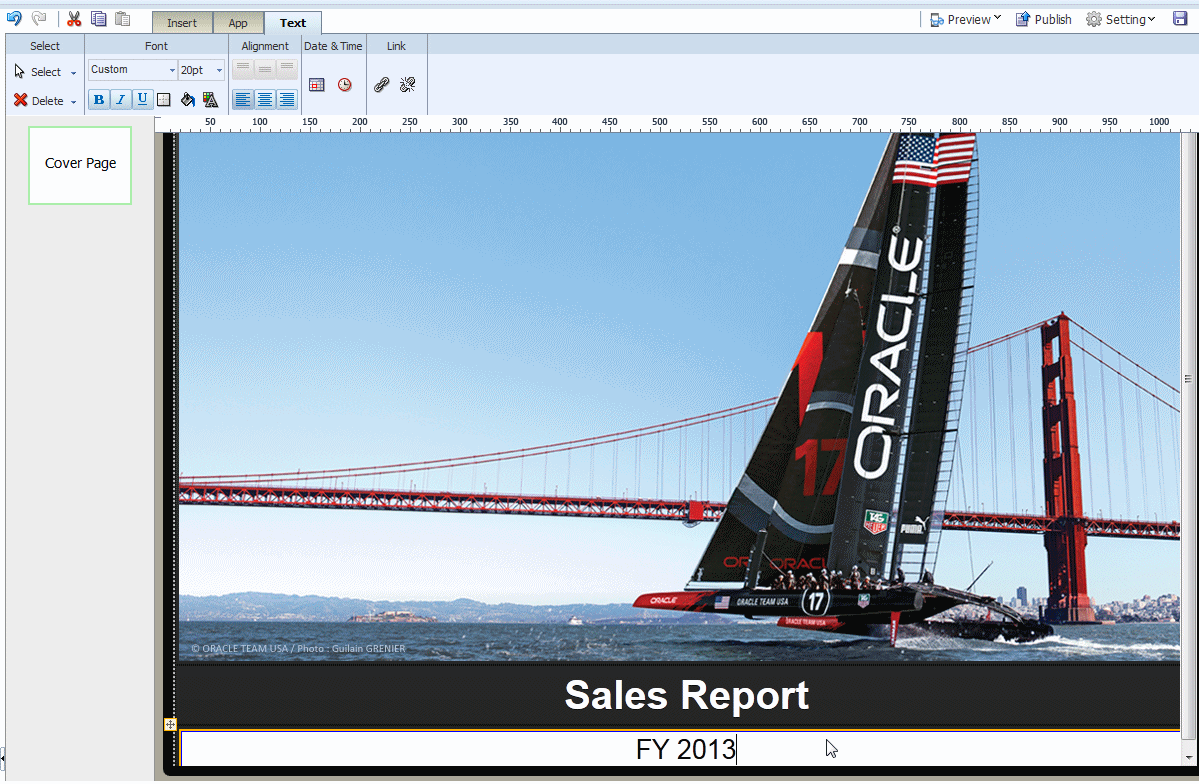
Update the title and subtitle of the cover page. Double-click the text to edit it. Enter the following:
-
Title: Sales Report
-
Subtitle: FY 2013
2.1.3 Create the Tile Page
The second page of the app displays tiles. To add the second page:
-
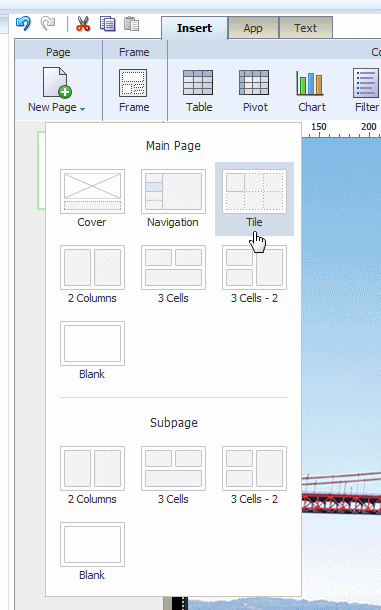
Click the Insert toolbar and then click New Page.
From the new page menu select Tile.
-
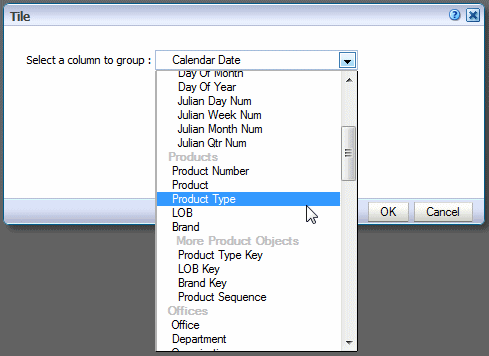
From the Select a column to group list, select Product Type.
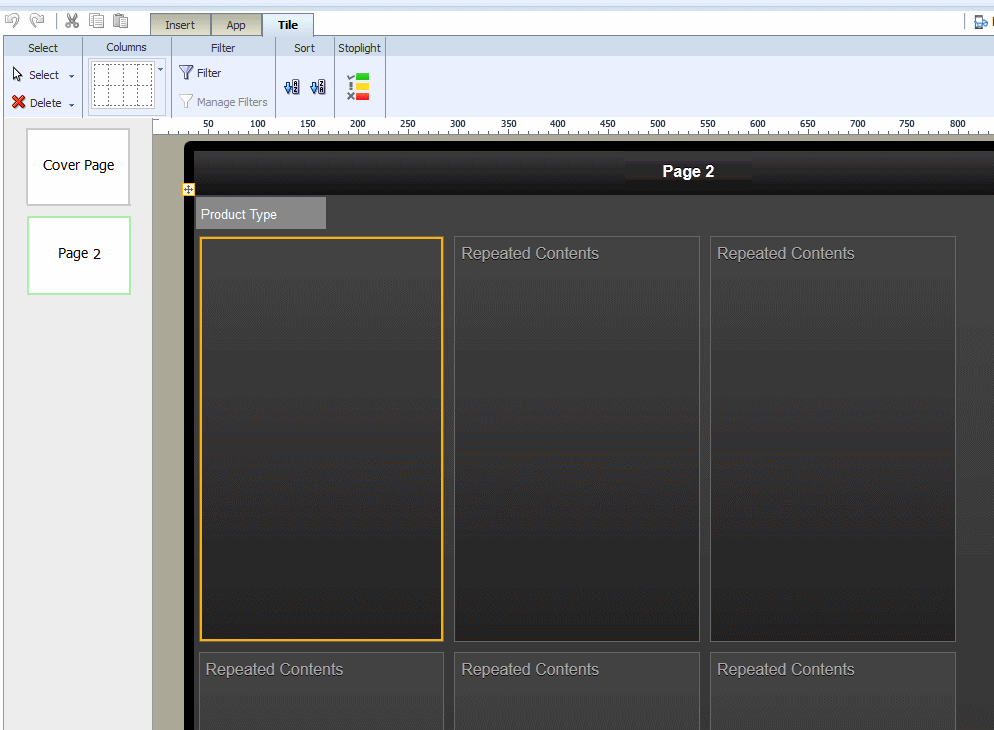
By selecting Product Type as the Column to group value, for each Product Type that occurs in the data, the app generates a tile cell with the data specific to that product type.
Figure 2-8 displays the inserted tile page. During design time the "Repeated contents" tiles display as placeholders only and do not show the content you define for the first tile. Use Preview to view the repeated contents at anytime during the design phase.
-
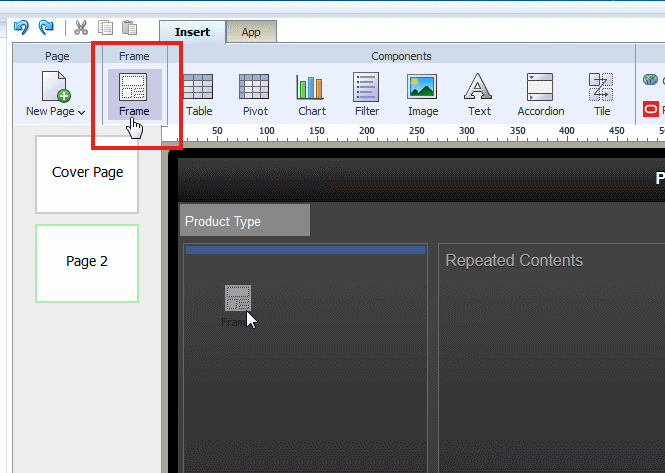
To position the fields that will display in your tiles, first insert a Frame:
With the first tile selected, click the Insert toolbar. Select and drag the Frame component to the first tile.
-
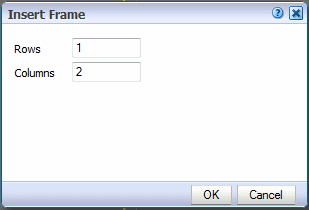
In the Frame dialog, enter 1 for the Rows value and 2 for Columns.
-
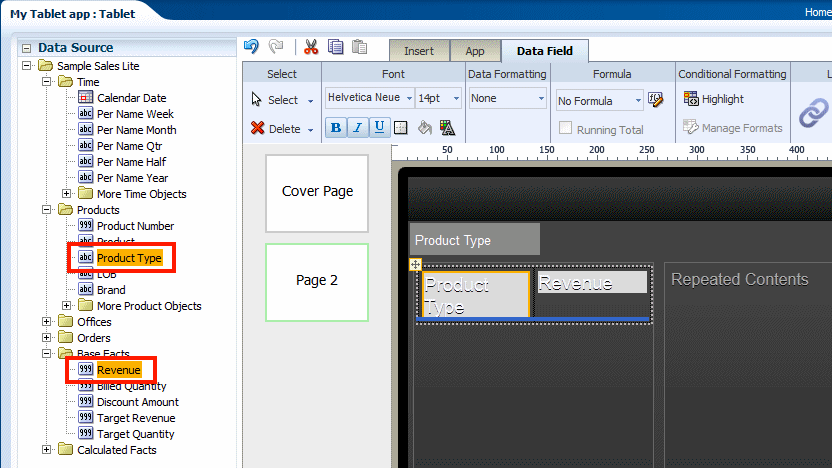
Drag and drop the Product Type field from the Data Source pane to the left frame cell. Drag and drop the Revenue field from the Data Source pane to the right frame cell.
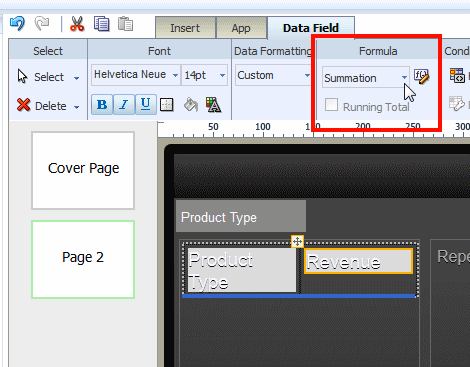
Notice that the Revenue field has the Summation formula applied to it. Revenue will be summed for the Product Type grouped in each tile.
-
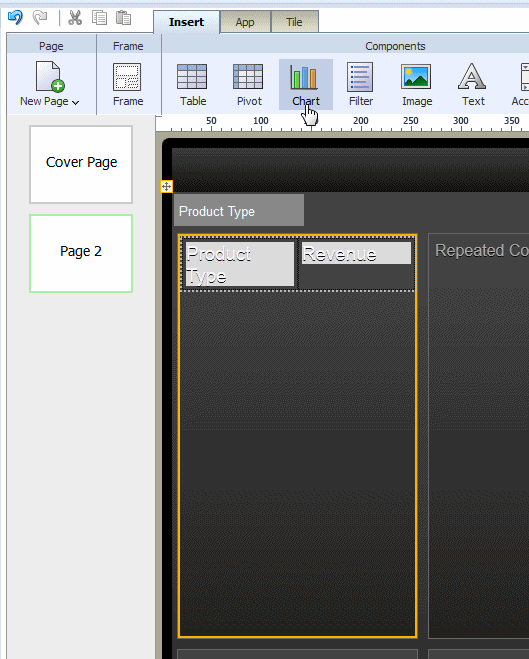
To insert the chart, ensure that the first tile is selected by clicking the outer border of the tile. From the Insert menu, click Chart.
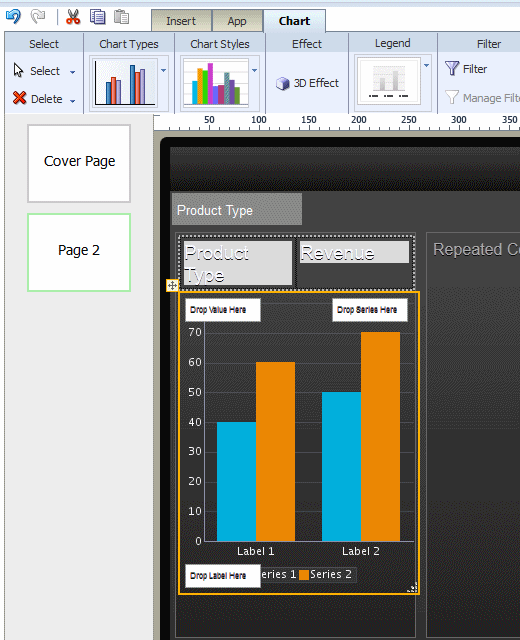
A default chart placeholder is inserted to the cell.
-
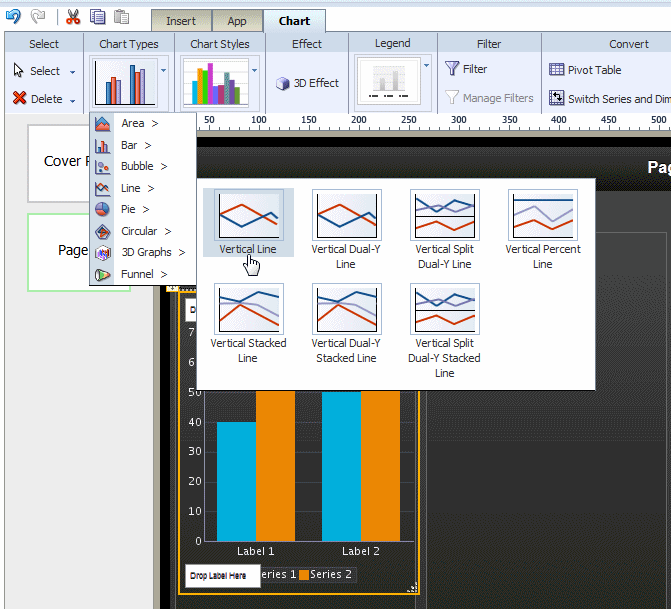
Change the Chart Type to a line chart: With the chart selected, click Chart Type, then select Line, then select Vertical Line.
-
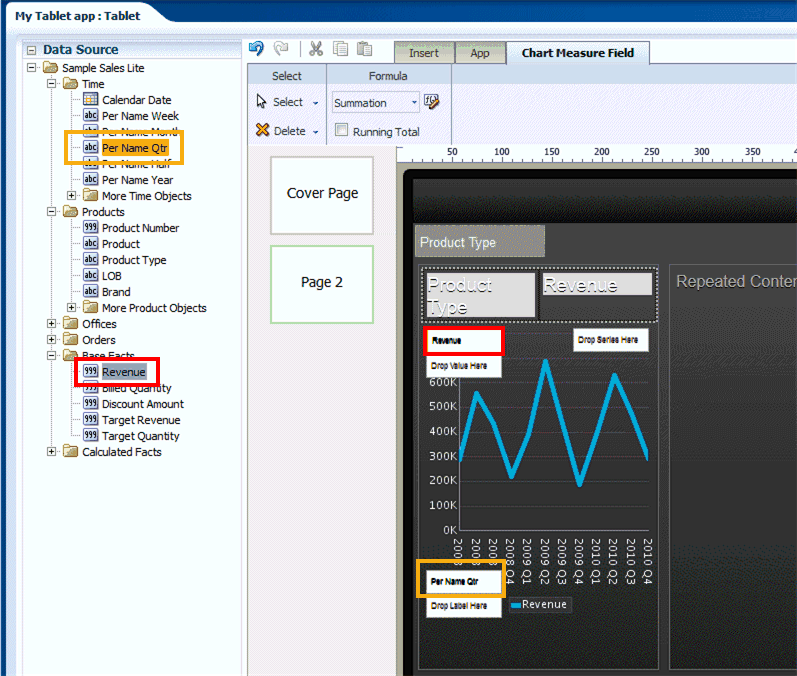
Add data to your chart by first dragging the Revenue field from the Data pane to the Drop Value Here position. Then drag the Per Name Qtr field from the Data pane to the Drop Label Here position.
-
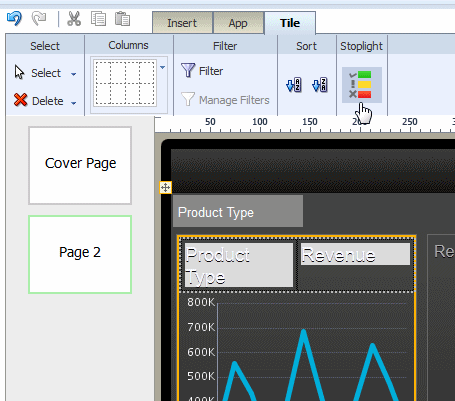
To add the stoplight formatting, select the first tile and then click Stoplight, as shown in Figure 2-17.
-
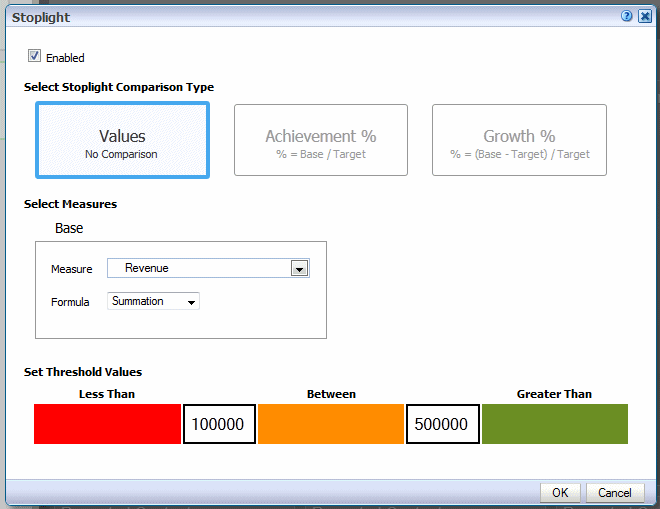
In the Stoplight dialog enter the following:
-
Select Values.
-
For the Measure field select Revenue.
-
For the Formula select Summation.
-
In the Less Than entry box enter 100000.
-
In the Greater Than entry box enter 500000.
Click OK. The conditional formatting does not display during design time, but you can see the effects when you preview.
-
-
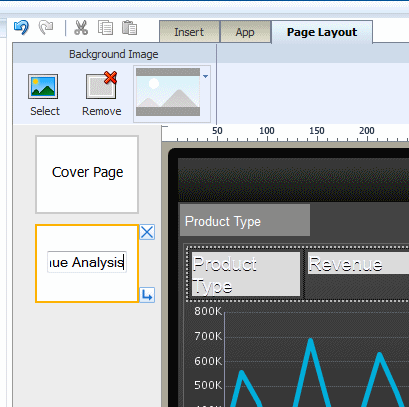
The final task on this page is to change the page title. Double-click the text "Page 2" on the page icon in the left column as shown in Figure 2-19. Update the text to "Revenue Analysis".
-
Click the Preview toolbar button and select Preview.
Your app is displayed in the tablet simulator.
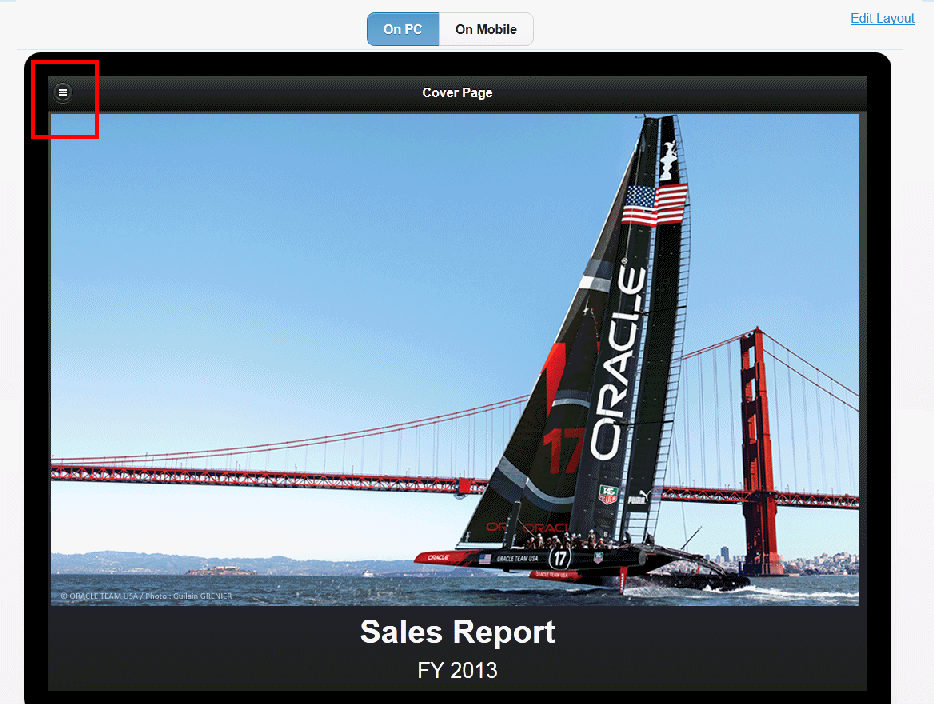
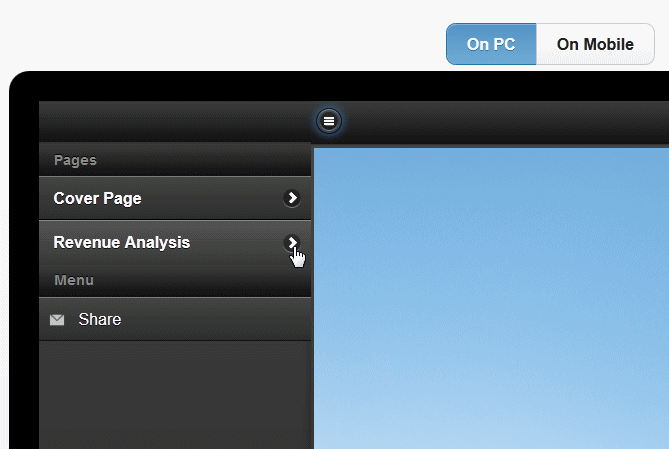
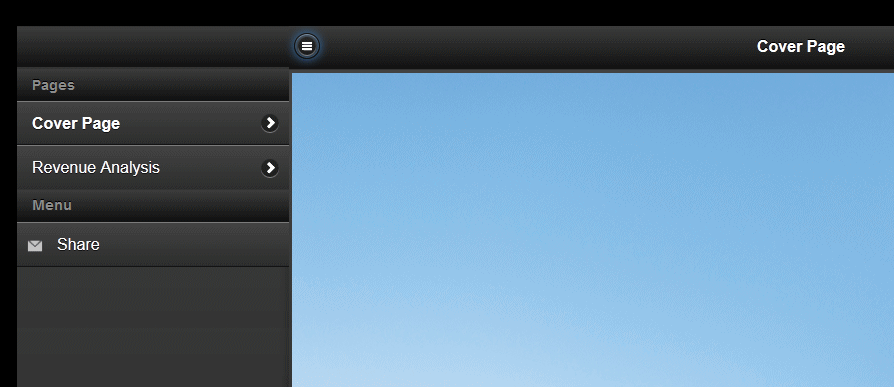
To view the second page of your app, click the page menu icon in the upper left corner, then click the page title Revenue Analysis.
Your second page displays showing the tiles you created with the stoplight formatting applied.
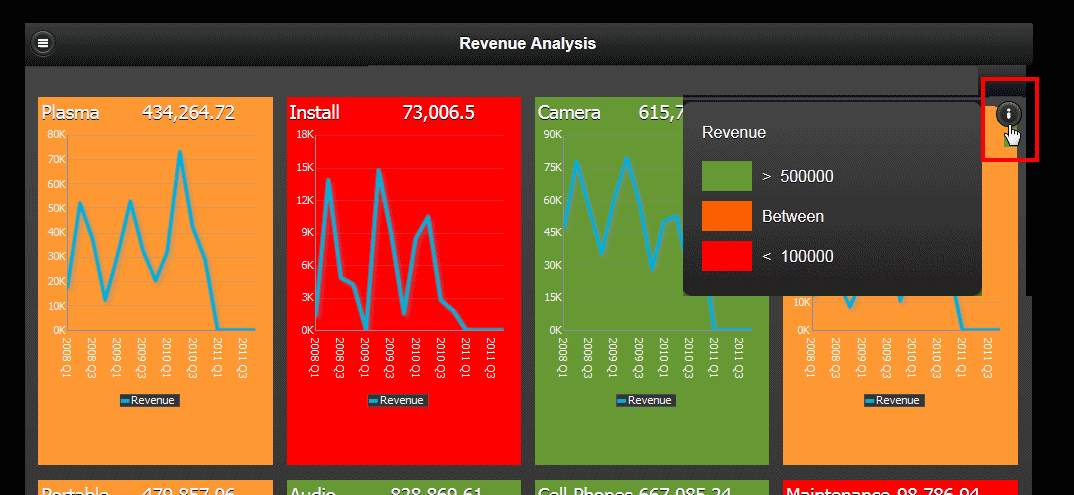
Notice the Information icon in the upper right corner. Click the icon to see the stoplight conditions you applied.
-
Click Edit Layout to return to the designer.
2.1.4 Create the Subpage
The next page of your app is a detail page of the Revenue Analysis page. When you tap one of the Product Type tiles on your first page, a detail page opens to show detail information filtered for the Product Type that was tapped. To create the master-detail relationship, simply add a subpage to the Revenue Analysis page.
To add the subpage:
-
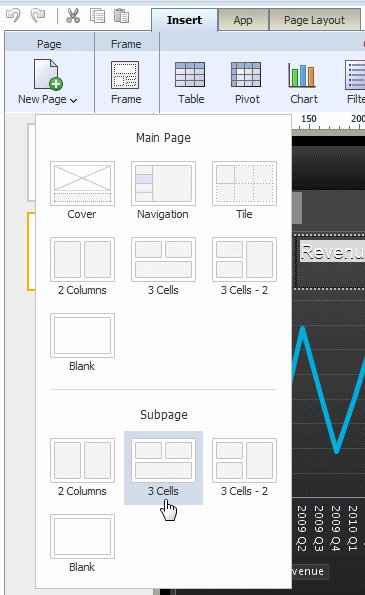
Click the Insert toolbar and then click New Page. To add a subpage, choose one of the Subpage options. For this tutorial, select the 3 Cells page layout.
-
Insert the Filter component:
Select the upper-left cell and then click the Insert tab. Click Filter.
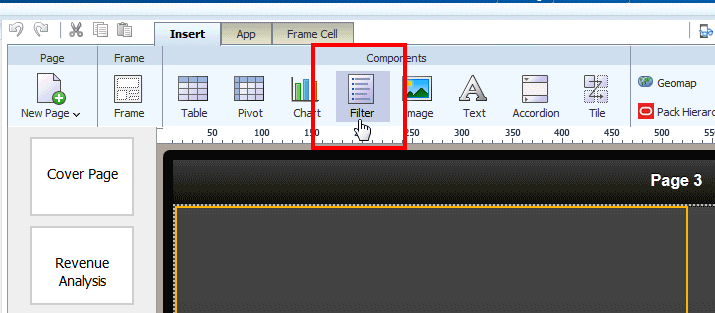
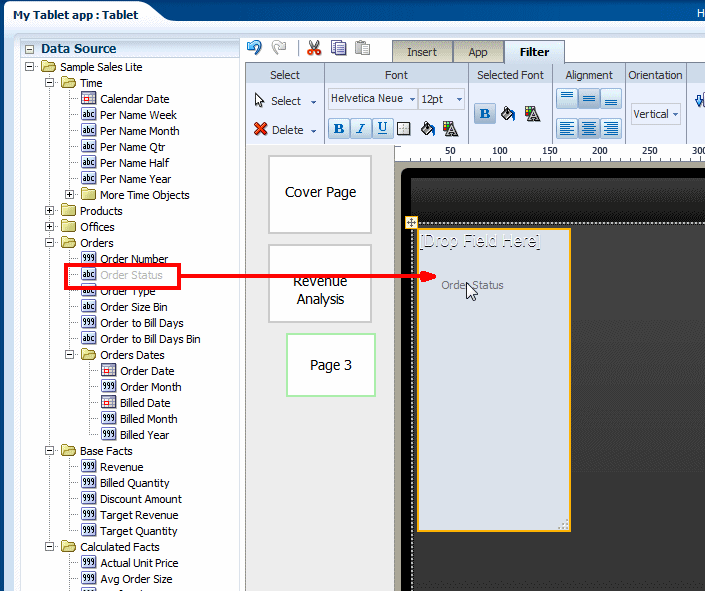
An empty filter is inserted. From the Data Source pane drag Order Status to the Filter component.
-
Insert the pie chart:
Select the upper-right cell and then click the Insert tab. Click Chart. A default chart placeholder is inserted to the cell.
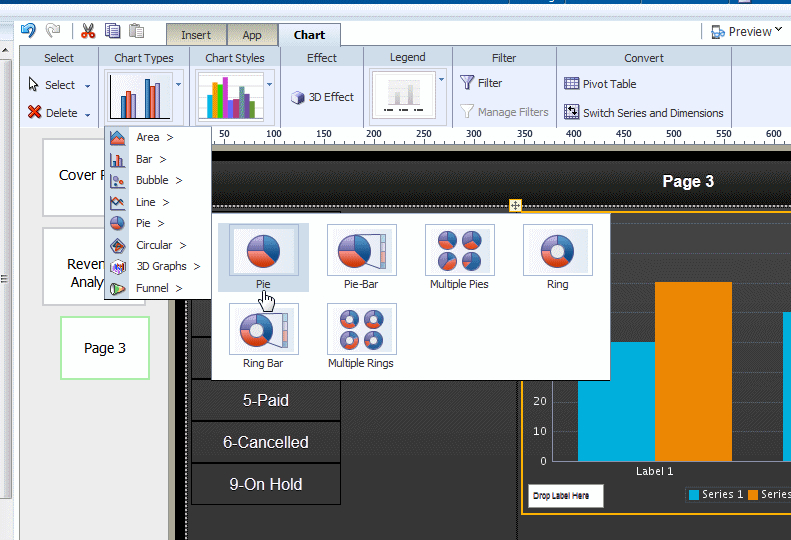
Change the chart type to pie by clicking Chart Type, then Pie >, then Pie from the submenu.
-
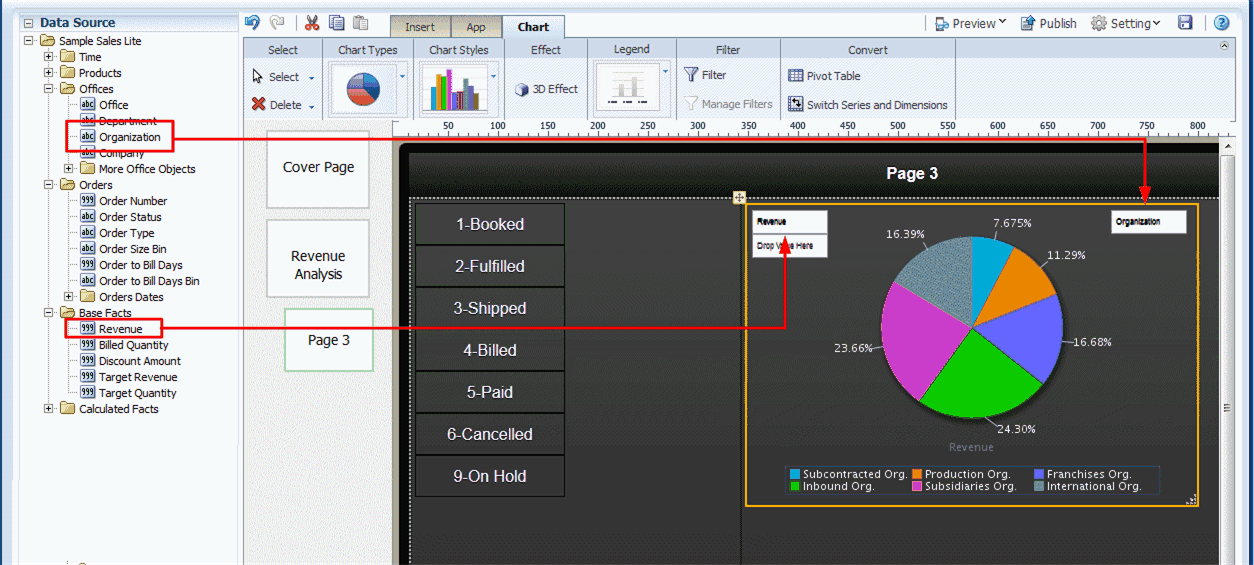
Add data to your chart by first dragging the Revenue field from the Data Source pane to the Drop Value Here position. Then drag the Organization field from the Data Source pane to the Drop Series Here position.
-
Change the position of the legend:
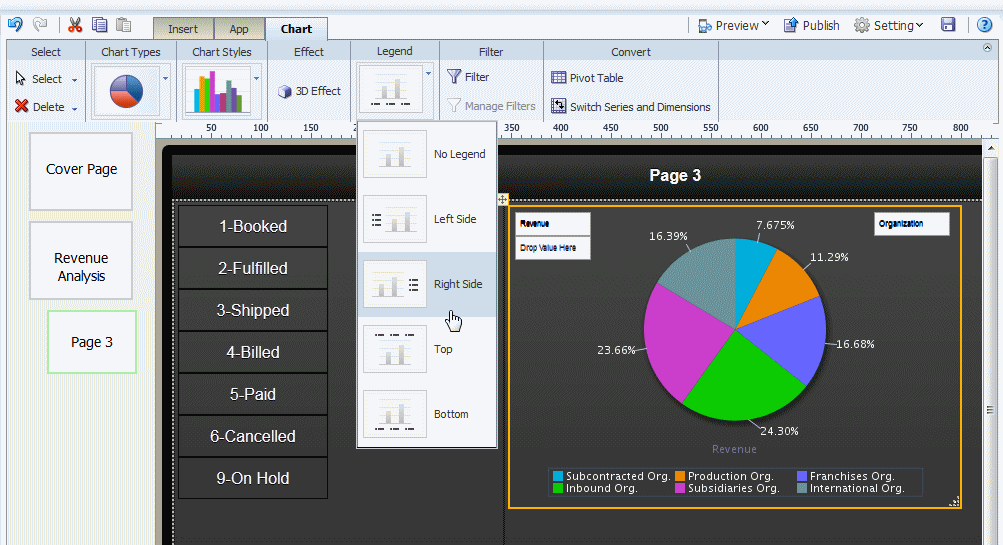
With the chart selected, on the Chart tab, click Legend then select the Right Side option.
-
Insert the table:
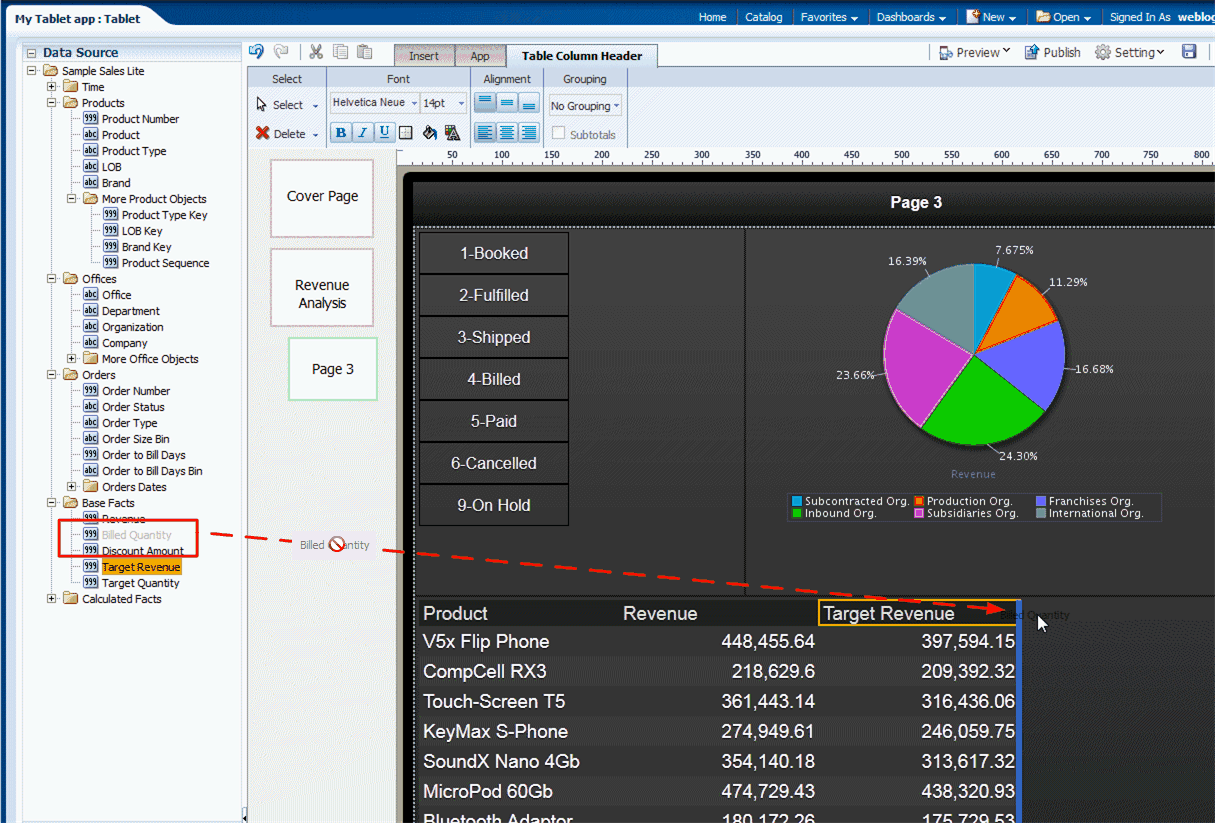
Select the bottom cell and then click the Insert tab. Click Table. Drag the following fields from the Data Source pane to the table:
-
Product Name
-
Revenue
-
Target Revenue
-
Billed Quantity
-
-
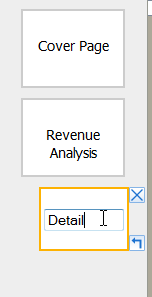
Finally, change the title of the subpage to "Detail" by double-clicking the text in the subpage icon as shown in Figure 2-29.
2.1.5 Preview Your App on a Mobile Device
Preview your app on your tablet:
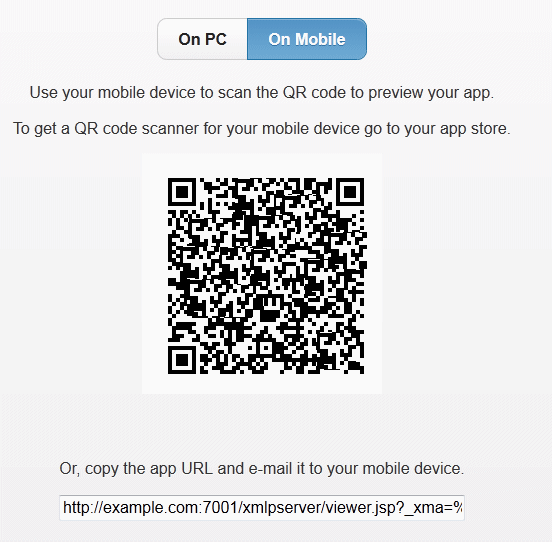
Click Preview and then click On Mobile. Use your tablet's QR code reader to obtain the URL to open your app in your tablet browser. Or, alternatively, copy the URL and e-mail it to your mobile device to open it.
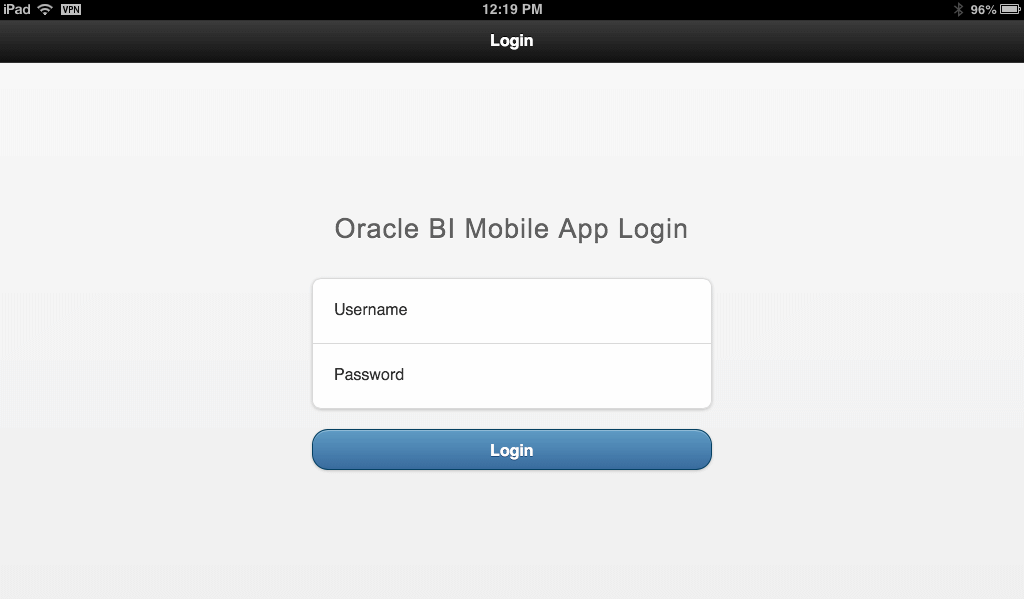
Enter your login credentials for Oracle BI Enterprise Edition to view your app on your mobile device.
To share with your colleagues, tap the page menu, and then tap Share to send e-mail link to your app.
