19 Managing Oracle Event Processing Server Logs
This chapter describes how you can use Oracle Event Processing Visualizer to view and configure the Oracle Event Processing server logging service and component loggers.
This chapter includes the following sections:
For more information, see Section 9.11, "Log Management".
19.1 Configuring Logs
This section describes:
19.1.1 How to Configure the Oracle Event Processing Server Logging Service
Using the Oracle Event Processing Visualizer, you can configure the logging system of a selected Oracle Event Processing server. By default, this logging configuration applies to all components.
To configure component-specific logging options, see Section 19.1.2, "How to Configure a Component Logger".
To configure the Oracle Event Processing server logging service:
-
In the left pane, click the Domain > Server node, where Domain refers to the name of your Oracle Event Processing domain and Server refers to the name of the server instance.
-
In the right pane, click the Logging tab.
-
Click the Logging Services tab.
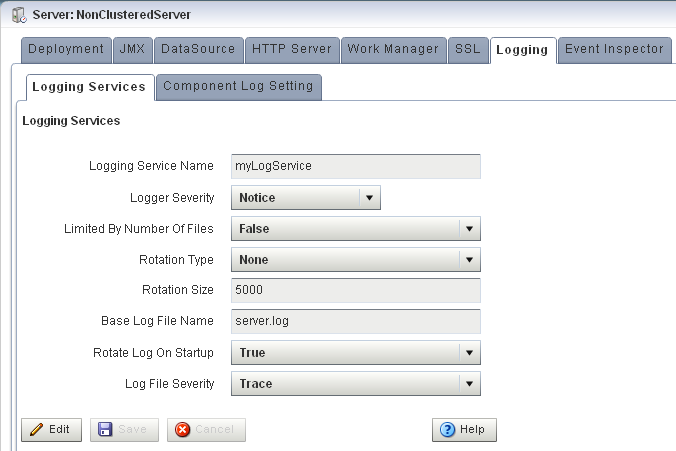
The Logging Services tab appears as Figure 19-1 shows.
-
Click Edit.
-
Edit the dialog as Table 19-1 describes.
Table 19-1 Logging Services Options
Attribute Description Logging Service NameSpecify the name of the logging service as the Oracle Event Processing server
config.xmlfile specifies.Logger SeveritySpecify the default log severity at which Oracle Event Processing server logs messages.
Limited By Number Of FilesSpecify whether or not to keep old log files indefinitely:
-
true: keep only the last 7 log files. -
false: keep all log files.
Rotation TypeSpecify when Oracle Event Processing server should close the existing log file and open a new one:
-
Size: Oracle Event Processing server closes the existing log file when it reaches the size (in KB) you enter in theRotation Sizefield. -
Time: Oracle Event Processing server closes the existing log file at the time you enter in the numeric entry field below the Rotation Type pull-down menu ink:mmformat, where k is the hour specified in 24 hour notation andmmis the minutes. Default-Value: 00:00. -
None: Oracle Event Processing server never closes the existing log file and allows it to grow to an unlimited size.
Rotation SizeWhen you specify
Rotation TypeasSize, enter the maximum log file size in KB.Base Log File NameThe name of the base log file.
Default:
server.log.Rotate Log On StartupSpecify whether or not Oracle Event Processing server closes the existing log file and creates a new one each time the Oracle Event Processing server starts up:
-
true: Oracle Event Processing server closes the existing log file and creates a new one each time the Oracle Event Processing server starts up. -
false: Oracle Event Processing server does not close the existing log file each time the Oracle Event Processing server starts up.
Log File Severity
Specify the default log file severity. Oracle Event Processing server (and, by default, all components), log messages at this severity:
-
Emergency -
Alert -
Critical -
Error -
Warning -
Notice -
Info -
Debug -
Trace
-
-
Click the Save button to commit your changes.
19.1.2 How to Configure a Component Logger
Using the Oracle Event Processing Visualizer, you can configure the logging properties of a selected component. Table 19-2 lists the components that are configured to log at the Notice log level, by default.
This section describes how:
To configure logging properties that apply to all components, see Section 19.1.1, "How to Configure the Oracle Event Processing Server Logging Service".
-
In the left pane, click the Domain > Server node, where Domain refers to the name of your Oracle Event Processing domain and Server refers to the name of the server instance.
-
In the right pane, click the Logging tab.
-
Click the Component Log Setting tab.
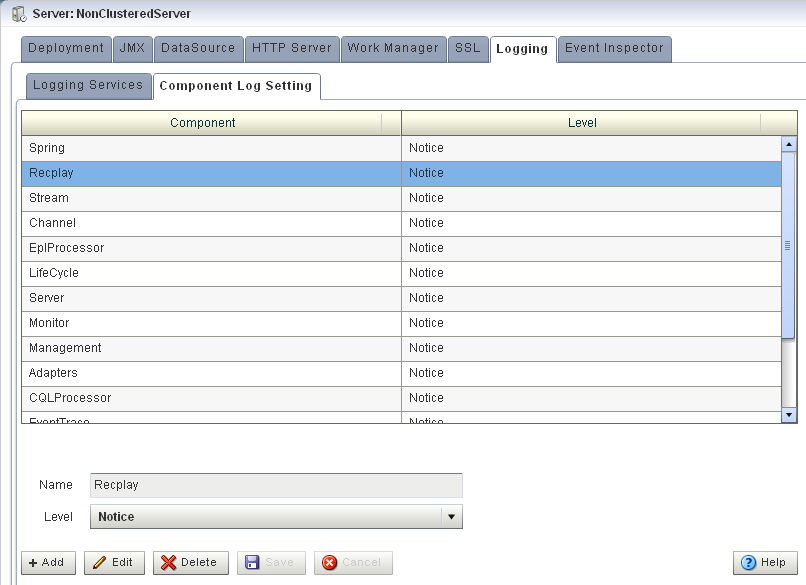
The Component Log Setting tab appears as Figure 19-2 show.
-
Click Add.
-
Enter the name of the component in the Name field.
You can choose any of the following:
-
Component name: a component name constant exactly as Table 19-2 lists.
Table 19-2 Logging Component Name Constants
Component Name Description AdaptersApplies to log messages from adapter instances running on the Oracle Event Processing server.
CacheApplies to log messages from caching systems and cache instances running on the Oracle Event Processing server.
ChannelApplies to log messages from channels running on the Oracle Event Processing server.
CQLProcessorApplies to log messages from Oracle CQL processors running on the Oracle Event Processing server.
CQLServerApplies to log messages from the CQLEngine, which is at the core of each CQLProcessor.
CQLServerTraceApplies to log messages from the CQLEngine, which is at the core of each CQLProcessor
EplProcessorApplies to log messages from EPL processors running on the Oracle Event Processing server.
EdeApplies to log messages from the Event-Driven Environment, the Oracle Event Processing server event-dispatching infrastructure.
EventTraceWhen set to
InfoorDebug, allows you to trace events as they flow through the EPN for all applications. You can dynamically change the severity of this log key using Oracle Event Processing Visualizer.At the
Infoseverity, you see log messages like this (although likely displayed on one line):<May 26, 2009 5:53:49 PM PDT> <Info> <EventTrace> <BEA-000000> <Application [helloworld], Stage [helloworldOutputChannel] received insert event>At the
Debugseverity, the log messages include details of the event:<May 26, 2009 6:02:34 PM PDT> <Debug> <EventTrace> <BEA-000000> <Application [helloworld], Stage [helloworldOutputChannel] received insert event [HelloWorldEvent: HelloWorld - the current time is: 6:02:34 PM]>LifecycleApplies to log messages from Oracle Event Processing server and application lifecycle operations.
ManagementApplies to log messages from Oracle Event Processing server general JMX-related management API operations.
MonitorApplies to log messages from the Oracle Event Processing server monitoring service.
RecplayApplies to log messages from Oracle Event Processing server event recording and playback operations.
SpringApplies to log messages from Spring container operations.
StreamApplies to log messages from stream instances running on the Oracle Event Processing server.
-
Application name: the module name of any Oracle Event Processing server or user-defined application. For example:
sample.HelloWorld. -
Package name: the name of any Oracle Event Processing server or user-supplied Java package. For example:
com.bea.wlevs.ede.For more information on Oracle Event Processing server packages, see the Oracle Fusion Middleware Java API Reference for Oracle Event Processing.
-
Class name: the fully qualified name of any Oracle Event Processing server or user-defined class. For example:
com.bea.wlevs.cep.core.EPRuntimeImpl.For more information on Oracle Event Processing server classes, see the Oracle Fusion Middleware Java API Reference for Oracle Event Processing.
-
-
Select the severity level from the Level drop-down menu:
-
Emergency -
Alert -
Critical -
Error -
Warning -
Notice -
Info -
Debug -
Trace
-
-
Click Save.
The component and the severity level is displayed in the table.
To change the logging level of a component:
-
In the left pane, click the Domain > Server node, where Domain refers to the name of your Oracle Event Processing domain and Server refers to the name of the server instance.
-
In the right pane, click the Logging tab.
-
Click the Component Log Setting tab.
The Component Log Setting tab appears as Figure 19-3 show.
-
Select the component entry in the table.
-
Click Edit.
-
Select the severity level from the Level drop-down menu:
-
Emergency -
Alert -
Critical -
Error -
Warning -
Notice -
Info -
Debug -
Trace
-
-
Click Save.
The new severity level is displayed in the table.
-
In the left pane, click the Domain > Server node, where Domain refers to the name of your Oracle Event Processing domain and Server refers to the name of the server instance.
-
In the right pane, click the Logging tab.
-
Click the Component Log Setting tab.
The Component Log Setting tab appears as Figure 19-4 show.
-
Select the component entry in the table.
-
Click Delete.
A confirmation dialog appears as Figure 19-5 shows.
Figure 19-5 Component Log Configuration Delete Confirmation
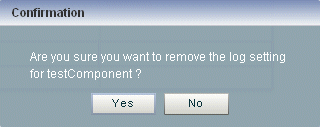
Description of "Figure 19-5 Component Log Configuration Delete Confirmation"
-
Click Yes.
The component logger is removed from the table.
19.2 Viewing Logs
This section describes:
19.2.1 How to Query Logs
Using the Oracle Event Processing Visualizer, you can run queries on the logs of a selected Oracle Event Processing server. The Query Logs feature allows you to view the information in the selected log files.
-
In the left pane, click the Domain > Server node, where Domain refers to the name of your Oracle Event Processing domain and Server refers to the name of the server instance.
-
Click Services and then click Log Query.
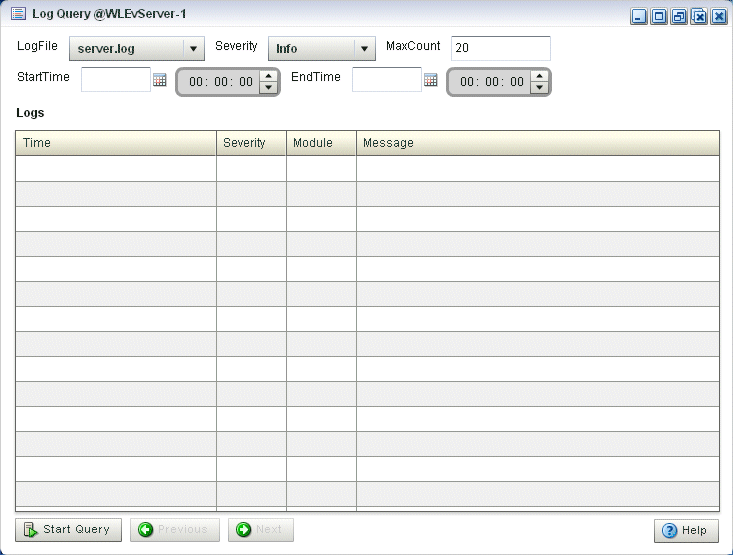
The Log Query screen is displayed, as shown in Figure 19-6.
-
Select the following options in the Log Query screen:
-
LogFile: Select the log file you want to query from the drop-down. -
Severity: Select the severity of the log file that you selected in the LogFile drop-down. -
MaxCount: Enter the maximum count of rows of log you wish to view for the selected log file. -
StartTime: Select the time when the query should start running. -
EndTime: Select the time when the query should stop.
-
-
Click Start Query.
All the log messages that match your query criteria for the selected log file of the selected Oracle Event Processing Server are displayed in the Logs pane, as shown in Figure 19-7.
Figure 19-7 Log Query Screen - Logs Displayed
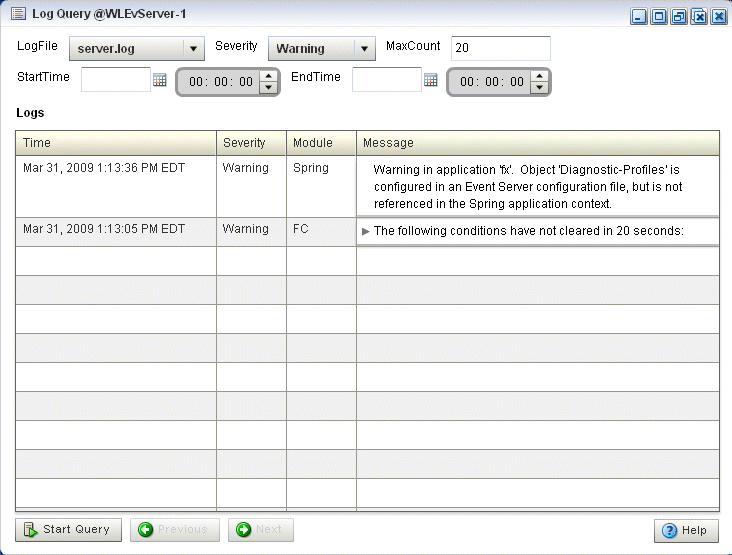
Description of "Figure 19-7 Log Query Screen - Logs Displayed"
-
If more messages are returned than can be displayed in the Logs pane, the Previous and Next buttons activate. Click the Previous and Next buttons to page through the messages.
19.2.2 How to View Console Output
Using the Oracle Event Processing Visualizer, you can view the console output of a selected Oracle Event Processing server.
-
In the left pane, click the Domain > Server node, where Domain refers to the name of your Oracle Event Processing domain and Server refers to the name of the server instance.
-
Click Services and then click Console Output.
The Console Output screen is displayed, as shown in Figure 19-8.
Figure 19-8 Sample Console Output for HelloWorld Application
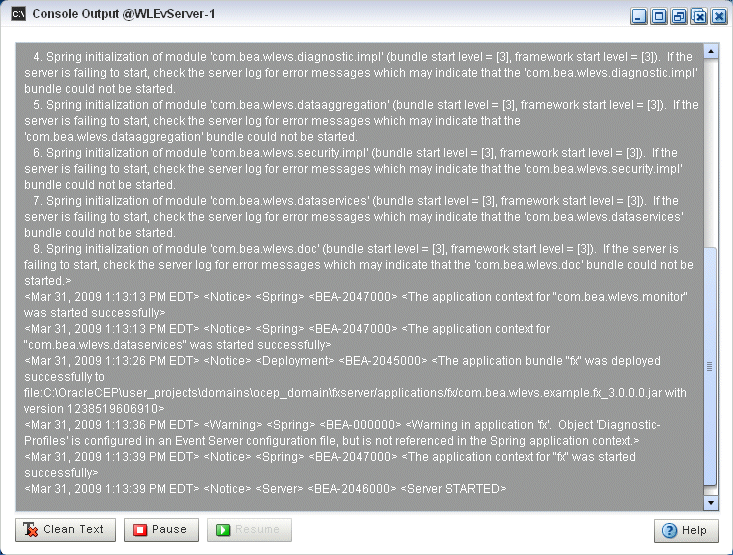
Description of "Figure 19-8 Sample Console Output for HelloWorld Application"
-
Click the Clean Text button to clear the text in the Console Output window.
-
Click the Pause button to pause the output of console messages.
-
Click the Resume button to resume the output of console messages.
