| Oracle® Fusion Middleware Administrator's Guide for Oracle SOA Suite and Oracle Business Process Management Suite 11g Release 1 (11.1.1.6.3) Part Number E10226-16 |
|
|
PDF · Mobi · ePub |
| Oracle® Fusion Middleware Administrator's Guide for Oracle SOA Suite and Oracle Business Process Management Suite 11g Release 1 (11.1.1.6.3) Part Number E10226-16 |
|
|
PDF · Mobi · ePub |
This chapter describes how to monitor BPMN process service components and service engines.
This chapter includes the following topics:
Section 38.1, "Viewing the Audit Trail and Process Flow of a BPMN Process Service Component"
Section 38.2, "Monitoring BPMN Process Service Component Instances and Faults"
Section 38.3, "Monitoring BPMN Process Service Component Instances"
Section 38.4, "Monitoring BPMN Process Service Engine Instances and Faults"
Section 38.5, "Monitoring BPMN Process Service Engine Request and Thread Statistics"
Section 38.6, "Monitoring BPMN Process Service Engine Instances"
Section 38.7, "Monitoring Deployed BPMN Processes in the Service Engine"
For more information, see the following sections:
This section describes how to view the audit trail and process flow of a BPMN process service component in a SOA composite application instance.
Note:
This section assumes a SOA composite application instance has been initiated. If not, see Section 8.1, "Initiating a SOA Composite Application Test Instance" for instructions.
When several messages are thrown in a short interval, they are not processed in the same order as they were sent. This can be apparent when you are examining the audit trail of a process instance.
To view the audit trail and process flow of a BPMN process service component:
Access this page through one of the following options:
| From the SOA Infrastructure Menu... | From the SOA Folder in the Navigator... |
|---|---|
|
|
The Dashboard page for the selected composite application appears.
Use one of the following methods to select an instance of the application:
For recent instances of this application, click the instance number of an instance in the Instance ID column of the Recent Instances section.
For all instances of this application, click the Instances tab, then click a specific instance in the Instance ID list.
The Flow Trace page displays the following details:
The Faults section shows the faults occurring in the services, service components, and references that comprise the SOA composite application. Sensors enable you to monitor BPMN process activities, variables, and faults during runtime. Selecting a fault highlights the row in the Trace section in which the fault occurred. Closing the fault clears the selection in the Trace section.
The Sensors section displays details about composite sensors included in the service and reference binding components of the SOA composite application. The total number of sensors is shown in the section header. Composite sensors can be added to service and reference binding components during design time in Oracle JDeveloper. You cannot add composite sensors to service components. Selecting a composite sensor in this section highlights the service or reference in the Trace section in which composite sensor data was collected. Closing the sensor clears the selection in the Trace section.
Note:
Expand the Faults or Sensors sections one at a time. The fault or sensor information is displayed only for viewing in this way.
The Trace section shows the sequence of the message flow through the services, service components, and references that comprise the SOA composite application.
The flow trace is a runtime trail of a message flow identified by an execution context ID (ECID) that is displayed in the upper right corner of the page. An ECID enables you to track a message flow that crosses instances of different composites. The flow trace lists all services, references, components across composites participating in the flow.
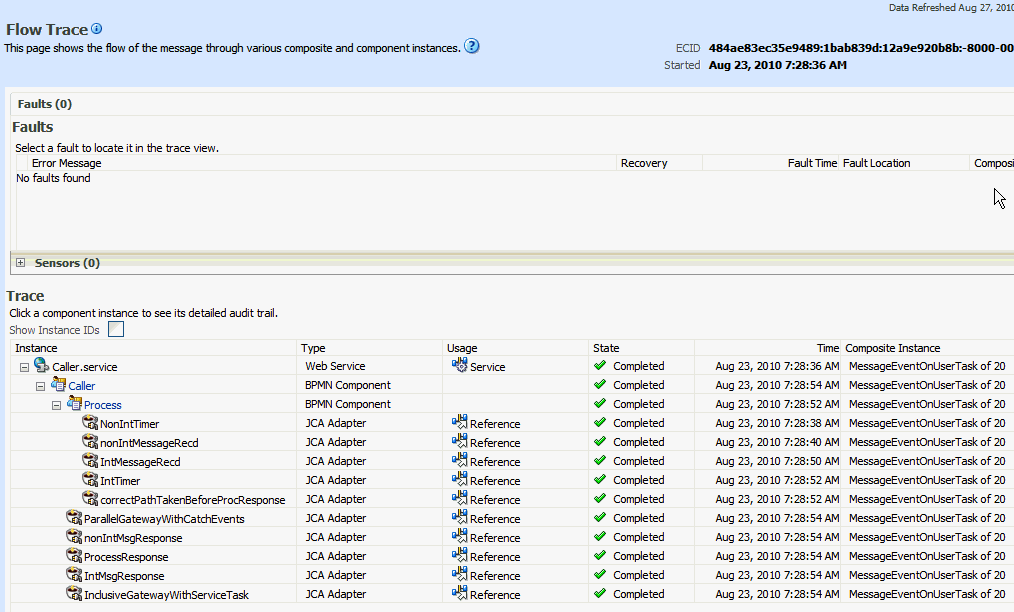
For the flow example in the Trace section, the service binding component and reference binding component involved in the flow have successfully received and processed messages.
Note the following restrictions with ECIDs:
A separate ECID is displayed for each instance of a composite application and not for the composite level ECID that can track the complete flow of any instances for the composite application.
To get complete flow information, you must find the composite level ECID in the log files. Use that value to get all information for a particular composite and therefore all its executed instances.
ECIDs are not propagated through business events. This can limit the amount of logging information that is collected. For example, if you publish an event that is subscribed to in the same composite application, limited logging information is available.
Select a fault in the Faults section.
This highlights the row in the Trace section in which the fault occurred.
Close the fault to clear the selection in the Trace section.
Expand the Sensors section to display composite sensors.
Select a sensor in the Sensors section.
This highlights the row in the Trace section in which the composite sensor data was collected.
In the Instance column of the Trace section, click a specific BPMN process service component instance. Service component instances can be accessed from this section; services and references cannot be accessed.
The Instance page appears, as shown in Figure 38-1.
Use these pages to view the audit trail, flow and faults of a BPMN process service component instance. The following links provide additional details about the instance:
Flow Trace link: Click the breadcrumbs in the upper left corner of the page to access the flow trace for the ECID (composite instance) that contains this BPMN component instance.
Information icon: Click the information icon to the right of the name of the BPMN component (in the page title) to see biographical information about this BPMN instance. This information includes a summary of the instance, including instance ID, ECID, instance startup time or last modification time, instance state (for example, running), and number of faults.
This icon is displayed only on the Audit Trail pages of BPMN processes and Oracle Mediators, and not on the pages of human tasks and business rules.
Current Audit Level: Click to display information details, such as the audit level used by this instance.
When you first open the Instance page, the Audit Trail page is displayed by default. It provides execution details about the activities in the BPMN process.
| Column | Description |
|---|---|
|
Activity |
Lists all the BPM constructs available in a process in the order they are executed. These include:
|
|
Loop Count Event |
If the activity referred to in a row of the audit trail table is a subprocess with the loop characteristic set to either Loop or Multi-instance, this column shows the value of the |
|
Event |
When any BPMN construct executes, audit is logged twice: once when it enters that activity, and once when it leaves that activity to move to next activity. If the node is collapsed, it shows you whether the activity is completed, processing, or canceled. |
|
Date |
Time stamp showing when the item was posted. |
|
Copy |
If some activities are executed simultaneously—for example, on different paths in a parallel gateway—the copy keeps the number of threads used for this purpose. |
Scroll through the audit trail to check for errors and expand the payload links to view their contents at a given point in the flow.
When you click a payload link, the Payload XML page appears. This page shows the value of data objects which had out data association at that particular point in the process.
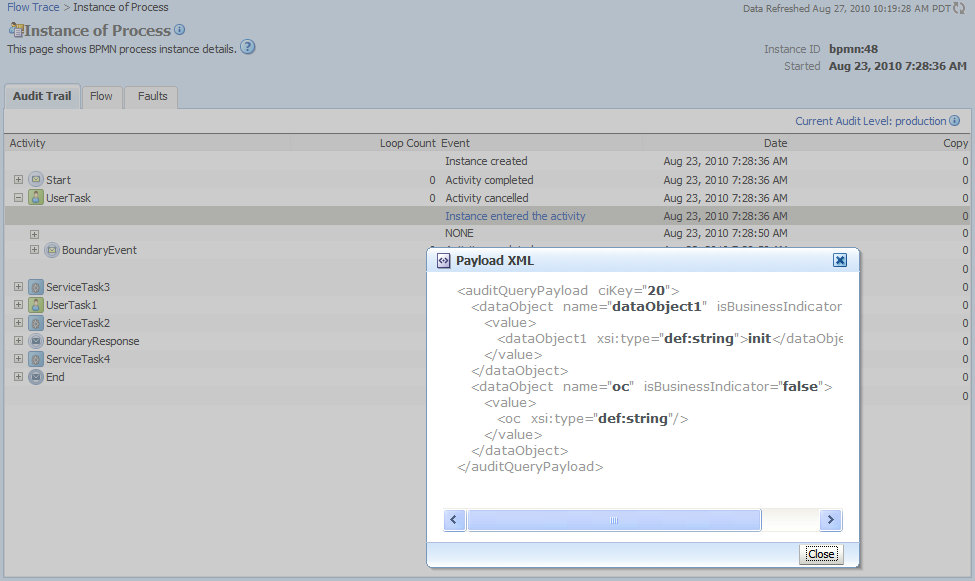
Click the Flow tab.
A flow diagram of the BPMN process activities appears. This flow diagram shows a fault highlighted in a BPMN process activity.
Click an activity to view the flow of the payload through the process.
Note:
If using Microsoft Internet Explorer, you can click Copy details to clipboard to copy the activity details to the clipboard. If using Mozilla Firefox, this link does not appear. Instead, you must manually select the text and copy and paste it to a file.
Scroll through the flow diagram to check for errors and click the highlighted activity to view error messages.
Close the window.
Click the Faults tab.
This page shows the error message, whether you can recover from the fault, the time at which the fault occurred, and the activity in which the fault occurred. This page displays the faults in the BPMN component instance (but not the faults that occurred in a service or reference binding component).
You can recover from instance faults identified as recoverable. This page lists all instance faults, recoverable or not. The component instance faults that occurred in a service or reference are not listed here.
This page enables you to target individual faults from which to recover, and provides a degree of fault recovery granularity not available on other pages.
However, you cannot perform bulk fault recoveries on this page. To perform bulk fault recovery, use one of the following pages:
Faults and Rejected Messages page of a specific SOA composite application or of the SOA Infrastructure.
Faults page of the BPMN process service engine or of a specific BPMN process service component.
Select a fault for recovery that has been identified as recoverable through one of the following methods. The page refreshes to display a fault recovery section at the bottom of the page.
If you click a fault in the Error Message column, a popup message displays details about the fault, including the fault ID, fault time, fault location, fault type, and complete error message text. If the fault is identified as recoverable, a Recover Now button is displayed that you can click.
You click a fault identified as recoverable in the Recovery column.
Select an action from the Recovery Action list.
| Action | Description |
|---|---|
|
Retry |
Retries the instance with an option to provide a retry success action. An example of a scenario in which to use this recovery action is when the fault occurred because the service provider was not reachable due to a network error. The network error is now resolved. |
|
Abort |
Terminates the entire instance. |
|
Replay |
Replays the entire scope again in which the fault occurred. |
|
Rethrow |
Rethrows the current fault. BPMN fault handlers (catch branches) are used to handle the fault. By default, all exceptions are caught by the fault management framework unless an explicit rethrow fault policy is provided. |
|
Continue |
Ignores the fault and continues processing (marks the faulting activity as a success). |
Your selection causes additional fields to appear. For example, the following fields display if you select Rethrow.
Use the After Successful Retry list to select defined actions to invoke after a successful retry. If you select a variable in the Variable list, you can edit the value in the Value text box.
Click the Back button of your browser to exit the flow diagram.
You can monitor BPMN process service component recent instances and faults. Each service component in a SOA composite application has its own instance ID. These IDs are different from the overall instance ID of the SOA composite application of which each service component is a part.
To monitor BPMN process service component instances and faults:
Access this page through one of the following options:
| From the SOA Infrastructure Menu... | From the SOA Folder in the Navigator... |
|---|---|
|
|
In the Component Metrics section, select the BPMN process service component.
Click Dashboard.
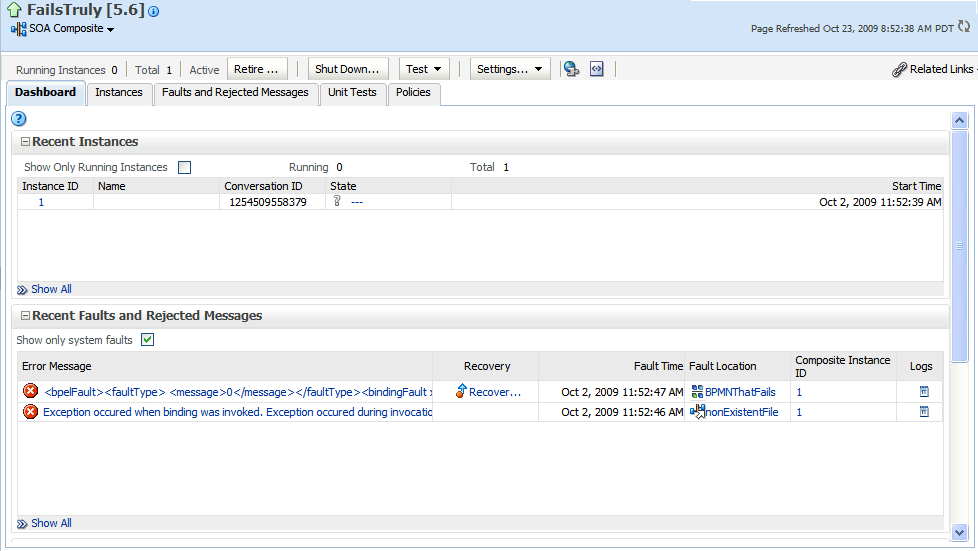
The upper part of the Dashboard page displays the following details:
Recent instances of the BPMN process service component, including the instance ID, the state of the instance (for example, completed successfully or faulted), the start time, the last modification time, and logs describing the instance.
Recent faults in the BPMN process service component, including the error message, whether you can recover from the fault, the time at which the fault occurred, the instance ID of the BPMN service component, the BPMN activity in which the fault occurred, and logs describing the fault.
The average processing time for each activity in the BPMN process service component.
In the Recent Instances section, you can perform the following tasks:
View the audit trail, process flow and faults of a service component. To do this task, in the Instance ID column, click the instance ID of that service component.
Access the Log Messages page with filtered messages specific to that instance. To do this task, in the Logs column, click a specific log.
Access the Instances page of the service component. To do this: Click Show All below the section.
In the Recent Instances and Faults section, you can perform the following tasks:
Display complete information about a fault. To do this task, in the Error Message column, click an error message. If the fault is identified as recoverable, you can perform fault recovery by clicking the Recover Now link.
Perform fault recovery at the component instance level. To do this task, in the Recovery column, click a fault identified as Recoverable.
Access the Log Messages page with filtered messages specific to that instance. To do this task, in the Logs column, click a specific log.
Access the Faults page of the service component. To do this task, click Show All below the section.
The lower part of the Dashboard page displays the following details:
A graphical representation of the number of successful, faulted, and incoming (pending) instances of the BPMN process service component over a specific time range.
The number of faults and message processed by any reference binding component with which this BPMN process service component communicated.
For more information, see Section 1.2.3, "Introduction to SOA Composite Application Instances."
You can monitor BPMN process service component instances. Each service component has its own unique instance ID. This ID is in addition to the instance ID of the overall SOA composite application of which this service component is a part.
To monitor BPMN process service component instances:
Access this page through one of the following options:
| From the SOA Infrastructure Menu... | From the SOA Folder in the Navigator... |
|---|---|
|
|
In the Component Metrics section, select the BPMN process service component.
Click the Instances tab.
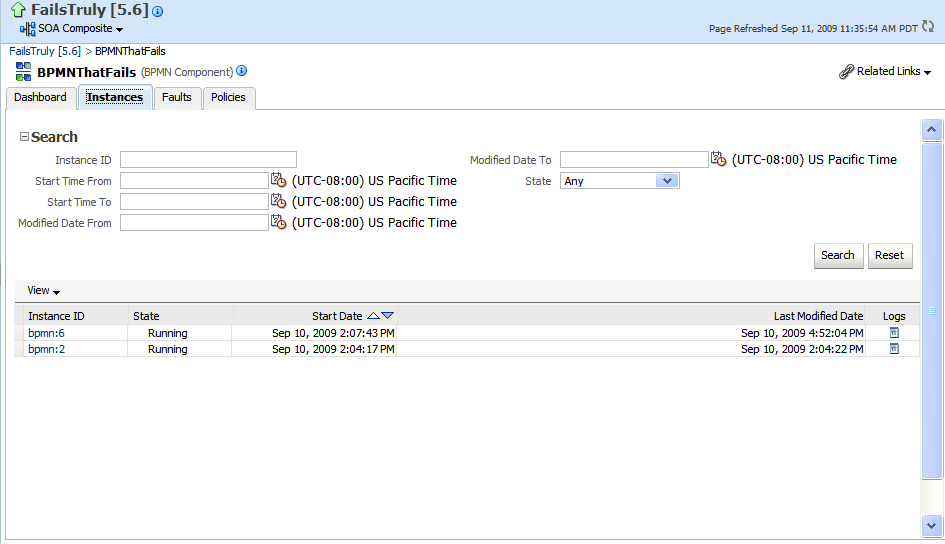
The Instances page displays the following details:
A utility for searching for a specific BPMN service component instance by specifying criteria and clicking Search.
BPMN process service component instances, including the instance ID, instance state (for example, completed or faulted), instance start time, last instance modification time, and log files describing the instance.
In this page, you can perform the following tasks:
View the audit trail, process flow, and faults of a service component. To do this task, in the Instance ID column, click the instance ID for a service component.
Access the Log Messages page with filtered messages specific to that instance. To do this task, in the Logs column, click a specific log.
For more information, see Section 1.2.3, "Introduction to SOA Composite Application Instances."
You can monitor instances and faults of all BPMN process service components running in the BPMN process service engine. These BPMN process service components can be part of separate SOA composite applications.
To monitor BPMN process service engine instances and faults:
Access this page through one of the following options:
| From the SOA Infrastructure Menu... | From the SOA Folder in the Navigator... |
|---|---|
|
|
Click Dashboard.
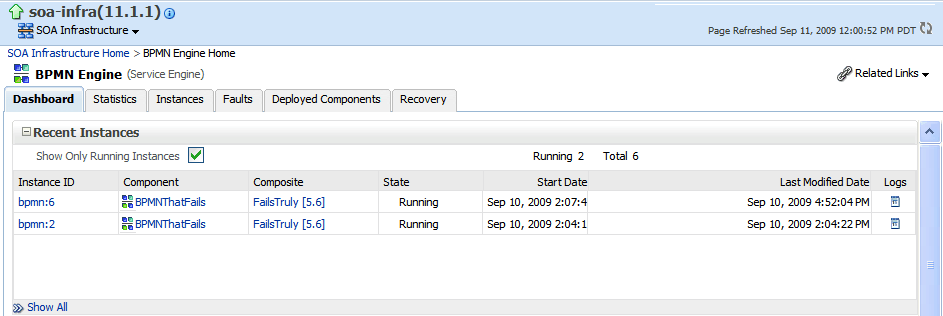
The upper part of the Dashboard page displays recent instances of all BPMN process service components running in the BPMN process service engine, including the instance ID of the service component, the service component name, the SOA composite application of which the service component is a part, the state of the instance (for example, completed successfully or faulted), the instance start time, the last modification time, and logs describing the instance.
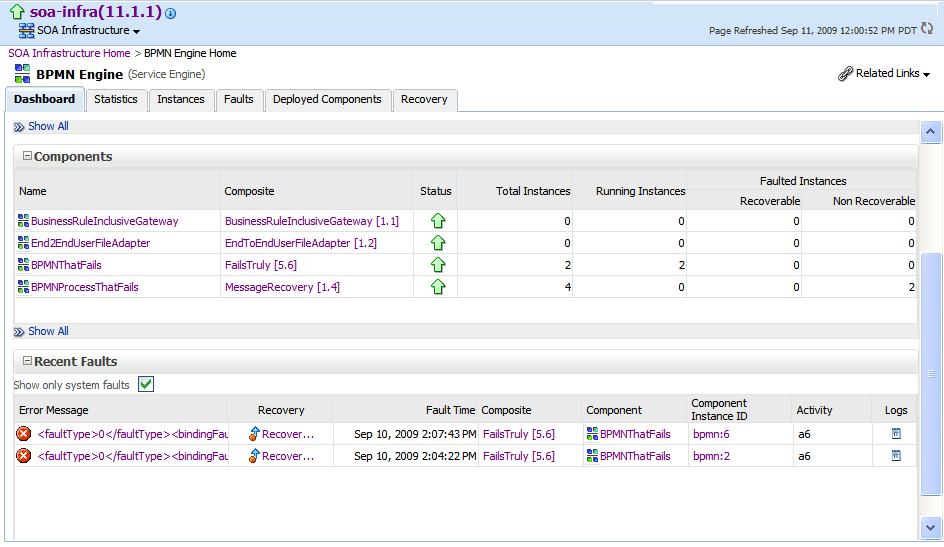
The lower part of the Dashboard page displays the following details:
The service components running in the service engine, the SOA composite applications of the service components, the state of the applications (for example, running), and the total, running, and faulted instances in the service engine.
The recent faults in the service engine, including the error message, whether you can recover from the fault, the time at which the fault occurred, the SOA composite application in which the fault occurred, the service component, the instance ID of the service component, the activity in which the fault occurred, and log files describing the fault.
In the Recent Instances section, you can perform the following monitoring tasks:
View the audit trail, process flow and faults of a service component. To do this task, in the Instance ID column, click an instance ID for the service component.
Access the home page of a service component. To do this task, in the Component column, click a specific service component.
Access its home page of a SOA composite application. To do this task, in the Composite column, click the specific SOA composite application.
Access the Log Messages page with filtered messages specific to an instance. To do this task, in the Logs column, click the specific log.
Access the Instances page of the service engine. To do this task, click Show All below the section.
In the Components section, you can perform the following tasks:
Access the home page of a specific service component. To do this task, in the Name column, click the specific service component.
Access the home page of a specific SOA composite application. To do this task, in the Composite column, click the specific SOA composite application.
Access the Deployed Components page of the service engine. To do this task, click Show All below the section.
In the Recent Faults section, you can perform the following tasks:
Display complete information about a fault. To do this task, in the Error Message column, click an error message. If the fault is identified as recoverable, click the Recover Now link to perform fault recovery.
Perform fault recovery at the component instance level. To do this task, in the Recovery column, click a fault identified as Recoverable.
Access the home page of a specific SOA composite application. To do this task, in the Composite column, click the specific SOA composite application.
Access the home page of a specific service component. To do this task, in the Component column, click a specific service component.
View the audit trail, process flow and faults of a service component. To do this task, in the Component Instance ID column, click an instance ID for a service component.
Access the Log Messages page with filtered messages specific to a fault. To do this task, in the Logs column, click the specific log.
For more information, see Section 1.2.4, "Introduction to Service Components and Service Component Instances."
You can monitor request and thread statistics for all BPMN process service components running in the service engine.
To monitor BPMN process service engine request and thread statistics:
Access this page through one of the following options:
| From the SOA Infrastructure Menu... | From the SOA Folder in the Navigator... |
|---|---|
|
|
Click Statistics.
The upper part of the Statistics page displays the following details. Click the Help icon for additional details.
Pending requests in the service engine
Active requests in the service engine
Thread statistics for the service engine
The lower part of the Statistics page displays details about the count and minimum, maximum, and average request processing times.
You can monitor all BPMN process service component instances running in the service engine. These BPMN process service components can be part of separate SOA composite applications.
To monitor BPMN process service engine instances:
Access this page through one of the following options:
| From the SOA Infrastructure Menu... | From the SOA Folder in the Navigator... |
|---|---|
|
|
Click Instances.
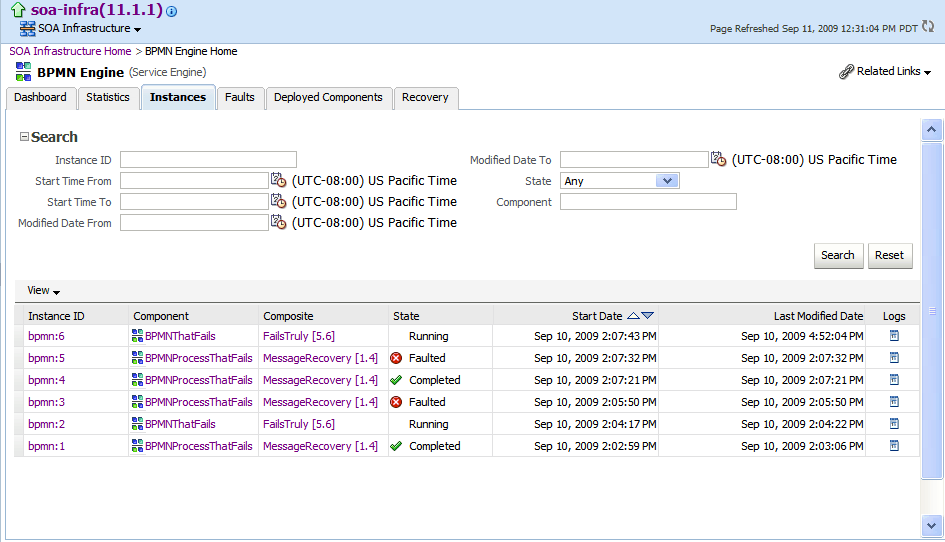
The Instances page displays the following details:
A utility for searching for a specific instance by specifying criteria and clicking Search.
Instances, including the instance ID of the service component, the service component name, the SOA composite application name, the state of the instance (for example, completed successfully, running, or faulted), the instance start time, the last modification time, and log files describing the instance.
In the Instances section, you can perform the following monitoring tasks:
View the audit trail, process flow, sensor values, and faults of a service component. To do this task, in the Instance ID column, click an instance ID for a service component.
Access the home page of a specific service component. To do this task, in the Component column, click the specific service component.
Access the home page of a specific SOA composite application. To do this task, in the Composite column, click the specific SOA composite application.
Access the Log Messages page with filtered messages specific to an instance. To do this task, in the Logs column, click the specific log.
For more information, see Section 1.2.4, "Introduction to Service Components and Service Component Instances."
You can monitor all deployed SOA composite applications with BPMN process service components running in the service engine.
To monitor deployed BPMN processes in service engines:
Access this page through one of the following options:
| From the SOA Infrastructure Menu... | From the SOA Folder in the Navigator... |
|---|---|
|
|
Click Deployed Components.
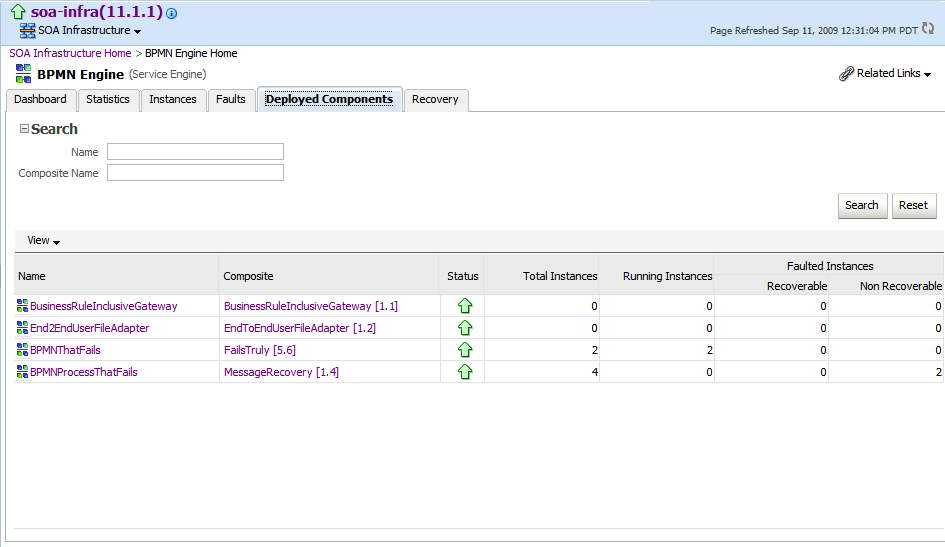
The Deployed Components page displays the following details:
A utility for searching for a specific deployed SOA composite application by specifying criteria and clicking Search.
Details about deployed SOA composite applications with BPMN process service components running in this service engine, including the service component name, the SOA composite application, the current status, and the total, running, and faulted instances in the service engine.
To access the home page of a specific service component, in the Name column, click the specific service component.
To access the home page of a specific SOA composite application, in the Composite column, click the specific SOA composite application.