| Oracle® Enterprise Manager Cloud Control Getting Started with Oracle Fusion Middleware Management 12c Release 2 (12.1.0.2) Part Number E24215-03 |
|
|
PDF · Mobi · ePub |
| Oracle® Enterprise Manager Cloud Control Getting Started with Oracle Fusion Middleware Management 12c Release 2 (12.1.0.2) Part Number E24215-03 |
|
|
PDF · Mobi · ePub |
This chapter describes the procedure to discover and monitor a Coherence cluster using Oracle Enterprise Manager Cloud Control 12c. The following sections are covered in this chapter:
Oracle Coherence is an in-memory data-grid and distributed caching solution. It is composed of many individual nodes or JVMs which work together to provide highly reliable and high speed virtual caching.
Enterprise Manager provides deep visibility into performance of all the artifacts such as caches, nodes, and services. The Cluster Home page displays an overview of the performance hotspots such as nodes with minimum available memory, publisher and receiver success rate, and nodes with maximum send queue size. The Cluster Home page provides immediate visibility into the worst caches in the system based on hits to gets ratio which is an overall health indicator for the cluster.
Nodes and caches can be proactively monitored by the Incident Management feature. You can create a monitoring template by pre-populating the monitoring template with metrics for a Coherence target. You can export and import monitoring templates to share monitoring settings between different Enterprise Manager deployments.
Metric Extensions are the next generation of User-Defined Metrics, which enable you to extend Enterprise Manager to monitor conditions specific to the enterprise's environment by creating new metrics for any target type. The inclusion of Metric Extensions as part of the exported or imported monitoring template provides an easy way to share many Metric Extensions at a time between Enterprise Manager deployments.
You can correlate cluster nodes with the underlying hosts to determine CPU and memory utilization on those hosts in order to make better decisions for scaling your clusters. You can see the association of the caches, nodes, hosts and also Oracle WebLogic targets using Coherence*Web applications.
Highly customizable performance views for monitoring performance charts and trends are available. You can overlay metrics for multiple nodes or caches in the same or different cluster for detail analysis to provide detailed visibility at the desired level. The drill down views allows you to determine the root cause of performance problems or simply identify performance trends in the Coherence Cluster.
To ensure that node departure is detected and resolved in a timely manner, you can setup a monitoring policy to detect departing nodes and replenish those many nodes.
Enterprise Manager provides a centralized cache data management feature that allows you to perform various cache operations such as add/remove index, view cache data, view query explain plan, and so on.
Enterprise Manager monitors the changing configuration of the nodes over a period of time. You can compare configurations of multiple nodes which helps identify performance bottlenecks caused by configuration changes. The Topology Viewer provides a high level topology of the entire cluster and shows the relation between caches, nodes and hosts. You can customize topology view to show some key performance metrics as well.
All of the Coherence Management features are integrated with JVM Diagnostics and provide real-time visibility into the node JVMs. You can drill down to a Coherence node's JVM from within the context of a cache and a cluster to identify the method or thread that is causing a delay. The JVM Diagnostics feature is part of the WLS Management Pack EE and Management Pack for NonOracle Middleware.
Enterprise Manager provides a complete provisioning solution. You can maintain an Oracle Coherence setup image or gold image in the Software Library and deploy it throughout the infrastructure to create completely new clusters or add nodes an existing cluster. You can use the same deployment procedure to updates nodes as well.
This section lists the new features in Oracle Enterprise Manager Cloud Control 12c. The new features are:
Cache Data Management: You can view, export, import, insert, update, purge, add, and remove indexes, view query explain plan and view trace. See Cache Data Management for details.
Topology Viewer: You can view the top-down hierarchy of the Coherence nodes, caches, clusters, and their related targets in the Topology Viewer. See Viewing Configuration Topology for details.
Configuration Metrics Support: You can store Coherence configuration metrics and perform operations like compare configurations, view last collected configurations, search for configuration data, view saved configurations, and view configuration history. See the Oracle Enterprise Manager Lifecycle Management Administrator's Guide for details on configuration metrics.
Performance Summary and Metric Palette Integration: You can plot charts for critical Coherence cluster component metrics such as node metrics, cache metrics, service metrics, and host metrics. See Viewing Performance Summary for details.
JVM Diagnostics Integration: You can drill down to a Coherence node's JVM from within the context of a cache and a cluster to identify the method or thread that is causing a delay. The JVM Diagnostics feature is part of the WLS Management Pack EE. See Integration with JVM Diagnostics for details.
Log File Alerts: You can set up alerts based on a pattern in a log file. Log files are periodically scanned for the occurrence of desired patterns and an alert is raised when the pattern occurs during a given scan. See Log File Monitoring for details.
Push Replication: If a push replication enabled cache is present in your cluster, you can now view the Publisher and Subscriber tables. See Push Replication Pattern for details.
Transaction Cache Support: You can now view specialized distributed caches or transactional caches in a service. See Transactional Cache Support for details.
Reap Session Support: You can now view then reap session metrics in the Application Home page. See Reap Session Support for details.
Coherence Provisioning Enhancements: In this release, the Well Known Address and the Update Nodes features are now available. For more details, see the Oracle Enterprise Manager Lifecycle Management Administrator's Guide.
Elastic Data Support: Elastic data is used to seamlessly store data across memory and disk-based devices. To support this feature, new performance and configuration metrics have been added to the Coherence node target in Enterprise Manager 12c.
Replenish Storage Enabled Nodes: You can configure corrective actions to start stopped/crashed storage enabled nodes. This enables cluster operation with minimal disruption.
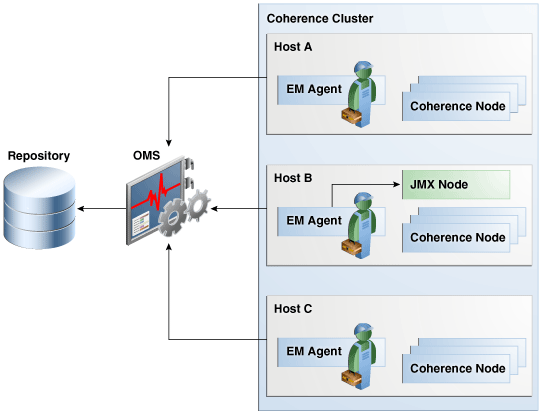
Enterprise Manager monitors the entire Coherence cluster and its artifacts. The key targets that can be monitored are Oracle Coherence Cluster, Oracle Coherence Node, and Oracle Coherence Cache. The Oracle Coherence Cluster target provides a high level view of the health of the entire cluster. The Oracle Coherence Node and Oracle Coherence Cache are child targets of the Oracle Coherence Cluster. In addition to monitoring the above target types, additional Coherence components such as Services, Connections, and Applications can also monitored.
Figure 16-1 shows the Coherence Monitoring Setup.
As shown in Figure 16-1, a typical Coherence deployment has nodes running on one or more hosts. In order to monitor the Coherence cluster in Enterprise Manager, a central Coherence JMX management node must be configured. This JMX management node must expose all Coherence MBeans and attributes. In addition to configuring the JMX management node, the Management Agent must also be installed and configured on the same host as JMX management node. This is required to discover and monitor the Coherence cluster in Enterprise Manager. To provision new Coherence nodes, start, and stop nodes, the Management Agent must be installed on all hosts on which the nodes are running.
The Management Agent uses the JMX management node (centralized MBean server) to discover and monitor the entire Coherence cluster, including the nodes and caches. As a best practice, it is recommended that the Management Agent is present on the same host as the JMX management node that is used to discover and monitor the Coherence cluster. The Management Agent must be setup on all the machines on which the Coherence nodes are running to monitor and provision the cluster. See the Using JMX to Manage Coherence chapter in the Oracle Coherence Management Guide for more details on using JMX to manage Oracle Coherence.
The following .jar files must be present in the classpath along with other application specific .jar files.
<OEM_Agent_Home>/plugins/oracle.sysman.emas.agent.plugin_12.1.0.3.0/archives/coherence/coherenceEMIntg.jar
<OEM_Agent_Home>/plugins/oracle.sysman.emas.agent.plugin_12.1.0.3.0/archives/coherence/bulkoperationsmbean.jar
Note:
The location of the .jar files may change based on the plugin version.The following Java options must be specified:
-Dtangosol.coherence.management.remote=true
-Dtangosol.coherence.management=all
-Dcom.sun.management.jmxremote.port=<open TCP port>
-Dtangosol.coherence.cluster=<cluster name>
-Dtangosol.coherence.member=<unique name in the cluster>
-Dtangosol.coherence.machine=<fully qualified hostname>
-Doracle.coherence.machine=< fully qualified hostname >
-Dtangosol.coherence.distributed.localstorage=false
-server
-Xms256m -Xmx256m (you must ensure that there are adequate resources for the management node)
Unless JMX authentication is required, add the following Java options:
-Dcom.sun.management.jmxremote.authenticate=false
-Dcom.sun.management.jmxremote.ssl=false
For more details on JMX authentication, refer to the Java documentation.
If you are using a shell script to start the JMX Management Node, you must use the following startup class for Java.
oracle.sysman.integration.coherence.EMIntegrationServer
This option is supported only for Coherence 3.7 and later versions.
If you are starting the JMX Management Node using the WebLogic Console, you cannot customize the JMX management node start up class. To address this, you must add the custom-mbeans.xml to the Coherence server that will act as the JMX management node. Add the following snippet to the custom-mbeans.xml file.
<mbeans>
  <mbean id="100">
    <mbean-class>oracle.sysman.integration.coherence.CacheDataManager
    </mbean-class>
    <mbean-name>type=Custom,name=CacheDataManager
    </mbean-name>
    <enabled>true</enabled>
  </mbean>
  <mbean id="110">
    <mbean-class>oracle.as.jmx.framework.bulkoperations.BulkOperationsMBeanImpl
    </mbean-class>
    <mbean-name>type=BulkOperations</mbean-name>
    <enabled>true</enabled>
  </mbean>
</mbeans>
To start other nodes in the cluster, you must add the following Java options:
-Dtangosol.coherence.management.remote=true
-Dtangosol.coherence.member= <unique member name in the cluster>
-Dtangosol.coherence.cluster= <cluster name>
-Dtangosol.coherence.machine=<fully qualified hostname>
-Doracle.coherence.machine=<fully qualified hostname>
Note:
If you are planning to start or stop Coherence nodes from Enterprise Manager, you must specify the following additional start Java options:-Doracle.coherence.startscript=<node start script>
-Doracle.coherence.home=<coherence home>
If you are using the WebLogic Console to start a Coherence node (or Coherence Server as referred to within the WebLogic Console), you can use the WebLogic Console to customize the start arguments of the server. If you are starting the Coherence node in a WebLogic Managed Server, you can specify the above parameters in the startWebLogic.sh or in the script you use to start the WebLogic server.
After the JMX management node has been configured, you can use tools such as JConsole to verify if all the Coherence MBeans and attributes are available at the management node. Ensure that you are using the Machine Name:Port (and JMX credentials if any) to connect to the JMX management node.
JVM Diagnostics provides deep visibility into the runtime of the JVM. JVM Diagnostics allows administrators to identify the root cause of performance problems in the production environment without having to reproduce them in the test or development environment. You can view the JVM Diagnostics data if the JVM Diagnostics Manager and JVM Diagnostics Agent have been deployed on the host machine on which the OMS running. To setup JVM Diagnostics on each Coherence node, you must download the JVM Diagnostics Agent.
To download the JVM Diagnostics Agent, follow the steps listed in the Oracle Enterprise Manager Cloud Control Administrator's Guide. When the JVM Diagnostics is downloaded, the jamagent.war file is downloaded. You must to copy the .war file to all machines on which the Coherence nodes are to be integrated with JVM Diagnostics, and add it to the classpath. See Best Practices for more information on how to start a Coherence node with JVM Diagnostics.
Prerequisites
To monitor a Coherence cluster in Enterprise Manager, the following prerequisites must be met:
Install the 12.1.0.2.0 Management Agent on all hosts where Coherence nodes are running.
Deploy the 12.1.0.3.0 Fusion Middleware Plug-in on all the Management Agents.
Verify that all Coherence MBeans are available in the Coherence JMX management node as described in Verifying the JMX Management Node Configuration.
To discover a Coherence target, follow these steps:
Login to Enterprise Manager as an administrator with the Add Target privilege.
From the Targets menu, select Middleware. You will see a list of Middleware targets.
Note:
Alternatively, you can add a Coherence target from the Setup menu. From the Setup menu, select Add Target, then select Add Targets Manually. In the Add Targets Manually page, select the Add Non-Host Targets Using Guided Process option. Follow the steps in the wizard to add the Coherence target.Select Oracle Coherence in the Add drop-down box and click Go. The Oracle Coherence Cluster: Discover Cluster, Node, and Cache Targets page is displayed.
On this page, specify the connection details of the Coherence JMX management node. This is required to discover the Coherence cluster, node and cache targets. You can select either of the following options to provide MBean Server details:
Host, Port, and Service: Enter the following details:
Select the host on which the Management Node is running.
The port used for the JMX RMI connection. If you are using the MBean connector for Coherence MBeans, specify the tangosol.coherence.management.remote.connectionport property.
Note:
It is recommended that you use thecom.sun.management.jmxremote.port property.The service name used for the connection. The default is jmxrmi.
Service URL that will be used for the connection. You may need to specify the Service URL only in complex cases like when the RMI registry and the MBean Server ports are different. It is recommended that you use the Machine Name and Port option for the MBean server connection.
Select the Management Agent that will be used to monitor the Coherence target and click Continue.
The details of the discovered targets are displayed. Click Add Targets to add these targets to Enterprise Manager.
Note:
To automatically discover a new node or target in Enterprise Manager, you must configure the following corrective actions in the Metric and Collection Settings page:Cluster Size Change (To Add Node Entities) on the Node Replenish and Entity Discovery Alert metric.
Change in Number of Caches (To Add Cache Entities) on the Cache Entities Discovery Alert metric. This metric is not available out-of-the-box.
Corrective Actions allow administrators to specify automated responses to alerts or policy violations. Corrective Actions ensure that routine responses to alerts or policy violations are automatically executed, thereby minimizing administrator intervention and ensuring that problems are dealt with before they noticeably impact end users.
If you add a node or a cache after the cluster has been discovered, you must setup the Discover New Oracle Coherence Nodes and Discover New Oracle Coherence Caches corrective actions to add the node and cache as Enterprise Manager Targets. To setup the corrective actions, follow these steps:
From the Targets menu, select Middleware, then click on a Coherence Cluster target.
The Cluster Home page is displayed. From the Oracle Coherence Cluster menu, select Monitoring, then select Metric and Collection Settings. The Metric and Collection Settings page is displayed.
Click the Edit icon for the Change Number of Nodes metric. The Edit Advanced Settings page appears.
Under the Corrective Actions section, click Add for the metric severity (Warning or Critical) for which a corrective action is to be associated.
Click Continue. The Add Corrective Action page is displayed.
Select the Discover New Coherence Nodes corrective action from the list and click Continue.
In the Create Corrective Action page, enter the name and description of the corrective action and click Continue. You are returned to the Edit Advanced Settings page with the corrective action set for the metric Warning and/or Critical metric thresholds.
Follow this process to set the corrective action for the Change Number of Caches metric.
You can manually synchronize the cluster targets with the running Coherence cluster. Click Refresh Cluster from the Oracle Coherence Cluster menu. A message indicating that new Coherence nodes and caches that have been discovered will be added as Enterprise Manager targets is displayed. Nodes are updated if there are any changes to their attributes. Click Continue to refresh the cluster. This ensures that the latest changes are applied.
Note:
Decommissioned nodes and caches will not be removed during the Refresh process. You must remove them manually.You must enable the Management Pack for Oracle Coherence if you want to access additional features beyond Coherence cluster monitoring. To enable the Management Pack, do the following:
From the Setup menu, select Management Packs, then select Management Pack Access.
Select Oracle Coherence in the Search drop-down list and click Go.
All the Coherence targets being monitored are displayed. Check the Pack Access Agreed check box for the Coherence target and click Apply to enable the Management Pack.
|
Copyright © 2011, 2012, Oracle and/or its affiliates. All rights reserved. Legal Notices |
|