39.3 New Graph Types
Oracle Reports 11g Release 1 (11.1.1) supports the following and graph types:
39.3.1 Funnel Graph
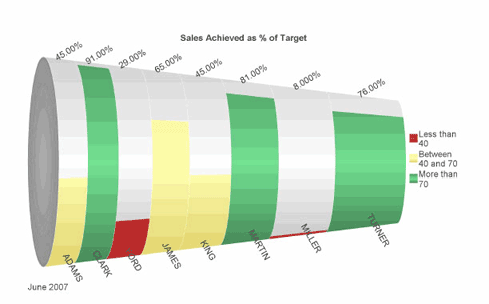
A funnel graph is a visual representation of data related to steps in a process. As the value for a given step of the funnel approaches the quota for that slice, the slice fills. A funnel renders a three-dimensional chart that represents the target and actual values, and levels by color. For more information, see Figure 39-3, "Funnel Graph".
39.3.2 Curved Line or Fit To Curve Graph
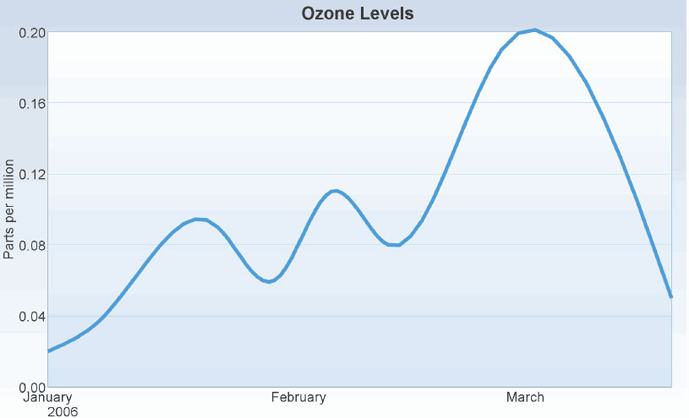
A curved line or fit-to-curve is a graph in which data is represented as a curved line, as a series of data points, or as data points that are connected by a line. Curved line graphs require data for at least two points for each member in a group. For more information, see Figure 39-4, "Curved LIne Graph".
39.3.3 Enhanced Pie
A pie graph represents data as sections of one or more circles, making the circles look like sliced pies. With the enhanced pie, you can include any combination of data value, percent, and text label.

