3.5 Part 5: Building Reports for Business Cases
This part of the manual explains how you can build various kinds of reports to suit your business requirements.
3.5.1 Building a time series calculations report
In this example, you will build a report that calculates and displays the four-month average of purchases for each customer. You will use the Report Wizard to create a simple time series calculations report for both paper and the Web. For the JSP-based Web report, you will modify the Web source to change labels and add format masks.
Figure 3-26 Final output of the time series calculations report example
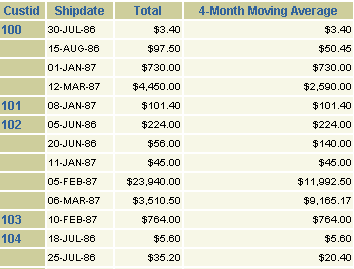
Description of "Figure 3-26 Final output of the time series calculations report example"
For more information on building this example, refer to Chapter 28, "Building a Time Series Calculations Report".
3.5.2 Deploying a paper report to Microsoft Excel output
In this example, you will deploy a report with the Reports Server under Oracle WebLogic Server to display it in Microsoft Excel inside your Web browser, when you have an existing paper layout. You will generate a report to Microsoft Excel output after integrating the paper layout into a Web layout by modifying the Web source of your report.
Figure 3-27 Final output of the Microsoft Excel report
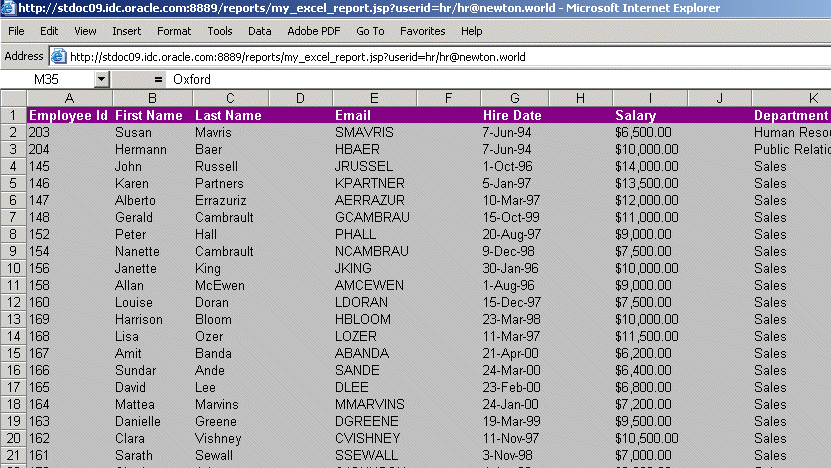
Description of "Figure 3-27 Final output of the Microsoft Excel report"
For more information on building this example, refer to Chapter 29, "Building a Report for Enhanced Spreadsheet Output".
3.5.3 Building a report with aggregate data
In this example, you will build a report that collects and displays names of all employees whose salaries fall within the range of 0 to 999, then collects and displays all employees whose salaries fall within the range of 1000 to 1999, and so on. You will be able to modify this report to display any aggregate range you need.
Figure 3-28 Final output of the aggregate data report example
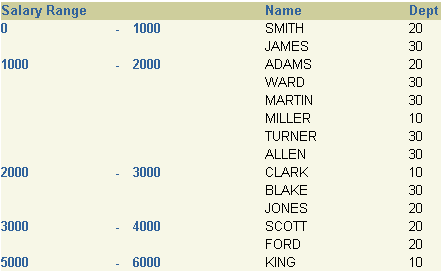
Description of "Figure 3-28 Final output of the aggregate data report example"
For more information on building this example, refer to Chapter 30, "Building a Report with Aggregate Data".
3.5.4 Building a check printing report with spelled-out cash amounts
In this example, you will build a check printing report with a stub and spelled-out cash amounts. The steps described in this example will help you create a PL/SQL function that returns spelled-out numerical values. You will also learn how to import an image of a preprinted form (in this case, a blank check image) and use the tools in the Paper Layout and Paper Design views to print your report on such a form. Although we use a check as the example in this report, you can use the steps to use any preprinted form with Oracle Reports.
Figure 3-29 Final output of the check printing report with spelled-out cash amounts
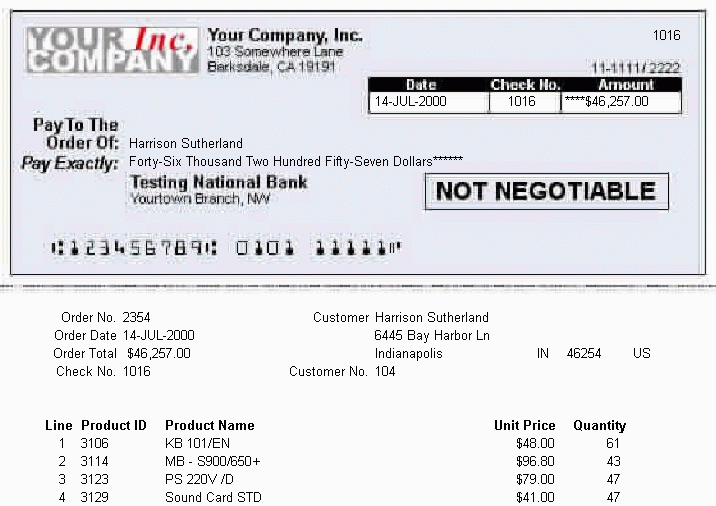
Description of "Figure 3-29 Final output of the check printing report with spelled-out cash amounts"
For more information on building this example, refer to Chapter 31, "Building a Check Printing Report with Spelled-Out Cash Amounts".
3.5.5 Building a report using a preprinted form
In this chapter, you will learn formatting techniques for printing reports on preprinted forms when you do not have access to a computer readable version of the forms. Such reports must be designed so that the data prints in exact positions on the form.
Figure 3-30 Final output of the preprinted forms example
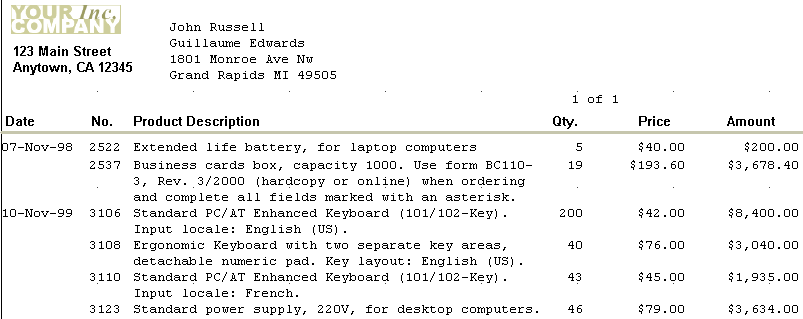
Description of "Figure 3-30 Final output of the preprinted forms example"
For more information on building this example, refer to Chapter 32, "Building a Report Using a Preprinted Form".
3.5.6 Building an invoice report
In this example, you will build a report that displays several distinguishing characteristics of a typical invoice, such as customer name and address, sales order number, billing information, and billing totals.
Figure 3-31 Final output of the invoice report example
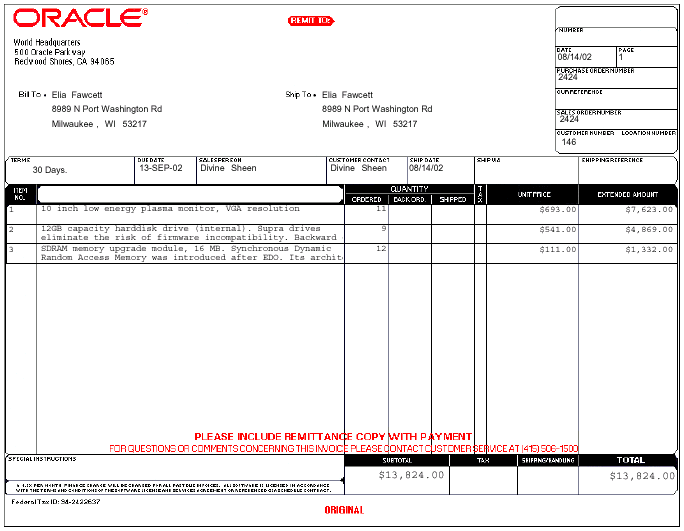
Description of "Figure 3-31 Final output of the invoice report example"
For more information on building this example, refer to Chapter 33, "Building an Invoice Report".
3.5.7 Building a ranking report
In this example, you will build a report that ranks data in two different ways: by count and by percentage. The upper portion displays the names and the total purchases of the top three customers; the lower portion displays the names and total purchases of those customers who constitute 75% of all sales. You can set the ranking criteria at runtime, or let them default to previously specified values.
Figure 3-32 Final output of the ranking report example
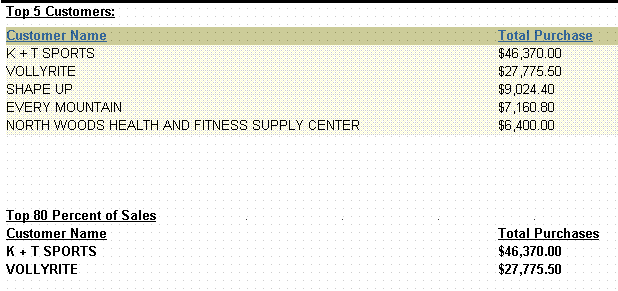
Description of "Figure 3-32 Final output of the ranking report example"
For more information on building this example, refer to Chapter 34, "Building a Ranking Report".
3.5.8 Building a report with a simple table of contents and index
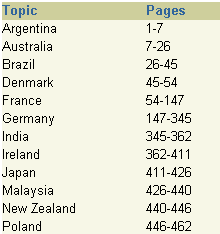
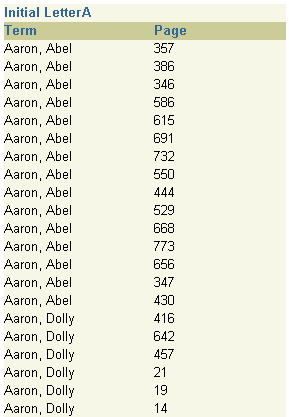
This example is designed to teach you how to add navigational items to a large paper report. You will learn how to create a group above report, then add a simple table of contents to the beginning of your report, which will enable users to find an item by its category. You will also learn how to create an index so users can directly find a specific piece of information.
Note:
Generating a table of contents or index is not supported for matrix reports.
For more details on building this example, refer to Chapter 35, "Building a Paper Report with a Simple Table of Contents and Index".
3.5.9 Building a report with a multilevel table of contents
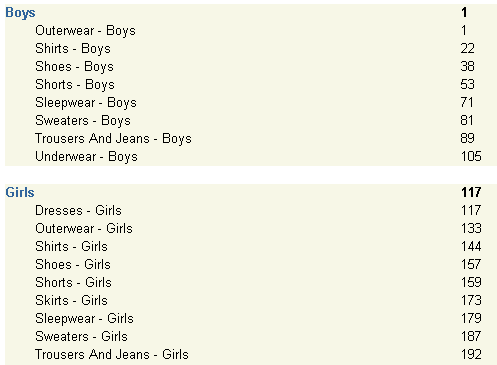
This example is designed to teach you how to add a multilevel table of contents to a large paper report. You will add a table of contents based on a category and sub-category to an existing paper report.
Note:
Generating a table of contents is not supported for matrix reports.
For more details on building this example, refer to Chapter 36, "Building a Paper Report with a Multilevel Table of Contents".
3.5.10 Bursting and distributing a report
In this example, you will modify a simple report we have provided to burst each section to a separate report. You will then modify a sample distribution XML file to send an e-mail to each destination with an attachment based on the separate reports. You will also send multiple e-mails to the same e-mail address with a single attachment (the entire report).
For more information on building this example, refer to Chapter 37, "Bursting and Distributing a Report".
Note:
No sample output is available for this report.
3.5.11 Building a report with multibyte characters for PDF output
In this example, you will learn how to create a report in PDF format that contains multibyte characters for the Web and paper output. You will build a multibyte character set report using UTF8. You can produce reports that display text in multibyte character sets, such as Simplified Chinese, Traditional Chinese, Japanese, Korean, and Unicode.
Figure 3-36 Multibyte character set UTF8 report in Japanese
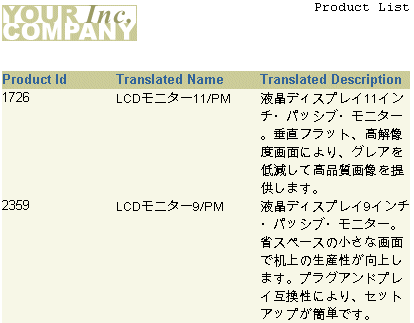
Description of "Figure 3-36 Multibyte character set UTF8 report in Japanese"
For more details on building this example, refer to Chapter 38, "Building a Report with Multibyte Characters for PDF Output".
