15.3 Create Three Summary Columns
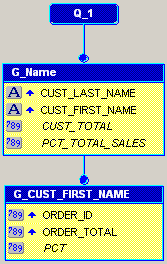
The steps in this section show you how to use the Summary Column tool in the Data Model view to create three summary columns. These columns will calculate the percentage of each order total that the customer has purchased, the total purchases the customer has made, and the percentage of the total sales of all customers.
To create the summary columns:
-
In the Data Model view, click the Summary Column tool in the tool palette, then click in the G_CUST_FIRST_NAME group to create a summary column.
-
Double-click the new summary column object (CS_1) to display the Property Inspector, and set the following properties:
-
Under General Information, set the Name property to PCT.
-
Under Summary, set the Function property to % of Total, set the Source property to ORDER_TOTAL, set the Reset At property to G_CUST_FIRST_NAME, and set the Compute At property to Report.
-
-
Create a second summary column in group G_NAME with the following properties:
-
Under General Information, set the Name property to CUST_TOTAL.
-
Under Summary, set the Function property to Sum, set the Source property to ORDER_TOTAL, and set the Reset At property to G_NAME.
-
-
Create a third summary column in group G_NAME with the following properties:
-
Under General Information, set the Name property to PCT_TOTAL_SALES.
-
Under Summary, set the Function property to Sum, set the Source property to PCT, and set the Reset At property to G_NAME.
Your data model should now look something like this:
Figure 15-5 Data Model with Three Summary Columns

Description of "Figure 15-5 Data Model with Three Summary Columns"
-
-
Save your report as
wrappedbreak_your_initials.rdf.