7 Reviewing the Source Code for the Graph
Estimated completion time: 5 minutes
In Chapter 6, "Creating a Graph for the Web Report", you added a graph to a JSP-based Web report. This chapter reviews the source code added for the graph.
7.1 Viewing the Source in Reports Builder
Open the Web Source view for the report you created in Chapter 6, "Creating a Graph for the Web Report" called emprevb_your initials.jsp.
7.2 Reviewing the rw:graph Tag
The rw:graph tag brackets the graph information and links the graph to the data source. It also identifies the categories and the data fields.
-
In the Web Source view, locate the
<rw:graph>JSP tag.The code within the
rw:graphtag is XML.<rw:graph id="graph" src="G_EMPLOYEE_ID" series="EMPLOYEE_ID" dataValues="SALARY">
The
seriestag defines the source for the values along the X-axis, and thedataValuestag defines the source for the data along the Y-axis. You defined these parameters in Chapter 6, "Creating a Graph for the Web Report". -
Locate the
SeriesItemstag below therw:graphtag:<SeriesItems> <Series id="0" color="#cc66cc"/> </SeriesItems>
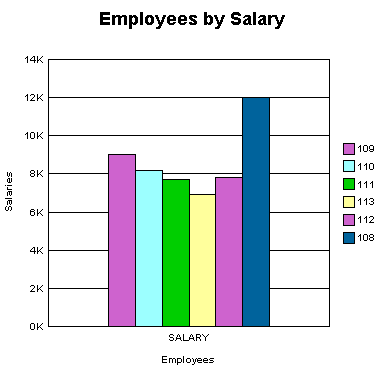
This tag represents the modification to the Row 1 color we made in Chapter 6, "Creating a Graph for the Web Report". If you chose a different color, you will see a different value for the color tag.
-
Here, you can see that the #cc66cc color value is applied to the first bar along the X-axis:
Figure 7-1 Graph with Color on the First Row

Description of "Figure 7-1 Graph with Color on the First Row"
-
Find the
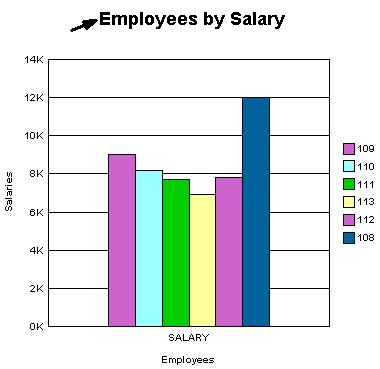
<Title>tag, located here:</SeriesItems> <Title visible="true" text="Employees by Salary"/>
This tag adds the graph title to your Web report, shown here:
-
Find the
</rw:graph>JSP tag, located here:</Graph> --> </rw:graph></p> <p></p> ...
The XML that produces the graph is closed before the
</rw:graph>JSP tag is closed.
Note:
The Graph Wizard is re-entrant. So, if you want to modify your graph, move your cursor into the XML between the rw:graph tags, click Edit >Settings. The Graph Wizard displays with the options you chose in Chapter 6, "Creating a Graph for the Web Report".
