6 User Information Reports
"User Information" reports display statistics pertaining to visitors of a given site. Statistics include:
-
Technical information, such as the browsers that were used and the IP addresses from which content was accessed.
-
Demographic information, such as the visitors' countries of origin and the countries' populations.
The following "User Information" reports can be generated on all sites in all WebCenter Sites installations:
6.1 'Browsers' Report
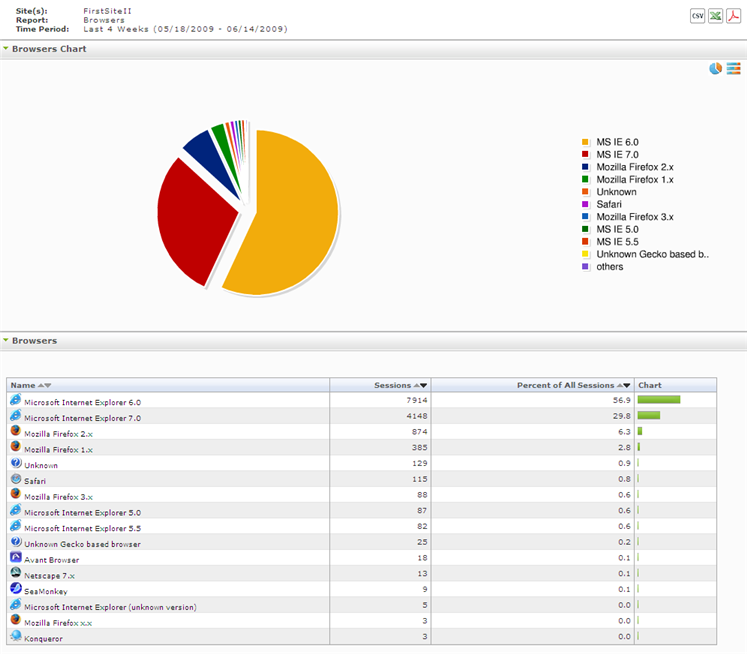
The "Browsers" report identifies the browsers that visitors used to access a given site's page view within the reported time period.
6.1.1 'Browsers Chart'
The "Browsers Chart" shows how often a given browser was used to access the site's page view during the reported time period. Each sector (or bar) represents the percentage of sessions that ran with a given browser on the given site during the reported time period.
6.1.2 'Browsers' List
The "Browsers" list tabulates statistics on the browsers that visitors used to browse the given site during the reported time period. For a description of each statistic, see Table 6-1.
| Column Title | Description |
|---|---|
|
Name |
Browser that visitors used to access the site's page view within the reported time period (displayed in the report header). |
|
Sessions |
Number of sessions in which a given browser was used during the reported time period. |
|
Percent of All Sessions |
Displayed as a sector in the "Browsers" pie chart (bar in the bar chart). Number of times that the site's page view was accessed by a given browser, divided by the total number of page view accesses by all browsers. The result is multiplied by 100 and plotted as a sector in the pie chart (a bar in the bar chart). Note: The chart allocates a sector (bar) to any browser with at least 10% usage. Browsers with usage values below 10% are combined into a sector (bar) labeled "Other." |
|
Chart |
Horizontal bar whose length expresses the value in the "Sessions" column (or the "Percent of all Sessions" column), for the given browser. When two or more line items are displayed, the bars in the "Chart" column define a histogram (Sessions [or Percent of all Sessions] vs. Name of browser). |
6.2 'Countries' Report
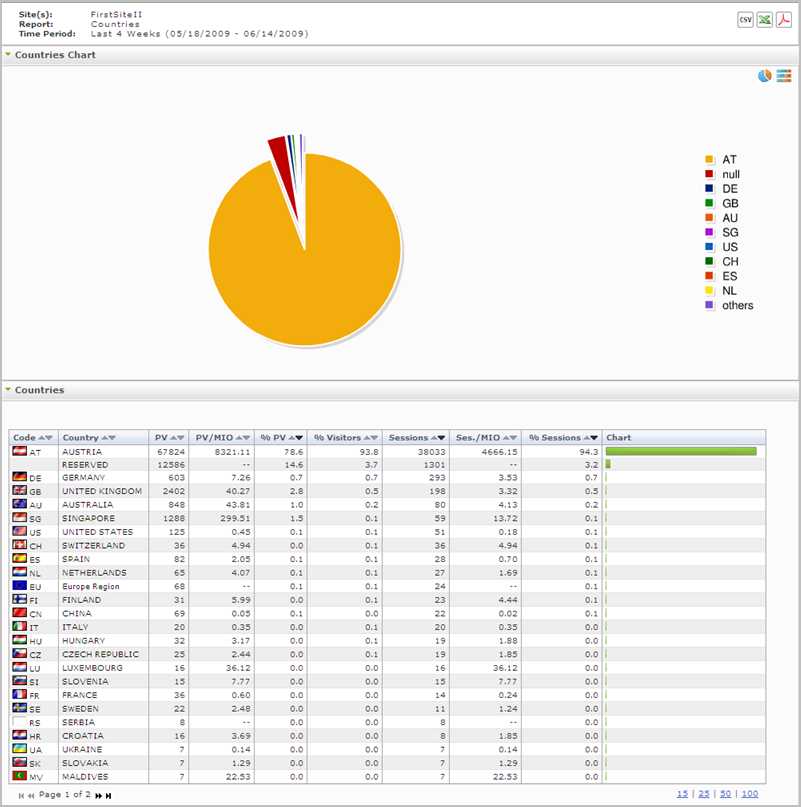
The "Countries" report identifies the countries from which visitors accessed the page view of a given site within the reported time period.
6.2.1 'Countries Chart'
The "Countries Chart" shows how frequently visitors in a given country accessed the site's page view during the reported time period. Each sector (or bar) of the chart represents the percentage of sessions that originated in a given country and ran on the given site during the reported time period.
6.2.2 'Countries' List
The "Countries" list tabulates statistics on the countries from which visitors browsed the given site during the reported time period. For a description of each statistic, see Table 6-2.
| Column | Description |
|---|---|
|
Code |
Country code and flag-icon of the visiting country determined from visitors' IP addresses. |
|
Country |
Name of the visiting country, determined from visitors' IP addresses. Any IP address that does not return country information is listed at the bottom of the report as "RESERVED." |
|
PV |
Number of page views that originated from the given country. |
|
PV/MIO |
Number of page views per one million of the country's population during the reported time period: "PV" is the statistic described in the preceding row, and "MIO" is the population of the country in millions of inhabitants. |
|
% PV |
Percentage of total page views recorded for the site that originated from the given country. |
|
% Visitors |
Percentage of the total number of visitors recorded for the site that originated from the given country. |
|
Sessions |
Number of browser sessions that originated in the given country during the reported time period, on the given site. |
|
Sessions/MIO |
Number of browser sessions per one million of the country's population during the reported time period: "Sessions" is the statistic described in the preceding row, and "MIO" is the population of the country in millions of inhabitants. |
|
% Sessions |
Displayed as a sector in the "Countries" pie chart (bar in the "Countries" bar chart). Percentage of browser sessions that originated in the given country during the reported time period, on the given site. |
|
Chart |
Horizontal bar whose length expresses the value in the "Sessions" column (or "% Sessions" column), for the given country. When two or more line items are displayed, the bars in the "Chart" column define a histogram (Sessions [or % Sessions] vs. Country). |
6.3 'Entry/Exit Pages' Report
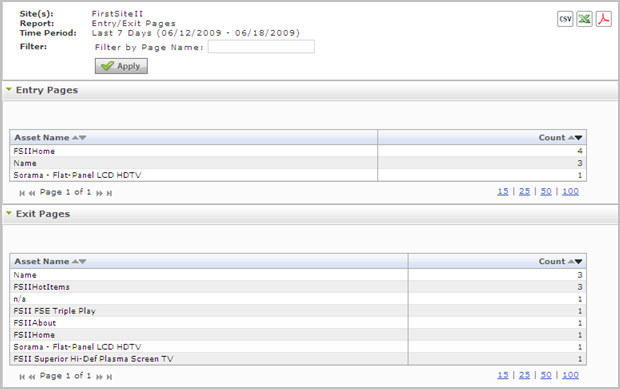
The "Entry/Exit Pages" report identifies the beginning and ending pages of the sessions that ran on the given site within the reported time period.
Note:
The "Entry/Exit Pages" report provides you with a filter which enables you to filter the report results by page name.
6.3.1 'Entry Pages' List
The "Entry Pages" list tabulates statistics on the beginning pages of the sessions on the given site during the reported time period. For a description of each statistic, see Table 6-3.
| Column Title | Description |
|---|---|
|
Asset Name |
Name of the page that was accessed as the session's beginning page during the reported time period (displayed in the report header). |
|
Count |
Number of times that the page was accessed as the session's beginning page during the reported time period. |
6.3.2 'Exit Pages' List
The "Exit Pages" list tabulates statistics on the final pages of the sessions that ran on the given site during the reported time period. For a description of each statistic, see Table 6-4.
| Column Title | Description |
|---|---|
|
Asset Name |
Name of the page that was accessed as the session's ending page during the reported time period (displayed in the report header). |
|
Count |
Number of times that the page was accessed as the session's ending page during the reported time period. |
6.4 'External Search Engines' Report
The "External Search Engines" report lists search phrases that led visitors to the given site. This report also identifies the search engine that was used. All the search phrases were entered into sites that are external to WebCenter Sites.
Note:
The "External Search Engines" report provides you with a filter which enables you to filter the report results based on keyword and/or the search engine used.
Figure 6-4 "External Search Engines" Report
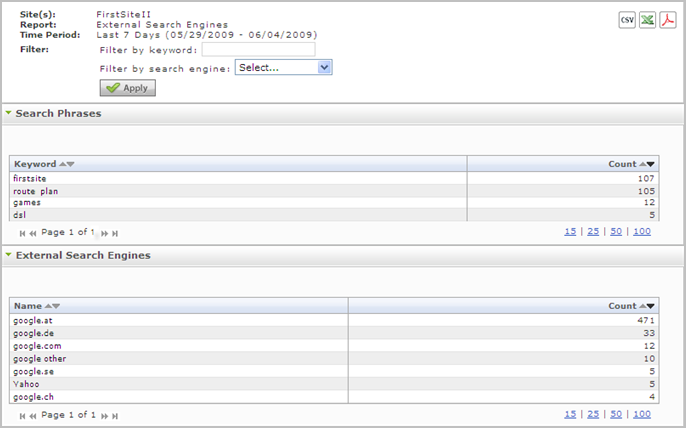
Description of "Figure 6-4 "External Search Engines" Report"
6.4.1 'Search Phrases' List
The "Search Phrases" list tabulates statistics on the searches that visitors performed on an external site, using external search engines. For a description of each statistic, see Table 6-5.
6.4.2 'External Search Engines' List
The "External Search Engines" list tabulates statistics on the external search engines that visitors used while browsing the given site during the reported time period. For a description of each statistic, see Table 6-6.
Table 6-6 "External Search Engines" List
| Column Title | Description |
|---|---|
|
Name |
URL of the search engine that executed the search phrase. |
|
Count |
Number of times in the reported time period that the search engine was invoked to search on the keyword in the "Search Phrases" list (Table 6-5). |
6.5 'Hosts' Report
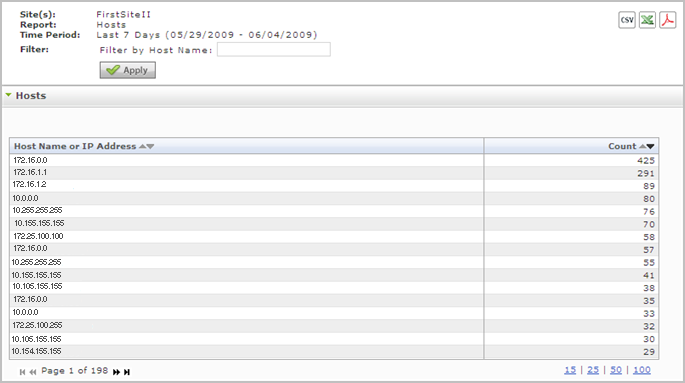
The "Hosts" report identifies the hosts from which visitors accessed the site's page view within the reported time period. For a description of each statistic, see Table 6-12.
Note:
The "Hosts" report provides users with a filter which enables you to filter report results by host name.
6.5.1 'Hosts' List
The "Hosts" list provides information and statistics on the host or IP Address of the machine a visitor used to access the given site during the reported time period. For a description of each statistic, see Table 6-12.
| Column Title | Description |
|---|---|
|
Host Name or IP Address |
Host name or IP address of the machine from which visitors accessed the site's page view within the reported time period. Any IP address that does not return country information is listed at the bottom of the report as "Reserved." |
|
Count |
Number of times that the site's page view was accessed from the given host within the reported time period (displayed in the report header). |
6.6 'IP Addresses' Report
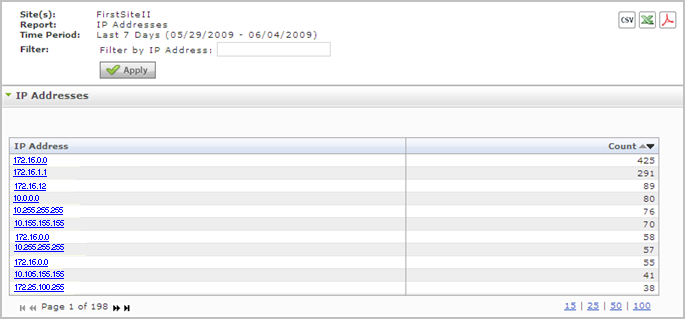
The "IP Addresses" report lists the IP addresses from which visitors accessed the site's page view within the reported time period.
Note:
The "IP Addresses" report provides users with a filter which enables the user to filter the report results based on IP address.
6.6.1 'IP Addresses' List
The "IP Addresses" list provides information and statistics about which IP addresses were used by visitors to access the site's page view during a reported time period. For a description of each statistic, see Table 6-8.
| Column Title | Description |
|---|---|
|
IP Address |
IP address from which visitors accessed the site's page view during the reported time period. Clicking the IP address displays detailed information about the IP address, including the country of origin. An IP address that does not return country information is listed at the bottom of the list as "Reserved." |
|
Count |
Number of times that the site's page view was accessed from the given IP address during the reported time period (displayed in the report header). |
6.7 'Operating Systems' Report
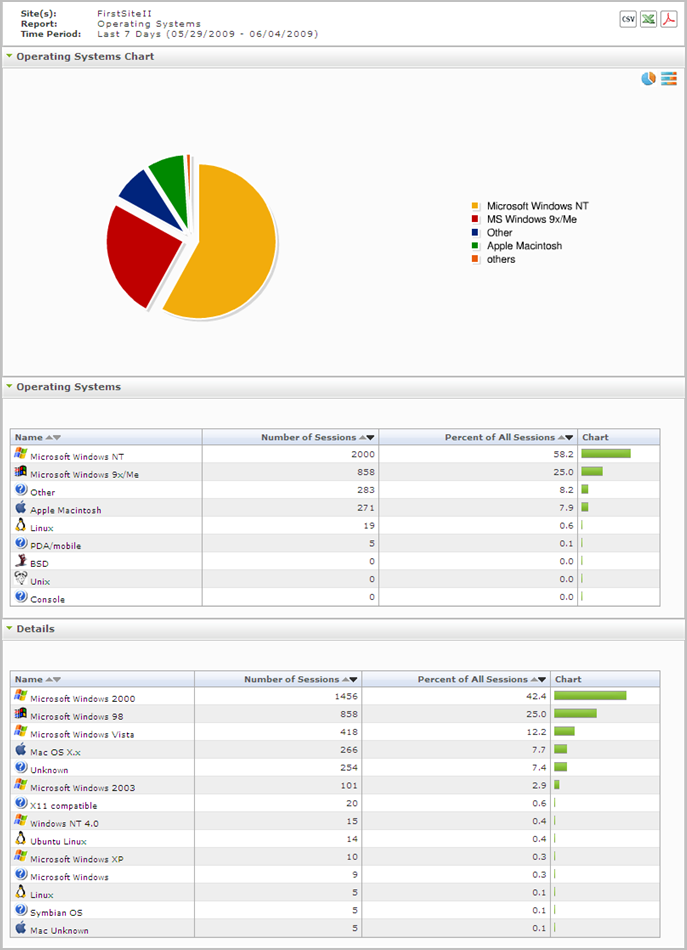
The "Operating Systems" report identifies the operating systems from which visitors accessed the page view of a given site during the reported time period.
6.7.1 'Operating Systems Chart'
The "Operating Systems Chart" shows how often a given operating system was used to access the site's page view. Each sector (or bar) represents the percentage of sessions that ran with the given operating system on the given site during the reported time period.
6.7.2 'Operating Systems' List
The "Operating Systems" list tabulates statistics on the operating systems that were used to browse the given site during the reported time period. For a description of each statistic, see Table 6-9.
Table 6-9 "Operating Systems" List
| Column Title | Description |
|---|---|
|
Name |
Operating system that visitors used to access the site's page view within the reported time period. |
|
Number of Sessions |
Number of sessions in which the given operating system was used during the reported time period. |
|
Percent of All Sessions |
Displayed as sectors in the "Operating Systems" chart. Number of times that the site's page view was accessed by a given operating system, divided by the total number of accesses by all operating systems. The result is multiplied by 100 and plotted as a sector in the pie chart. Note: The pie chart allocates a sector to any operating system with at least 1% usage. Operating systems with usage values below 1% are combined into a sector labeled "Other." |
|
Chart |
Horizontal bar whose length expresses the value in the "Number of Sessions" column (or the value in the "Percent of Sessions" column), for the given operating system. When two or more line items are displayed, the bars in the "Chart" column define a histogram (Number of Sessions [or Percent of Sessions] vs. Name of the Operating System). |
6.8 'Referrers' Report
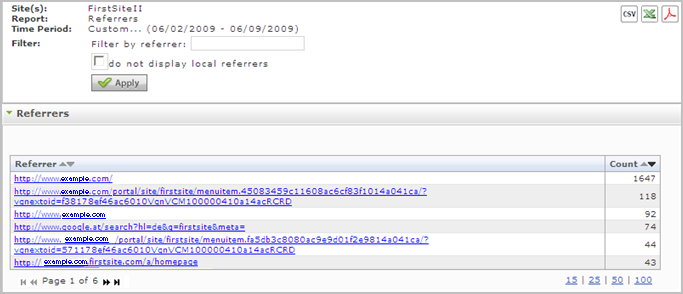
The "Referrers" report lists referring URLs—external sites from which visitors followed links to the given site within the reported time period.
Note:
The "Referrers" report provides users with a filter. When the user selects the checkbox "do not display local referrers", all local referrers are filtered out of the report results, leaving only external referrers listed. You can also filter report results by a specific referrer.
6.8.1 'Referrers' List
The "Referrers" list provides information and statistics about the URL that was used to lead the visitor to the given site during the reported time period.
6.9 'Screen Resolution' Report
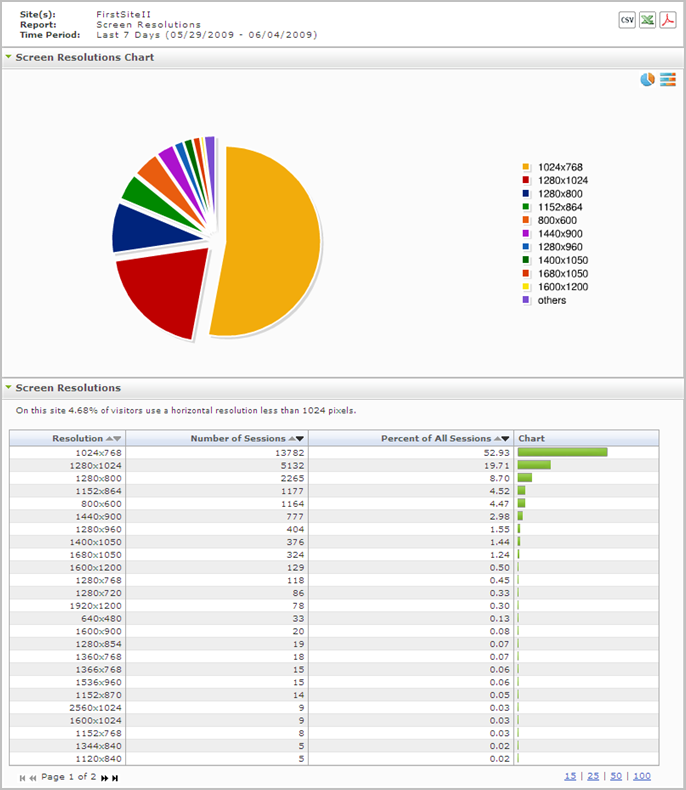
The "Screen Resolution" report provides information about the screen resolutions used by visitors to access the site during the reported time period.
6.9.1 'Screen Resolutions Chart'
The "Screen Resolutions Chart" shows how often a given screen resolution was used to access content on the site in a given time period. Each sector (or bar) represents the percentage of client browsers that used a horizontal resolution of less than 1024 pixels to access content on the given site during the reported time period.
6.9.2 'Screen Resolutions' List
The "Screen Resolution" list tabulates statistics about which screen resolution visitors used while accessing the given site during the reported time period. For a description of each statistics, see Table 6-11.
Table 6-11 "Screen Resolution' List
| Column | Description |
|---|---|
|
Resolution |
Horizontal density of pixels across the browser's screen. |
|
Number of Sessions |
Number of sessions during which the given resolution was used, in the reported time period. |
|
Percent of All Sessions |
Percentage of sessions during which the given resolution was used. |
|
Chart |
Horizontal bar whose length expresses the value in the "Number of Sessions" column (or the value in the "Percent of all Sessions" column), for the given resolution. When two or more line items are displayed, the bars in the "Chart" column define a histogram (Number of Sessions [or Percent of all Sessions] vs. Resolution). |
6.10 'Sessions' Report
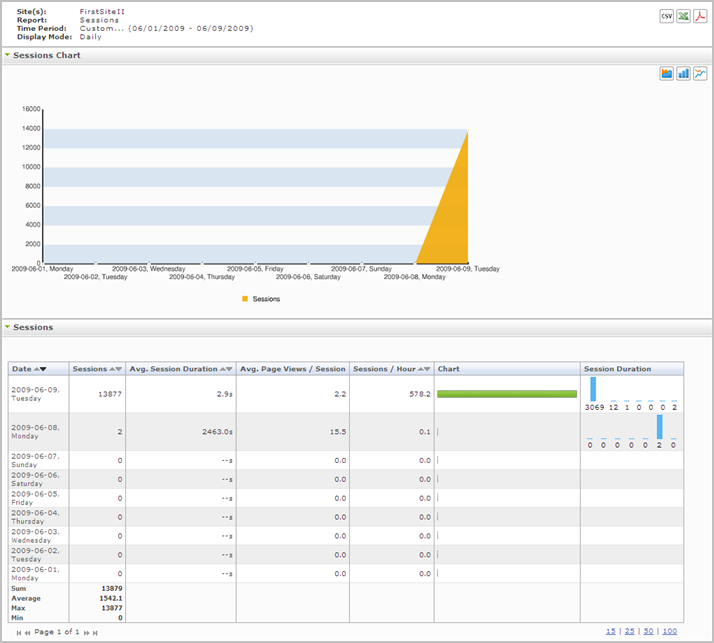
The "Sessions" report lists the frequency and duration of the browser sessions that ran on a given site within the reported time period.
6.10.1 'Sessions Chart'
The "Sessions Chart" plots the frequency of browser sessions versus the date (or time interval) when the frequency was observed.
6.10.2 'Sessions' List
The "Sessions" list tabulates statistics on the browser sessions that ran on the given site during the reported time period. For a description of each statistic, see Table 6-12.
| Mode | Column Title and Description |
|---|---|
|
Daily, Weekly, Monthly |
Date column: The x-axis of the "Sessions" chart. Displays the day (week or month) in which data was captured and for which statistics are being reported.
Sessions column: The y-axis of the "Sessions" chart. Number of browser sessions that ran on the given date. Avg. Session Duration column: Average session length (in seconds) on the given date. Avg. Page Views / Session column: Average number of page views per session on the given date. Sessions / Hour column: Average number of sessions per hour on the given date. Chart column: Horizontal bar whose length expresses the value in the "Sessions" column, for the given date. When two or more line items are displayed, the bars in the "Chart" column define a histogram (Sessions vs. Date). Session Duration column: Vertical bar chart showing the distribution of session duration on the given date. From left to right, the quantiles (in seconds) are as follows: 0–30 | 31–120 | 121–300 | 301–900 | 901–1800 | 1801–3600 | 3601–43200 Results are interpreted as shown in the following example: A value of "15" in the | 31–120 | quantile means that 15 sessions on the given date lasted from 31 seconds up to and including 120 seconds. |
|
Sum by Weekdays |
Date column: The x-axis of the "Sessions" chart. Displays the day of the week in which data was captured and for which statistics are being reported. In sum by weekdays mode, the date identifies a day of the week, defined as 24 hours, beginning at 12:00 a.m. on the given weekday. Sessions column: The y-axis of the "Sessions" chart. Displays the number of browser sessions that ran on the given weekday. Avg. Session Duration column: Average session length (in seconds) on the given weekday. Avg. Page Views / Sessions column: Average number of page views per session on the given weekday. Sessions / Hour column: Average number of sessions per hour on the given weekday. Chart column: Horizontal bar whose length expresses the value in the "Sessions" column, for the given weekday. When two or more line items are displayed, the bars in the "Chart" column define a histogram (Sessions vs. Date). Session Duration column: Vertical bar chart showing the distribution of session duration on the given weekday. From left to right, the quantiles (in seconds) are as follows: 0–30 | 31–120 | 121–300 | 301–900 | 901–1800 | 1801–3600 | 3601–43200 Results are interpreted as shown in the following example: A value of "15" in the | 31–120 | quantile means that 15 sessions on the given weekday lasted from 31 seconds up to and including 120 seconds. |
6.11 'Visitors' Report
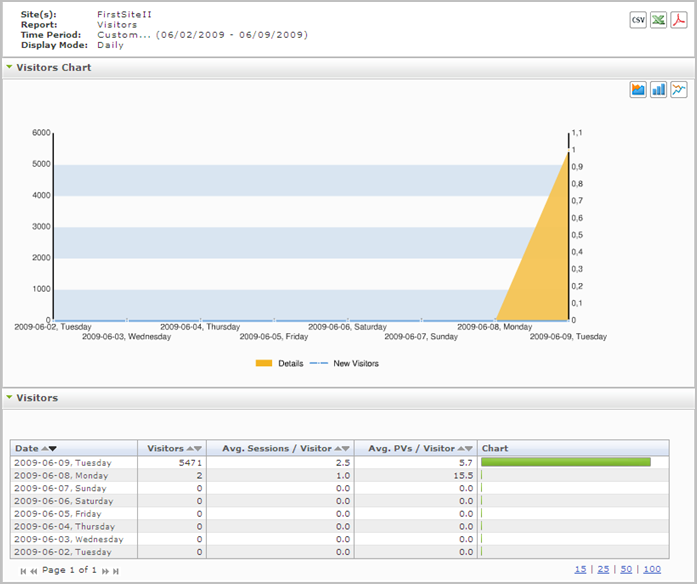
The "Visitors" report shows how many visitors accessed a site's page view during the days (weeks or months) in the reported time period.
6.11.1 'Visitors Chart'
The "Visitors Chart" plots the number of visitors who accessed the site's page view versus the date (or time interval) when the number was observed.
6.11.2 'Visitors' List
The "Visitors' list tabulates statistics on the visitors who browsed the given site during the reported time period. For a description of each statistic, see Table 6-13.
| Mode | Column Title and Description |
|---|---|
|
Daily, Weekly, Monthly |
Date column: The x-axis of the "Visitors" chart. Displays the date for which session information is being reported.
Visitors column: The y-axis of the "Visitors" chart. Displays the number of unique visitors who accessed the site's page view during the reported time period. Avg. Sessions / Visitor column: Average number of sessions per visitor. Avg. PVs / Visitor column: Average number of page views per visitor. Chart column: Horizontal bar whose length expresses the value in the "Visitors" column, for the given date. When two or more line items are displayed, the bars in the "Chart" column define a histogram (Visitors vs. Date). |
