5 Exercise 4: Creating and Preparing a Report for Viewing
Your goal in this exercise is to learn how to configure a complete, usable Analytics report. To accomplish that, you will configure a custom report called "NewBrowsers" that will display the browsers that visitors used to gain access to the given site's page view within the reported time period.
Note:
The "NewBrowser" report you will be creating in this tutorial, is a duplicate of the default "Browsers" report in your Analytics installation. For the purposes of this tutorial, the xml file and report name of the "Browsers" report you will be configuring, along with the bean and mapper class names, have been renamed to avoid overwriting the default "Browsers" report.
The report will display data that has already been captured on the FirstSite II sample site and stored in the Analytics database.
When building the report, you will first create a simple report with a test module that displays a "Hello World" greeting. You will remove this test module when you begin adding features to your report.
Note:
Throughout this exercise, we assume that you are working exclusively with the FirstSite II sample site. Select this site whenever prompted in the Analytics or WebCenter Sites interfaces.
This exercise consists of the following sections:
5.1 Report Design
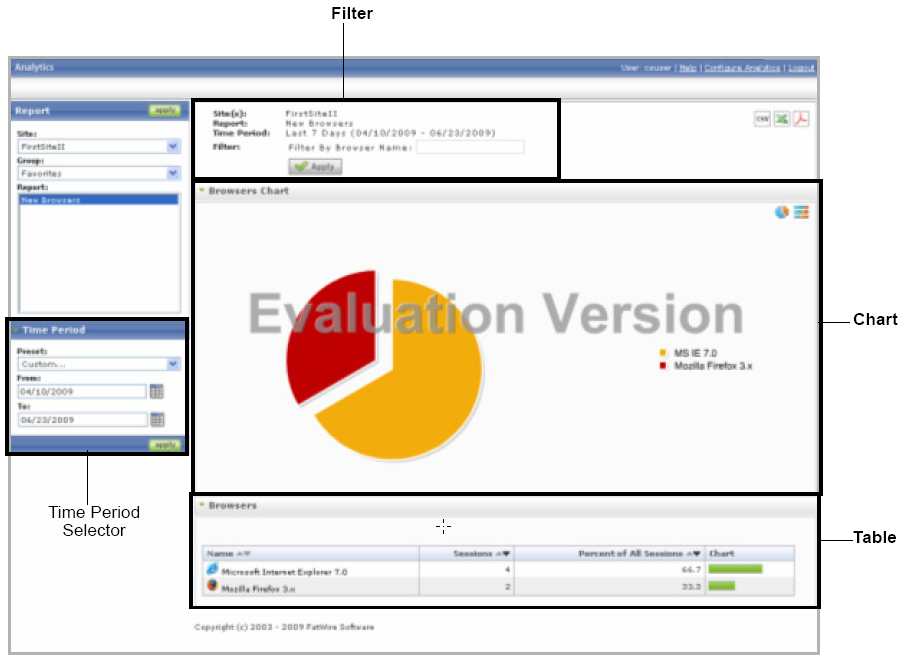
An Analytics report is composed of modules. A module is a piece of code that implements a specific feature in the report, such as a table, a chart, or a filter. For example, the "NewBrowsers" report you will build in this exercise contains the following features: filter, chart, table, and time period selector, shown in Figure 5-1.
Each of these features, except for the time period selector, is implemented as a separate and, in most cases, self-contained module. (Some features, such as filters, require you to modify the code of other modules in order to function.) Let's look at the structure of the table module. It has a module declaration, a data retrieval section, and a display section:

Description of the illustration tablemodule.png
Modules that query the database to display data contain the <sql> and <display> tags, as shown in the sample code above. Modules that do not display data, such as filter modules, contain the following structure:
<filter name="filter-browsername" required="false" type="text" captions="name" key="filter-browsername" />
The chart module has the same structure as described above.
Tables, charts, and other features of your report contain areas (such as headings, field names and column heads) that must be filled in by having their values defined in a property file accessible within your application server's classpath. For example, the following statement defines the heading for the "Browser Name" column in your table:
report_newbrowser_module_browser_column_broname=Name
Note:
For your reference, the code for the "NewBrowsers" report, annotated module by module, is shown in Section 5.1.1, "'NewBrowsers' Report Code."
Now that you know how reports are built, let's go ahead and create the "NewBrowsers" report. Continue to Section 5.2, "Creating and Preparing the 'NewBrowsers' Report for Viewing."
5.1.1 'NewBrowsers' Report Code
Below is the code that powers the "NewBrowsers" report. The code is annotated for your reference.
<?xml version="1.0" encoding="UTF-8"?>
<!--  <!DOCTYPE report SYSTEM "report.dtd">  -->

<report type="std" visible="true" name="newbrowser" >

<!-- Global parameters (such as sitenames), are defined here-->

<globalparam name="sitenames" />

<!-- After declaring global parameters, start declaring several request parameters like rgrpid, timepreset, sdate, edate etc. sdate, edate enable the time range selector in the report-->
<param type="request" name="rgrpid" key="rgrpid" required="false" />
<param type="request" name="timepreset" key="timepreset" required="false">
    <restriction type="listvalue">
       <restrictionvalue value="yesterday" />
               <restrictionvalue value="lastweek" />
               <restrictionvalue value="lastmonth" />
               <restrictionvalue value="last7days" />
               <restrictionvalue value="last4weeks" />
               <restrictionvalue value="last12months" />
       </restriction>
</param>
<param type="request" name="siteid" key="siteid" required="true" />
<param type="request" name="sdate" key="sdate" required="true">
    <restriction type="isDate" value="dd.MM.yyyy" />
</param>
<param type="request" name="edate" key="edate" required="true">
    <restriction type="isDate" value="dd.MM.yyyy" />
</param>

<!—a filter is getting configured here, that will filter the report data by browser name. -->
<filter name="filter-browsername"
        required="false"
        type="text"
        captions="name"
        key="filter-browsername"
/>

<!—the following parameter will generate the sum of all sessions that have come from different browsers-->
<param type="sql" name="browsertotal" >
    <query>
       select
          nvl(sum(count), 0) as count
       from
          help_dates dates
          join l3_datexsitexnewbrowserxcount l3 on (dates.id = l3.dateid)
       where<![CDATA[
          siteid = #siteid# and
          dates.dat >= to_date('#sdate#', 'DD-MM-YYYY') and
          dates.dat  < to_date('#edate#', 'DD-MM-YYYY')+1 ]]>
    </query>
</param>
<!-- The chart module defines your pie chart. -->
<module type="stdchart" name="chartbrowser">
    <param type="request" name="charttype" key="chartbrowser_charttype"
       default="pie_labeled">
       <restriction type="listvalue">
             <restrictionvalue value="pie_labeled" />
             <restrictionvalue value="bar_labeled" />
       </restriction>
    </param>

    <param type="string" name="chart_max_display" value="10"/>
    <param type="string" name="chart_display_rest" value="true"/>
    <sql>
    <query>
       select
           bro.id as broid,
           bro.name as broname,
           nvl(count, 0) as count,
           <equals name="browsertotal" value="0">
              0 as percent
           </equals>
           <notEquals name="browsertotal" value="0">
              (nvl(count, 0)/#browsertotal#)*100 as percent
           </notEquals>
       from
           l2_browser bro
           join (
           select
              bro2.id as broid,
              bro2.name as broname,
              sum(count) as count
           from
              help_dates dates
              join l3_datexsitexnewbrowserxcount l3 on
                      (dates.id = l3.dateid)
                      join l2_browser bro2 on (l3.browserid = bro2.id
           where<![CDATA[
              siteid = #siteid# and
              dates.dat >= to_date('#sdate#', 'DD-MM-YYYY') and
              dates.dat  < to_date('#edate#', 'DD-MM-YYYY')+1 ]]>
           group by
              bro2.id, bro2.name

           ) on (bro.id = broid)
           <dynamicOrderBy default="count-desc" />
    </query>
    </sql>
    <display type="html">
       <value name="xaxis" type="string">
           <valueparam name="format" parse="false"/>
           <valueparam name="value" value="#broname#" />
       </value>

       <value name="yaxis" type="number">
              <valueparam name="format" parse="false" value="#####0" />
              <valueparam name="value" value="#count#" />
       </value>
    </display>

    </module>
<!-- This module defines the table that will show statistics for each browser to the target page.-->
<module type="stdtable" name="browser" >
    <sql>
       <query>
           select
              bro.id as broid,
              bro.name as broname,
              bro.iconpath as broiconpath,
              nvl(count, 0) as count,
              <equals name="browsertotal" value="0">
                 0 as percent
              </equals>
              <notEquals name="browsertotal" value="0">
                 (nvl(count, 0)/#browsertotal#)*100 as percent
              </notEquals>
           from
              l2_browser bro
              join (
              select
                 bro2.id as broid,
                 bro2.name as broname,
                 sum(count) as count
             from
                 help_dates dates
                 join l3_datexsitexnewbrowserxcount l3 on (dates.id = l3.dateid)
                 join l2_browser bro2 on (l3.browserid = bro2.id)
              where<![CDATA[
<!-- The CDATA statement allows the time period selector to limit the data displayed in the table to a specific time period. -->
                 siteid = #siteid# and
                 dates.dat >= to_date('#sdate#', 'DD-MM-YYYY') and
                 dates.dat < to_date('#edate#', 'DD-MM-YYYY')+1 ]]>

<!-- The <notNull> tag ensures that its contents are added to the main query only if they are not null. -->

                 <notNull name="filter-browsername">
                   and lower(bro2.name) like lower(replace('#filter-
                   browsername#','*','%'))
                 </notNull>
           group by
              bro2.id, bro2.name

           ) on (bro.id = broid)
           <dynamicOrderBy default="count-desc" />
       </query>
       <count type="simple" />
    </sql>

    <display type="html">
    <!-- Table columns are defined here.
    Each <column> statement defines one column.-->

    <column name="broname" columntype="text" sortrscolumn="broname">
           <value type="image">
              <valueparam name="src" value="#imgpath#/browser/#broiconpath#" />
              <valueparam name="alt" value="#broname#" />
              <valueparam name="text" value="#broname#" />
              <valueparam name="width" value="16" />
              <valueparam name="height" value="16" />
           </value>
           <value type="string">
              <valueparam name="value" value=" #broname#" />
           </value>
           </column>
           <column name="count" columntype="number" sortrscolumn="count">
              <value type="number">
                 <valueparam name="format" parse="false" value="#####0" />
                 <valueparam name="value" value="#count#" />
              </value>
           </column>
           <column name="percent" columntype="number" sortrscolumn="count">
              <value type="number">
                 <valueparam name="format" parse="false" value="#####0.0" />
                 <valueparam name="value" value="#percent#" />
              </value>
           </column>
           <column name="chart" columntype="string">
              <value type="chart">
                 <valueparam name="format" parse="false" value="#####0" />
                 <valueparam name="value" value="#percent#" />
                 <valueparam name="maxvalue" value="100" />
                 <valueparam name="width" value="100" />
                 <valueparam name="image" value="#imgpathstyle_branding#graph_
                  blue.gif" />
              </value>
           </column>
    </display>
</module>
</report>
5.2 Creating and Preparing the 'NewBrowsers' Report for Viewing
You will now create the "NewBrowsers" report (shown in Section 5.1, "Report Design").
Note:
In this exercise, you will add features to your report in the order shown below. Once you are familiar with report code, you can build your report in the order that's most convenient for you. Be aware, however, that certain features, such as filters, require you to modify the code in other modules.
-
Section 5.2.1, "Creating and Registering the Report File." The first task is to create the XML file that will hold the report code and register it with Analytics.
-
Section 5.2.2, "Adding a Table." The table displays a set of statistics for each browser (Browser Name; Sessions; Percent of all sessions; and the chart that shows the percent graphically).
-
Section 5.2.3, "Adding a Time Period Selector." This selector allows you to limit the data displayed in the report to a specific time period. (This feature does not require a module.)
-
Section 5.3, "Adding a Filter." Using filters, you can restrict the data displayed in the report to specific browsers and session counts.
-
Section 5.3.3, "Adding a Chart." The "NewBrowsers" chart shows how often a given browser was used to access the site's page view during the reported time period.
-
Section 5.3.4, "Testing the Completed 'NewBrowsers' Report." Test your report to make sure it looks and behaves as intended.
5.2.1 Creating and Registering the Report File
Your first task is to create the foundation for the report – the XML file that will hold the report code. In this section you will create a report file containing the "Hello World" test module that will display only text, and you will register the report with Analytics.
The steps for creating and registering a report file are:
Section 5.2.1.1, "Step 1: Create the XML File"
Section 5.2.1.2, "Step 2: Place the XML File in the Analytics Reports Directory"
Section 5.2.1.3, "Step 3: Label the Report Components"
Section 5.2.1.4, "Step 4: Make the Report Available to Analytics Users"
Section 5.2.1.5, "Step 5: Test the New Report"
5.2.1.1 Step 1: Create the XML File
The first step is to create an XML file called report_newbrowser.xml.
-
In a text editor, create a new file named
report_newbrowser.xml. -
Paste the following code into the file:
<report type="std" name="newbrowser"> <param type="request" name="rgrpid" key="rgrpid" required="false" /> <param type="request" name="siteid" key="siteid" required="true" /> <module type="simpletext" name="helloworld" > <display type="html"> <text> <![CDATA[ <div> Hello World! FatWire is greeting you! </div> ]]> </text> </display> </module> </report> -
Save and close the file.
5.2.1.2 Step 2: Place the XML File in the Analytics Reports Directory
Copy the report file to the directory defined by the report_instdir parameter in the global.xml configuration file, so that Analytics can access the report file. For information on the global.xml file and its location, see the Oracle Fusion Middleware WebCenter Sites Installation Guide.
5.2.1.3 Step 3: Label the Report Components
You must now define the labels for areas such as the report name, module headings, and so on. The labels you define will be displayed in the reporting interface when the report is generated.
Note:
Component labeling in Analytics is implemented using the ResourceBundle Java class. For more information on this class, see the following URL:
http://java.oracle.com/developers/technicalArticles/Intl/ResourceBundles/
-
In a text editor, create a new file named
NewBrowsersLocalization.properties. -
Save the file in a directory that is within your application server's classpath. In this exercise, place it in the
WEB-INF/classesdirectory inside theanalyticsweb application directory on your application server. -
In the property file, add a statement for each parameter string that you want to label in the reporting interface. For now, you will give the report a name, and give the "Hello World" module a heading. Add the following statements to the property file:
report_newbrowser=New Browsers
report_newbrowser_module_helloworld=My first report in Analytics!
Note:
You must use the following syntax when adding statements to the property file:
-
Report name:
report_reportName -
Module names:
report_reportName_module_moduleName -
Column heads in a table:
report _reportName_module_column_columnName
-
-
When you have added the two statements, save and close the file.
-
Register the property file with Analytics by adding its name to the
global.xmlfile as follows:-
Open the
global.xmlfile (usually located in theWEB-INF/classesdirectory inside theanalyticsweb application directory on your application server) in a text editor. -
Locate the
<locales></locales>section and insert the following statement inside it:<locale name="NewBrowserLocalization" /> -
Save and close the file.
-
-
Restart the application server for your changes to take effect.
5.2.1.4 Step 4: Make the Report Available to Analytics Users
In order to make the new report available to your Analytics users, you must register the report with Analytics, add it to a report group, and grant users access to the report.
-
Log in to the Analytics administration interface as
csuser/csuservia the following URL:http://<hostname>:<port>/analyticsadmin/Admin?advmode=true
Note:
The
advmode=trueparameter gives you access to advanced configuration options normally unavailable in the administration interface. -
Register the new report with Analytics:
-
In the "Report" section of the left-hand pane, click Register.
-
Analytics displays the "Add/Edit Report" form.
-
In the Name field, enter
newbrowser.This is the object handle for your report. The value you enter here will be used to refer to the report in code (you used this name when you labeled the components of your report in Section 5.2.1.3, "Step 3: Label the Report Components"). This name will not be displayed in the reporting interface.
-
In the Config-file path field, enter
report_newbrowser.xml. -
Click Save.
-
-
Add the new report to the "Favorites" report group:
-
In the "Report to Reportgroup" section of the left-hand pane, click Assign.
Analytics displays the "Report Group" form.
-
In the "Report Group" drop-down list, select user.
-
In the list of reports, select the check box next to newbrowser.
-
In the "Report Group" drop-down list, select favorite.
-
In the list of reports, select the check box next to newbrowser.
-
Click Save.
-
-
Grant users access to the report:
-
In the "Access Rights" section of the left-hand pane, click Grant rights.
-
Analytics displays the "User Groups" form.
-
In the form, select the check box next to newbrowser.
-
Click Save.
-
5.2.1.5 Step 5: Test the New Report
Generate the report to check that it is behaving as intended.
-
Log in to the Analytics reporting interface as
csuser/csuservia the following URL:http://<hostname>:<port>/analytics/Reports.do
-
In the "Group" drop-down list in the left-hand pane, select Favorites.
-
In the "Report" list, double-click New Browsers.
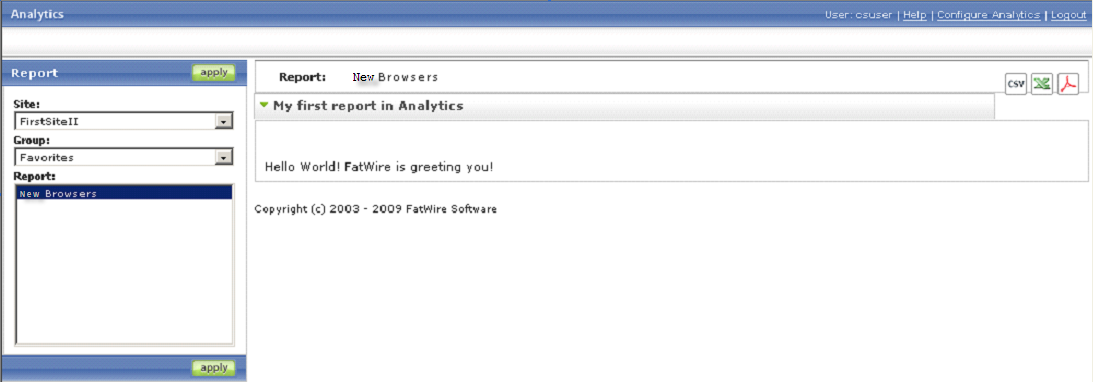
Analytics displays your report. The report should look similar to the one in Figure 5-2:
-
If your report does not appear as in the above figure, or if an error is displayed, retrace your steps and check your code for errors.
Once you have verified your report is behaving as intended, continue on to Section 5.2.2, "Adding a Table."
5.2.2 Adding a Table
A table is the primary way of presenting data in an Analytics report. In this section, you will add a table to your "NewBrowsers" report that will display several categories of information on different browsers.
You add a table to your report by inserting a table module into your report's code. A table module has two sections (as shown in the example in the Section 5.1, "Report Design"):
-
Data retrieval section (enclosed within the
<sql>tag, lines b–� below). This section contains the SQL code that retrieves the data you want to display in your table from the Analytics database. -
Display section (enclosed within the
<display>tag, lines �–� below). This section contains the code that formats and displays the data retrieved from the Analytics database by the code in the data retrieval section. The code in the display section defines the layout of the table and the formatting applied to each column.In this section, you will add the "NewBrowsers" table to your report. The table will display the following columns:
-
Name
-
Sessions
-
Percent of All Sessions
-
Chart
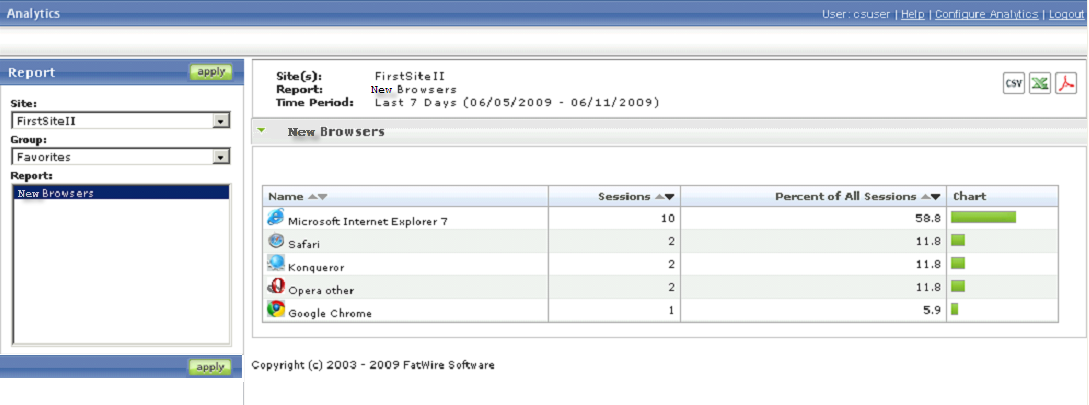
The table will look like the one in Figure 5-3:
Figure 5-3 Table for the "New Browsers" Report

Description of "Figure 5-3 Table for the "New Browsers" Report"
-
-
Open your
report_newbrowser.xmlfile and replace the "Hello World" test module with the following code:-
<query>
-
bro.id as broid,
-
bro.name as broname,
-
bro.iconpath as broiconpath,
-
nvl(count, 0) as count,
-
<equals name="browsertotal" value="0">
-
0 as percent
-
</equals>
-
<notEquals name="browsertotal" value="0">
-
(nvl(count, 0)/#browsertotal#)*100 as percent
-
</notEquals>
-
from
-
l2_browser bro
-
join (
-
select
-
bro2.id as broid,
-
bro2.name as broname,
-
join l3_datexsitexnewbrowserxcount l3 on (dates.id = l3.dateid)
-
<notNull name="filter-browsername">
-
and lower(bro2.name) like lower(replace('#filter-
-
browsername#','*','%'))
-
bro2.id, bro2.name
-
<column name="broname" columntype="text" sortrscolumn="broname">
-
<valueparam name="src" value="#imgpath#/browser/#broiconpath#" />
-
<valueparam name="alt" value="#broname#" />
-
<valueparam name="text" value="#broname#" />
-
<valueparam name="width" value="16" />
-
<valueparam name="height" value="16" />
-
</value>
-
<column name="count" columntype="number" sortrscolumn="count">
-
<value type="number">
-
<valueparam name="format" parse="false" value="#####0" />
-
<valueparam name="value" value="#count#" />
-
</value>
-
<column name="percent" columntype="number" sortrscolumn="count">
-
<value type="number">
-
<valueparam name="format" parse="false" value="#####0.0" />
-
<valueparam name="value" value="#percent#" />
-
</value>
-
<value type="chart">
-
<valueparam name="format" parse="false" value="#####0" />
-
<valueparam name="value" value="#percent#" />
-
<valueparam name="maxvalue" value="100" />
-
<valueparam name="width" value="100" />
-
<valueparam name="image" value="#imgpathstyle_branding#graph_blue.gif" />
-
</value>
-
</module>
The code above is analyzed as follows:
-
In the data retrieval section, a select query retrieves the required rows (
broid,broname,broiconpath,count,percent) from theL3_DATEXSITEXNEWBROWSERXCOUNTandL2_BROWSERtables (lines d-�). You access these values from the display section by calling them enclosed within hash (#) signs, (for example,value="#broname#"in line �). -
The
<dynamicOrderBy>tag in line � defines how the rows should be ordered. In our example, the value"count-desc"indicates the rows are ordered by the number of sessions, in descending order. -
In the display section, the
<column>statements define columns that constitute your table (lines �-�, �-�, �-�, and �-�). Each column definition is responsible for one column in the table and takes the following parameters:name(required) – specifies the object handle for the column. You use this handle to specify a label for the column in theNewBrowserLocalization.propertiesfile.columntype(required) – specifies the type of the column. Your table uses number, text, and string columns.sortrscolumn(required) – specifies whether the column should be sortable, and if so, how the data should be sorted.Note:
A sortable column displays a small arrow in its heading that indicates the direction in which its values are being sorted. Clicking the arrow reverses the sort order.
-
The following columns are defined in our example:
The
bronamecolumn of type text (lines �-�) displays the name of the browser along with the corresponding icon. Columns of type text may have a value parameter (lines �-�) of type image, number, string, date etc. (parameter type is defined in the value tag). Here thebronamecolumn is composed of two different types of values namely image and string. The value of type image can have several value-parameters, including, but not limited to:src(source path),alt(alternative text),width, andheight, which collectively define the rendition of the image on the report.The
countcolumn (lines �-�) of type number displays the number of sessions that have come from the browser. Columns of typenumbermust have avalueparameter (lines �-�) of typenumber(parameter type is defined in thevaluetag) which specifies what data should be displayed (value parameter, line �, and how the data should be formatted (format parameter, line �).The
percentcolumn (lines �-�) of type number displays the percent of sessions with respect to all sessions that have come from all different browsers.The
chartcolumn (lines �-�) of type chart is the graphic representation of thepercentcolumn.
-
-
Save and close the file.
-
Label the table and column headings as follows:
-
Open the
NewBrowserLocalization.propertiesfile (in this exercise, located in theWEB-INF/classesdirectory in theanalyticsapplication directory on your application server) in a text editor. -
Add the following statements at the end of the file:
# Report New Browser
report_newbrowser=Browsers
report_newbrowser_module_browser_column_broname=Name
report_newbrowser_module_browser_column_count=Sessions
report_newbrowser_module_browser_column_percent=Percent of All Sessions
report_newbrowser_module_browser_column_chart=Chart
report_newbrowser_module_browser=Browsers
-
Save and close the file.
-
Restart your application server for your changes to take effect.
-
-
Test your report. At this point, it should look similar to the one in Figure 5-4:
Figure 5-4 "New Browsers" Report Displaying the Added Table
Description of "Figure 5-4 "New Browsers" Report Displaying the Added Table"
-
If your report does not appear as in Figure 5-4, or if an error is displayed, retrace your steps and check your code for errors.
-
Continue on to Section 5.2.3, "Adding a Time Period Selector."
5.2.3 Adding a Time Period Selector
Now that your "NewBrowsers" report displays data, you will add a time period selector. This selector is a very useful feature, as it allows you to limit the amount of data displayed in the report to a specific time period. For example, you might want to view visitor activity that happened during a specific day or even hour, instead of all activity captured to date.
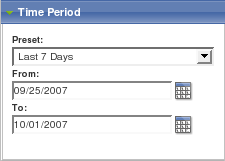
The time period selector will appear in the navigation pane in the reporting interface when you access the report:
To enable time period selection in your report
-
Open the
report_newbrowser.xmlfile (located in the Analytics reports directory described in Section 5.2.1.2, "Step 2: Place the XML File in the Analytics Reports Directory") in a text editor. -
Locate the global parameter section and add the parameters (shown in bold type, below):
<param type="request" name="rgrpid" key="rgrpid" required="false" />
      <param type="request" name="timepreset" key="timepreset" required="false">
         <restriction type="listvalue">
           <restrictionvalue value="yesterday" />
           <restrictionvalue value="lastweek" />
           <restrictionvalue value="lastmonth" />
           <restrictionvalue value="last7days" />
           <restrictionvalue value="last4weeks" />
           <restrictionvalue value="last12months" />
         </restriction>
      </param>
      <param type="request" name="siteid" key="siteid" required="true" />
      <param type="request" name="sdate" key="sdate" required="true">
         <restriction type="isDate" value="dd.MM.yyyy" />
      </param>
      <param type="request" name="edate" key="edate" required="true">
         <restriction type="isDate" value="dd.MM.yyyy" />
      </param>
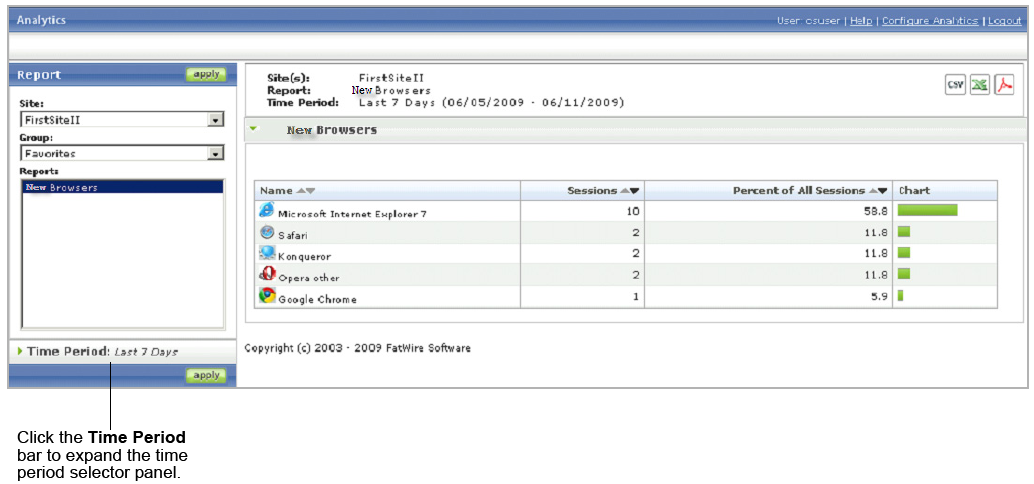
The new parameters cause the "Time Period" panel to appear in the left-hand navigation pane when the report is accessed.
-
Insert the code (shown in bold type, below) into the data retrieval section of the table module at the exact locations shown:
select bro.id as broid, bro.name as broname, bro.iconpath as broiconpath, nvl(count, 0) as count, <equals name="browsertotal" value="0"> 0 as percent </equals> <notEquals name="browsertotal" value="0"> (nvl(count, 0)/#browsertotal#)*100 as percent </notEquals> from l2_browser bro join ( select bro2.id as broid, bro2.name as broname, sum(count) as count from help_dates dates join l3_datexsitexnewbrowserxcount l3 on (dates.id = l3.dateid) join l2_browser bro2 on (l3.browserid = bro2.id) where<![CDATA[ siteid = #siteid# and dates.dat >= to_date('#sdate#', 'DD-MM-YYYY') and dates.dat < to_date('#edate#', 'DD-MM-YYYY')+1 ]]> group by bro2.id, bro2.name ) on (bro.id = broid) -
Save and close the file.
-
Test your report. The report should now look like the one in Figure 5-6:
Figure 5-6 New Browsers Resport Displaying the Time Period Selector
Description of "Figure 5-6 New Browsers Resport Displaying the Time Period Selector"
-
Test the time period selector.
-
Click the Time Period bar to expand the time period selector panel.
-
Select the desired start date and end date.
-
Click Apply.
The data displayed in the table should change depending on the selected time period. If it does not, or if an error is displayed, retrace your steps and check your code for errors.
-
-
Continue on to Section 5.3, "Adding a Filter."
5.3 Adding a Filter
In the previous section you added a time period selector to your report to enable restriction of the displayed data to a specific time period. However, what if you want to restrict the displayed data by a parameter other than time? Your solution is to add a data filter.
5.3.1 What Does a Filter Do?
A filter module adds the "Filter by" field in the summary section of the report, and allows the users to:
-
Search for a specific data point or value (for example, a specific browser).
-
Restrict the displayed data to a specific range of a particular parameter (such as the number of recorded sessions)
You will add the following filter to your "NewBrowsers" report:
-
A "Browser Name" filter, which will allow you to search for specific browsers or to restrict the displayed data to a specific range of browser names.
5.3.2 How Do I Add a Filter?
To implement a filter, you must:
-
Add the filter module that defines your filter(s) to the report code.
-
Modify the data retrieval sections of your display modules (such as table or chart modules) to support query filtering.
-
Open the
report_newbrowser.xmlfile (located in the Analytics reports directory described in Section 5.2.1.2, "Step 2: Place the XML File in the Analytics Reports Directory") in a text editor. -
Add the following module code after the table module but before the closing
</report>element:<filter name="filter-browsername" required="false" type="text" captions="name" key="filter-browsername" />
The code above is analyzed as follows:
Note:
For detailed information on the tags shown in this example, and the parameters they take, see the Oracle Fusion Middleware WebCenter Sites: Analytics Tag Reference.
You define the filter by using a
filtertag, which takes the following parameters:-
name(required) – specifies an object handle for the filter. The following conditions apply to this parameter:-
The value of this parameter must begin with
filter-so that Analytics treats this definition as a filter definition. -
The value must be identical to the value of the
keyparameter (explained below).Note:
If either of these conditions is not met, the filter will not function.
-
-
required(required) – specifies whether thekeyparameter (explained below) must be assigned a value for the report to function. In our example,requiredis set tofalse. -
type(required) – specifies the type of the filter and, simultaneously, the filter's input method (for example, how the filter will be presented in the reporting interface). -
In this example, you are using a filter of type
text, which manifests the filter as a text field into which the user can enter one or more filtering criteria. Other available types includeyesno,radio,dbselect,date, and others. -
key(optional, seerequiredabove) – specifies the name used for the parameter in the URL of the report page to pass the value of the filter entered by the user when the user clicks Apply. The following conditions apply to this parameter:-
The value of this parameter must begin with
filter-so that Analytics treats this definition as a filter definition. -
The value must be identical to the value of the
nameparameter (explained above).Note:
If either of these two conditions is not met, the filter will not function.
-
-
-
Insert the code (shown in bold type, below) into the data retrieval section at the exact locations shown:
select
bro.id as broid,
bro.name as broname,
bro.iconpath as broiconpath,
nvl(count, 0) as count,
<equals name="browsertotal" value="0">
 0 as percent
</equals>
<notEquals name="browsertotal" value="0">
 (nvl(count, 0)/#browsertotal#)*100 as percent
</notEquals>
from
l2_browser bro
join (
  select
  bro2.id as broid,
  bro2.name as broname,
  sum(count) as count
  from
  help_dates dates
  join l3_datexsitexnewbrowserxcount l3 on (dates.id = l3.dateid)
  join l2_browser bro2 on (l3.browserid = bro2.id)
  where<![CDATA[
        siteid = #siteid# and
        dates.dat >= to_date('#sdate#', 'DD-MM-YYYY') and
        dates.dat  < to_date('#edate#', 'DD-MM-YYYY')+1 ]]>

  <notNull name="filter-browsername">
    and lower(bro2.name) like lower(replace('#filter-browsername#','*','%'))
  </notNull>

  group by
  bro2.id, bro2.name
) on (bro.id = broid)
The code above is analyzed as follows:
-
The inserted code limits the results returned by the SQL query based on the criteria provided to the filter (for example, the filter value).
-
The code inside each
<notNull>tag is added to the query only if the value of the parameter called by the<notNull>tag is not null.
-
-
Save and close the report file. Open the
NewBrowserLocalization.propertiesfile (in this exercise, located in theWEB-INF/classesdirectory in theanalyticsapplication directory on your application server) in a text editor. Add the following line to the end of the file:report_newbrowser_filter-browsername=Filter By Browser Name
-
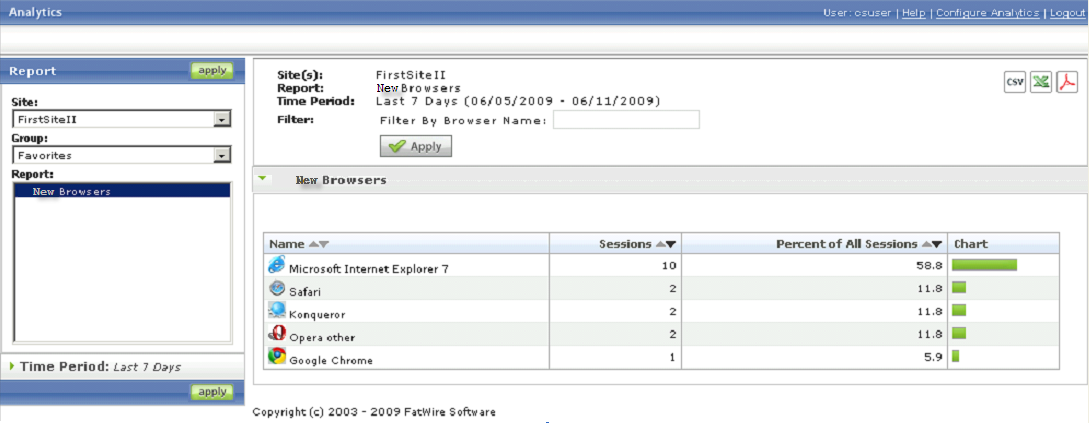
Test your report. The "Filter" field should appear in the summary section at the top of the report, as shown in Figure 5-7:
Figure 5-7 "New Browsers" Report Displaying the Filter field
Description of "Figure 5-7 "New Browsers" Report Displaying the Filter field"
If your report does not appear as in the above figure, or if an error is displayed, retrace your steps and check your code for errors.
-
Continue on to Section 5.3.3, "Adding a Chart."
5.3.3 Adding a Chart
The final step in this exercise will be to add a chart to your "NewBrowsers" report. A chart allows you to graphically present statistical data in your report.
You add a chart to your report by inserting a chart module into your report's code. A chart module is structured in a way similar to the table module. It has two sections:
-
Data retrieval section (see step 5). This section contains the SQL code that retrieves the data you want to display in your pie chart from the Analytics database.
-
Display section (enclosed within the
<display>tag in step 6). This section contains the code that formats and displays the data retrieved from the Analytics database by the code in the data retrieval section. The code in the display section defines the type of the chart and assigns data to the chart's axes.
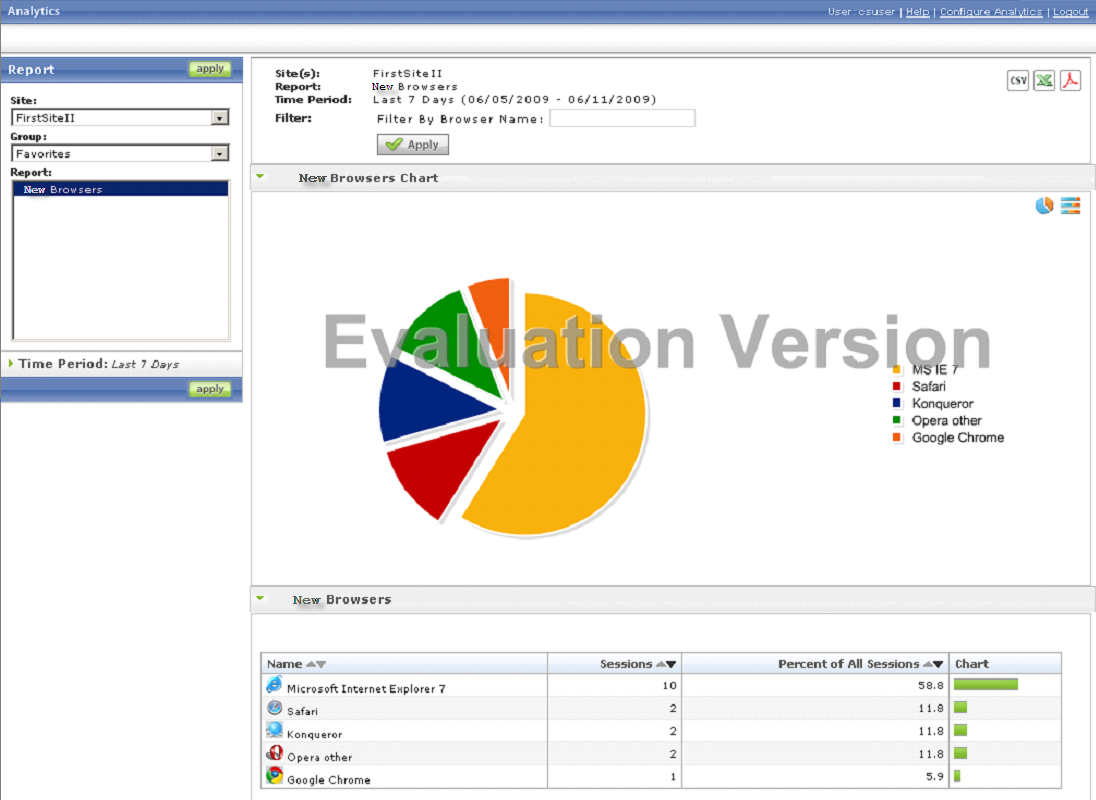
In our example, you will create a pie chart (XY chart, refer to step 2 below) displaying session-count of all browsers in percentage format. Each section of the pie chart will display browser data, along with a legend section at the right of the chart. If you hover the mouse on the pie section, the percentage of session count will be displayed along with the browser's name.
To add the chart to your report
-
Open the
report_newbrowser.xmlfile (located in the Analytics reports directory described in Section 5.2.1.2, "Step 2: Place the XML File in the Analytics Reports Directory") in a text editor. -
Add the following module declaration at the beginning of the report code, right after the last global parameter definition, but before the table module. This will cause the chart to appear above the table when the report is generated.
Note:
The order in which modules appear in your code is the order in which they will appear in the reporting interface. (The exception to this is the filter module which has a fixed location in the summary section at the top of the report.)
<module type="stdchart" name="chartbrowser">
<param type="request"
       name="charttype"
       key="chartbrowser_charttype"
       default="pie_labeled">
  <restriction type="listvalue">
    <restrictionvalue value="pie_labeled" />
    <restrictionvalue value=" bar_labeled " />
  </restriction>
</param>
The code above is analyzed as follows:
-
Module of type
stdchartdefines this as a chart module. You assign an object handle to the module using thenameparameter. You will use this handle to give your chart module a heading later on in this procedure by declaring it in the report's localization properties file. -
The
<param>tag defines the desired style for your chart. Parameter of typerequestand namecharttypespecify the chart type by assigning a value to thekeyparameter. The value of the key parameter must follow the syntax,moduleName_chartstyle. In our example, you are using thechartbrowser_charttypechart type.Note:
The available chart styles are defined in the Swiff Chart Generator software and are referenced by Analytics. The following default Swiff Chart Generator chart styles are supported: area, bar, column, line, and pie.
-
The
<restriction>tag enables validation of request parameters. Only parameter values defined by each<restrictionvalue>tag are allowed; an error message will be displayed for all other values.
-
-
Now, add the following parameters to the chart module:
<param type="string" name="chart_max_display" value="10"/>
<param type="string" name="chart_display_rest" value="true"/>
-
The
chart_max_displayparameter denotes that the pie chart will display ten different colored pie sections corresponding to the top 10 popular browsers. Thechart_display_restparameter denotes that the rest of the browser session counts will be shown as a single pie chart section. These two parameters are optional, and in the absence of these parameters the reporting engine takes the default values for chart rendering. -
Add the data retrieval section to your chart module. Insert the following code after the chart module declaration you added in the previous step:
select
bro.id as broid,
bro.name as broname,
nvl(count, 0) as count,
<equals name="browsertotal" value="0">
  0 as percent
</equals>
<notEquals name="browsertotal" value="0">
  (nvl(count, 0)/#browsertotal#)*100 as percent
</notEquals>
from
l2_browser bro
join (
  select
  bro2.id as broid,
  bro2.name as broname,
  sum(count) as count
  from
  help_dates dates
  join l3_datexsitexnewbrowserxcount l3 on (dates.id = l3.dateid)
  join l2_browser bro2 on (l3.browserid = bro2.id)
  where<![CDATA[
        siteid = #siteid# and
        dates.dat >= to_date('#sdate#', 'DD-MM-YYYY') and
        dates.dat < to_date('#edate#', 'DD-MM-YYYY')+1 ]]>
  group by
  bro2.id, bro2.name
) on (bro.id = broid)
The code above is analyzed as follows
The SQL query retrieves the data that will be displayed on the pie chart. Note that the data retrieval query in the chart module is similar to the query of the table module. The only difference is that the data retrieval query for the chart module lacks the filter part, (for example, the data on the chart will not be filtered by the filter input, only table data will be filtered). However you can add the same filter in the query to filter the chart data.
-
Add the display section code to your chart module. Insert the following code after the data retrieval section you added in the previous step:
<display type="html">
  <value name="xaxis" type="string">
      <valueparam name="format" parse="false"/>
      <valueparam name="value" value="#broname#" />
  </value>

  <value name="yaxis" type="number">
      <valueparam name="format" parse="false" value="#####0" />
      <valueparam name="value" value="#count#" />
  </value>
</display>
The code above is analyzed as follows:
In the display section, you define the axes for your chart and assign the appropriate data to each axis.
Analytics distinguishes between two categories of charts:
-
XY charts are charts that have no axes, such as pie charts, and therefore require no legend for the data series (and thus, no Z axis declaration)
-
XYZ charts are charts that have axes, (such as line, bar, area, and column charts) and therefore require that the data series legend be defined through a Z axis declaration.
In our example you are defining a pie chart, which is an XY chart so there will be no Z axis. However, we assign the different categories/data points (browser names in this exercise) to the X axis (value name="xaxis") and values for each categories (here session count) to Y axis (value name="yaxis")
-
-
Save and close the file.
-
Give your chart a heading. Do the following:
-
Open the
NewBrowserLocalization.propertiesfile (in our example, located in theWEB-INF/classesdirectory in theanalyticsapplication directory on your application server) in a text editor. -
Add the following statement at the end of the file:
# Chart Module
report_newbrowser_module_chartvisitordetail=Browsers Chart
-
Save and close the file.
-
Restart your application server for your changes to take effect.
-
-
Your report is now complete! Continue on to the final step in this exercise, Section 5.3.4, "Testing the Completed 'NewBrowsers' Report," to test your finished report and check your code.
5.3.4 Testing the Completed 'NewBrowsers' Report
Congratulations! You have successfully built your first Analytics report. Test your report to make sure there are no errors in the code.
-
Log in to the Analytics reporting interface and generate the "NewBrowsers" report.
Your report should look like the one in Figure 5-8:
Figure 5-8 Completed "New Browsers" Report
Description of "Figure 5-8 Completed "New Browsers" Report"
-
If your report does not appear as in the above figure, or if an error is displayed, retrace your steps and check your code for errors by comparing it to the sample code in Section 5.1.1, "'NewBrowsers' Report Code."
