6 Using Dashboards in Process Workspace
This chapter describes how users of Oracle Business Process Management Workspace can use and customize standard dashboards—that is, the graphs and drill-downs based on data previously computed in a process cube schema. Dashboards reflect the standard metrics gathered during the execution of a process.
This chapter contains these topics:
For information about troubleshooting human workflow issues, see Oracle Fusion Middleware Administrator's Guide for Oracle SOA Suite and Oracle Business Process Management Suite, "Human Workflow Troubleshooting".
6.1 Using Standard Dashboards
Standard dashboards are the graphs and drill-downs based on data previously computed in a process cube schema. They reflect the standard metrics gathered during the execution of a process.
In each of the standard dashboards, clicking a bar graph in the left pane causes data to be displayed graphically in the right pane. Clicking an item in the right pane displays certain data in the Work Items panel in the lower pane. This section explains how each type of dashboard operates.
You can customize the presentation of the Work Items panel in the lower pane. For information on how to do this, see Section 3.6, "Customizing the Presentation of Process Instances in Process Workspace".
This section contains these topics:
6.1.1 Participant Dashboards
Two types of standard participant dashboards enable you to analyze:
-
The workload of participants
-
The performance of participants
6.1.1.1 Participant Workload Dashboard
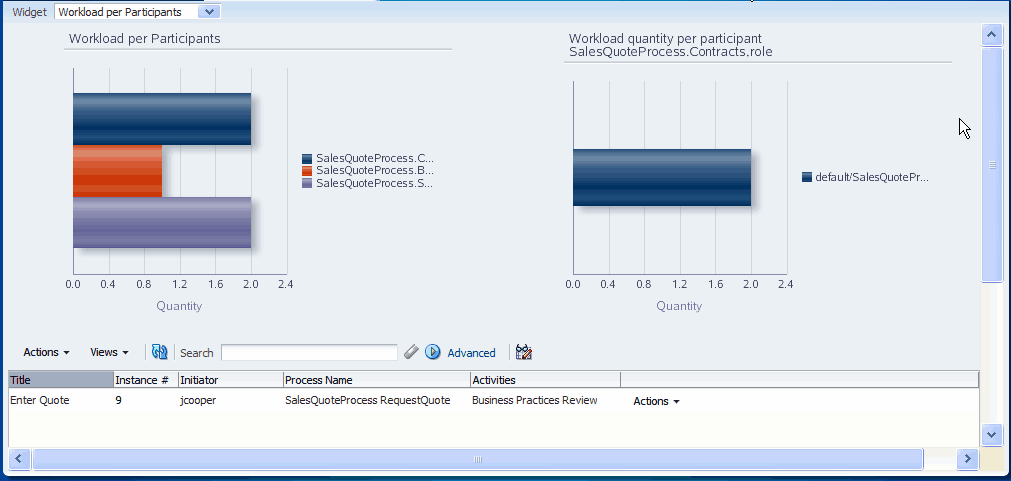
Figure 6-1 shows an example of a participant workload dashboard.
Figure 6-1 Participant Workload Dashboard

Description of "Figure 6-1 Participant Workload Dashboard"
The left panel of a participant workload dashboard displays the total number of active instances waiting for completion for each participant across all processes. When you drill down into the chart for a specific participant, the right panel displays the total number of active instances waiting for completion by process for either the selected participant or the selected role. The last drill-down displays the active instances waiting for completion for either the selected participant or the selected role and process.
Note:
In this release, participant information in a workload dashboard is for the physical role corresponding to the swimlane for the task. When the swimlane role is not defined, the corresponding participant information is null.
6.1.1.2 Participant Performance Dashboard
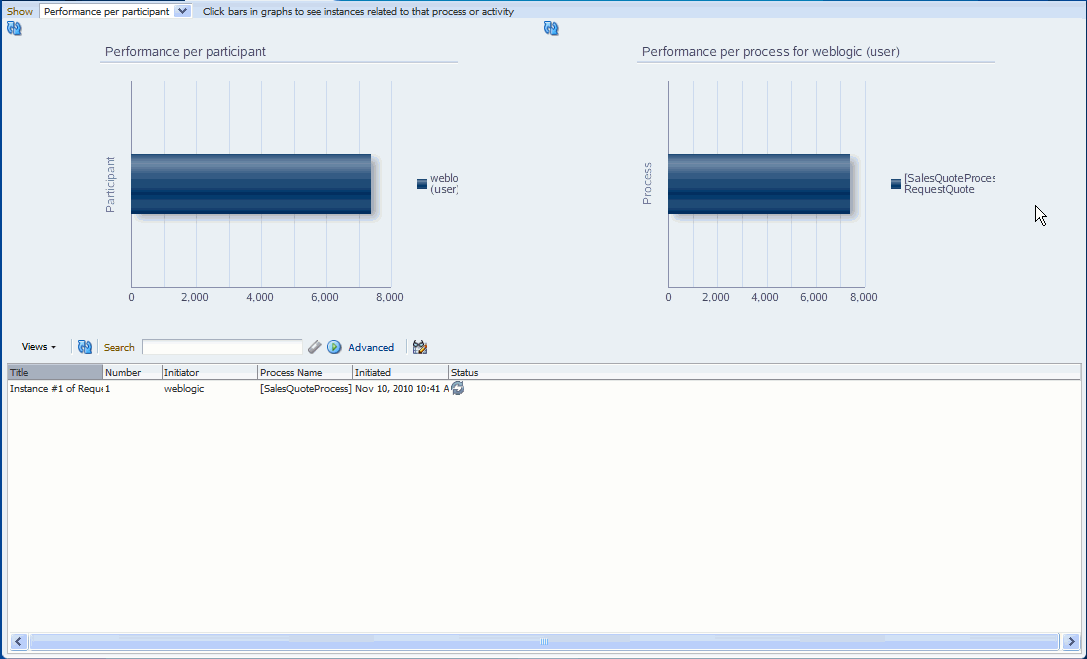
Figure 6-2 shows a participant performance dashboard.
The left panel of a participant performance dashboard displays the average time taken by participants across all processes. When you drill down into the chart for a specific participant, the right panel displays the average time taken to complete instances by process for the selected participant. The last drill-down displays the list of completed instances for either the selected participant or the selected role and process.
Note:
In this release, for processes that have user tasks with multiple users, user information is captured only for the last user that updated the task.
6.1.2 Process Dashboards
Two types of standard process dashboards enable you to analyze:
-
The number of process instances waiting for completion
-
The average time taken per process
6.1.2.1 Process Workload Dashboard
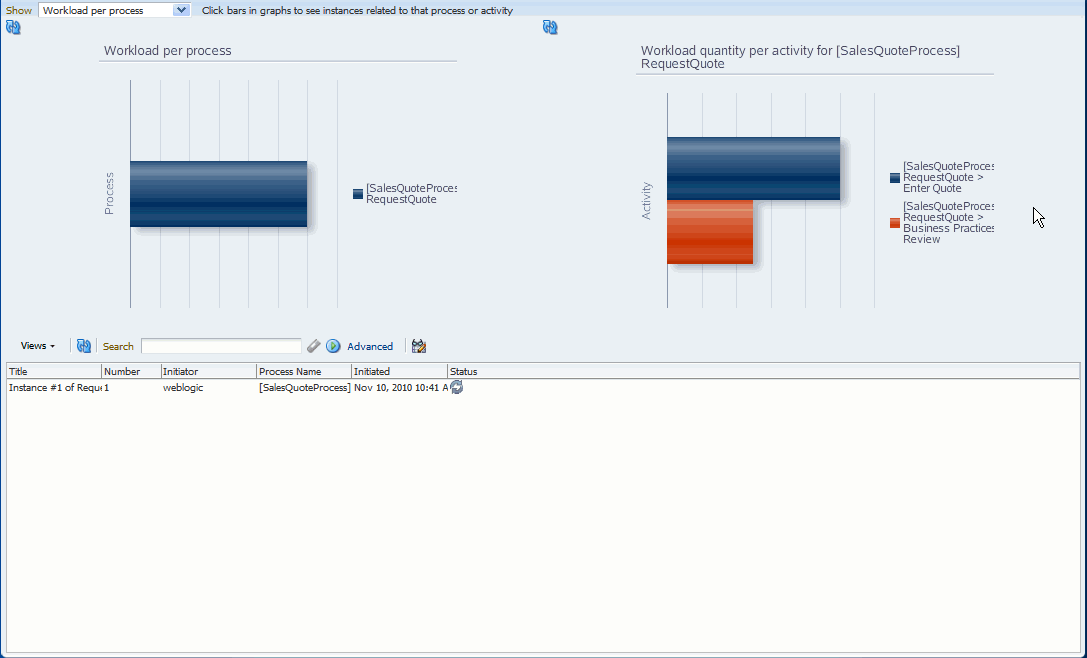
Figure 6-3 shows a process workload dashboard.
The left panel in the process workload dashboard displays the total number of active instances waiting for completion per process. When you drill down into a specific process, the right panel displays the total number of active instances waiting for completion for activities in the selected process. The last drill-down displays the active instances waiting for completion for the selected activity and process.
6.1.2.2 Process Performance Dashboard
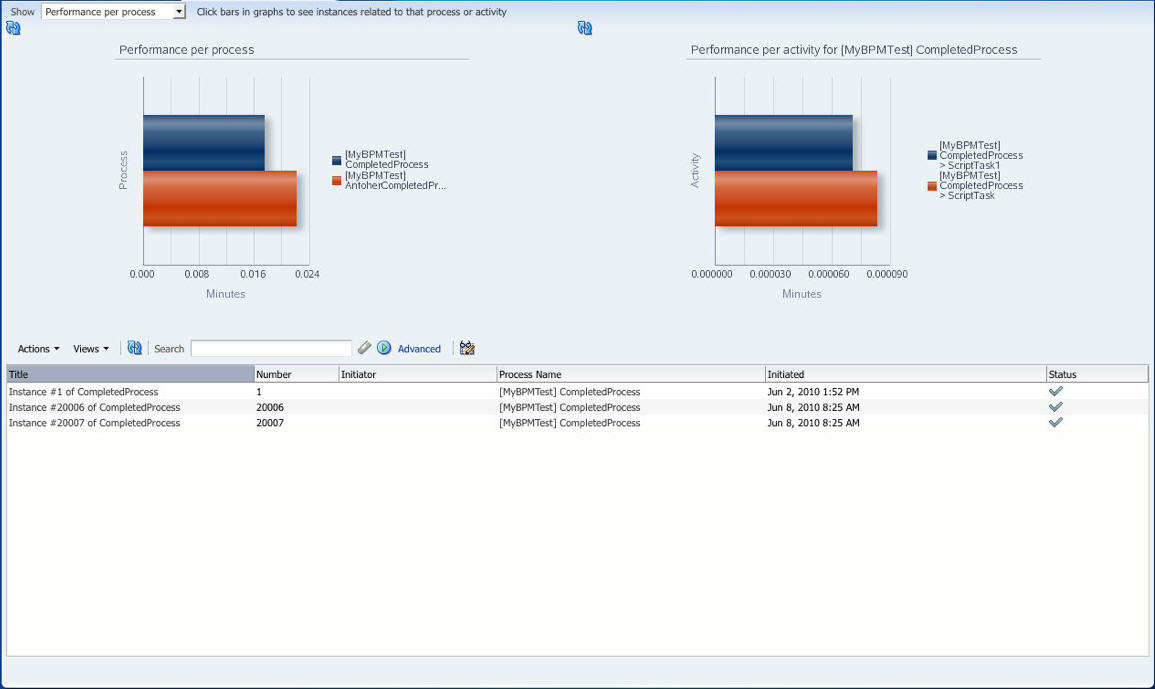
The left panel in the process performance dashboard displays the average time taken per process. When you drill down into a specific process, the right panel displays the average time taken to complete by activities in the selected process. The last drill-down displays the completed instances for the selected activity and process.
Figure 6-4 shows a process performance dashboard.
6.2 Creating Custom Dashboards
As with standard dashboards, custom dashboards are the graphs and drill-downs based on data previously computed in a process cube schema. They reflect the standard and user-defined metrics gathered during the execution of the process. They enable you to define new graphs using both standard metrics and user-defined metrics specified by using business indicators.
For instructions about adding a custom dashboard, see Section 5.1.1, "How to Create a Custom Page in Process Workspace".
6.2.1 Specifying Graph Content
Graph content is specified by defining a data source.
For information about invoking the data source dialog box, see Section 5.1.4, "How to Add a Dashboards Panel to a Customized Page in Process Workspace."
Specify the following data source information:
-
Name: Provide a data source identifier
-
Title: Provide the title used while displaying the data source
-
Graph Type: Select one of the following list of graph types:
-
Area
-
Percent Area
-
Stacked Area
-
Horizontal Bar
-
Horizontal Percent Bar
-
Horizontal Stacked Bar
-
Bar
-
Percent Bar
-
Stacked Bar
-
Line
-
Percent Line
-
Stacked Line
-
Pie
-
Pie Bar
-
Multiple Pie
-
-
Process: Select the process from the list. All business indicators associated with the selected process become available for the data source definition.
-
Data Type: Select one of the following supported data types:
-
Workload
-
Activity and Measurement Sampling
-
Process Level Sampling
-
-
Series: Specify the dimension. Series variables categorize the data. The series variable values are displayed in the legend area labels in the chart.
Use Range: Select to use ranges for dimensions with ranges.
-
Group: Specify the dimension used to group the dimensions used in a series. Group variables also categorize the data. The group variable values are displayed as labels along one of the axis in the chart.
Use Range: Select to use ranges for dimensions with ranges.
Note:
Group and Series variables can be used together to perform nested categorization of chart data, in which case, series values are displayed under each group. For example, Total revenue by customer (series) and by product (group).
-
Drilldown to Series: Select a drill down series variable which is propagated to a listening dashboard panel. As a result, a drill down dashboard is displayed in the listening dashboard panel.
For more information, see Section 5.2, "Establishing Communication Between Panels in Process Workspace".
Use Range: Select to use ranges for dimensions with ranges.
Table 6-1 summarizes the standard dimensions available based on the Data Type selection. Additionally, all the process specific dimensions are available.
Table 6-1 Standard Dimensions Available
| Workload | Activity and Measurement Sampling | Process Sampling | |
|---|---|---|---|
|
Dimension: Series |
Revision Role Activities Participant |
Revision Role Activities Participant Completion Date |
Revision Completion Date |
|
Dimension: Group |
Participant |
Participant Completion Date |
Completion Date |
-
Variable: Specify the measurement
Table 6-2 summarizes list of standard measurements available based on the Data Type selection. Additionally, all the process-specific measurements are available.
-
Operation Type: Specify the aggregation functions to be applied on the measurement variables selected.
Table 6-3 summarizes the operation types that can be used with various Data Type selections.
-
Value Type: Select one of the following values: Value, Day(s), Hours, Minutes, Seconds, Percentage
Note:
If a new process is deployed while you have a dashboards page open, the new process will not be listed in the Data Sources dialog box until you log out of Process Workspace and then log back in.
You can add filter conditions based on the measure variables, series, and groups. You can add the filter condition only if a process is selected from the Process list. If "All" is selected in the Process list, then the Filters section is disabled.
Note:
If you add a filter for business indicators, that filter filters out the values initially based on the condition given. Aggregation—either the sum or the average—then applies to the resulting set of items.For example, if the user tries to compute the average of all business indicator values greater than 1000, the user will set a filter for this—for example: BI <Greater or equals> 1000 and set Operation type as "avg". The result is that the business indicator values greater than 1000 are collected first, and then the computation for the average calculation takes place.
6.3 Understanding Data Visibility Rules in Dashboards
This section discusses data visibility rules applicable to dashboards in Process Workspace.
This section includes the following topics:
6.3.1 Workload Sampling Data
The section discusses the restrictions applicable to workload sampling data and the application roles a user must have in order to view certain activities in Process Workspace. The restrictions are:
-
The workload for user task activities is seen by the member of the corresponding
swimlaneapplication role,process ownerapplication role orbpmprocessadminapplication role. Workloads are not tracked based individual user tasks participants. -
The workload for non user task activities is seen by the corresponding
process ownerapplication role members orbpmprocessadminapplication role members. -
If a process is associated with an organization unit, the corresponding workload sampling data is restricted to organization unit members or
bpmprocessadminapplication role members.
6.3.2 Activity and Measurement Sampling Data
This section discusses the restrictions applicable to activity and measurement sampling data and the application roles a user must have in order to view certain activities in Process Workspace. The restrictions are:
-
User task activities are seen by the last participant who acted on the user task or the corresponding
process ownerapplication role members orbpmprocessadminapplication role members. -
Non user task activities are seen by the corresponding
process ownerapplication role members orbpmprocessadminapplication role members. -
If a process is associated with an organization unit, the corresponding activity and measurement sampling data is restricted to organization unit members or
bpmprocessadminapplication role members.
6.3.3 Process Level Sampling Data
This section discusses the restrictions applicable to process level sampling data and the application roles a user must have in order to view certain activities in Process Workspace. The restrictions are:
-
If a process is associated with an organization unit, the process data is visible to the organizational unit members or bpmprocessadmin application role members.
-
If a process is not associated with an organization unit, it is visible to all users.


